Request Free Sample ×

Kindly complete the form below to receive a free sample of this Report

* Please use a valid business email

Leading companies partner with us for data-driven Insights

clients tt-cursor
Hero Background

Marché de l'affichage numérique

ID: MRFR/SEM/0596-CR
200 Pages
Ankit Gupta
Last Updated: June 01, 2026
Rapport d'étude de marché sur l'affichage numérique Informations par type de composant (matériel, logiciel et service), par secteur (commercial, institutionnel, infrastructure et institutionnel), et par région (Amérique du Nord, Europe, Asie-Pacifique et reste du monde) – Taille de l'industrie, part de marché et prévisions jusqu'en 2035
Download PDF ×

We do not share your information with anyone. However, we may send you emails based on your report interest from time to time. You may contact us at any time to opt-out.

  1. 1 SECTION I : RÉSUMÉ EXÉCUTIF ET POINTS CLÉS
    1. 1.1 RÉSUMÉ EXÉCUTIF
      1. 1.1.1 Vue d'ensemble du marché
      2. 1.1.2 Conclusions clés
      3. 1.1.3 Segmentation du marché
      4. 1.1.4 Paysage concurrentiel
      5. 1.1.5 Défis et opportunités
      6. 1.1.6 Perspectives futures
  2. 2 SECTION II : DÉLIMITATION, MÉTHODOLOGIE ET STRUCTURE DU MARCHÉ
    1. 2.1 INTRODUCTION AU MARCHÉ
      1. 2.1.1 Définition
      2. 2.1.2 Portée de l'étude
        1. 2.1.2.1 Objectif de recherche
        2. 2.1.2.2 Hypothèse
        3. 2.1.2.3 Limitations
    2. 2.2 MÉTHODOLOGIE DE RECHERCHE
      1. 2.2.1 Vue d'ensemble
      2. 2.2.2 Exploration de données
      3. 2.2.3 Recherche secondaire
      4. 2.2.4 Recherche primaire
        1. 2.2.4.1 Interviews primaires et processus de collecte d'informations
        2. 2.2.4.2 Répartition des répondants principaux
      5. 2.2.5 Modèle de prévision
      6. 2.2.6 Estimation de la taille du marché
        1. 2.2.6.1 Approche ascendante
        2. 2.2.6.2 Approche descendante
      7. 2.2.7 Triangulation des données
      8. 2.2.8 Validation
  3. 3 SECTION III : ANALYSE QUALITATIVE
    1. 3.1 DYNAMIQUE DU MARCHÉ
      1. 3.1.1 Vue d'ensemble
      2. 3.1.2 Facteurs moteurs
      3. 3.1.3 Contraintes
      4. 3.1.4 Opportunités
    2. 3.2 ANALYSE DES FACTEURS DU MARCHÉ
      1. 3.2.1 Analyse de la chaîne de valeur
      2. 3.2.2 Analyse des cinq forces de Porter
        1. 3.2.2.1 Pouvoir de négociation des fournisseurs
        2. 3.2.2.2 Pouvoir de négociation des acheteurs
        3. 3.2.2.3 Menace des nouveaux entrants
        4. 3.2.2.4 Menace des substituts
        5. 3.2.2.5 Intensité de la rivalité
      3. 3.2.3 Analyse de l'impact du COVID-19
        1. 3.2.3.1 Analyse de l'impact sur le marché
        2. 3.2.3.2 Impact régional
        3. 3.2.3.3 Analyse des opportunités et des menaces
  4. 4 SECTION IV : ANALYSE QUANTITATIVE
    1. 4.1 Semi-conducteurs et électronique, PAR TYPE DE COMPOSANT (milliards USD)
      1. 4.1.1 Matériel
      2. 4.1.2 Logiciel
      3. 4.1.3 Service
    2. 4.2 Semi-conducteurs et électronique, PAR VERTICAL (milliards USD)
      1. 4.2.1 Commercial
      2. 4.2.2 Institutionnel
      3. 4.2.3 Infrastructure
    3. 4.3 Semi-conducteurs et électronique, PAR RÉGION (milliards USD)
      1. 4.3.1 Amérique du Nord
        1. 4.3.1.1 États-Unis
        2. 4.3.1.2 Canada
      2. 4.3.2 Europe
        1. 4.3.2.1 Allemagne
        2. 4.3.2.2 Royaume-Uni
        3. 4.3.2.3 France
        4. 4.3.2.4 Russie
        5. 4.3.2.5 Italie
        6. 4.3.2.6 Espagne
        7. 4.3.2.7 Reste de l'Europe
      3. 4.3.3 APAC
        1. 4.3.3.1 Chine
        2. 4.3.3.2 Inde
        3. 4.3.3.3 Japon
        4. 4.3.3.4 Corée du Sud
        5. 4.3.3.5 Malaisie
        6. 4.3.3.6 Thaïlande
        7. 4.3.3.7 Indonésie
        8. 4.3.3.8 Reste de l'APAC
      4. 4.3.4 Amérique du Sud
        1. 4.3.4.1 Brésil
        2. 4.3.4.2 Mexique
        3. 4.3.4.3 Argentine
        4. 4.3.4.4 Reste de l'Amérique du Sud
      5. 4.3.5 MEA
        1. 4.3.5.1 Pays du CCG
        2. 4.3.5.2 Afrique du Sud
        3. 4.3.5.3 Reste de la MEA
  5. 5 SECTION V : ANALYSE CONCURRENTIELLE
    1. 5.1 Paysage concurrentiel
      1. 5.1.1 Vue d'ensemble
      2. 5.1.2 Analyse concurrentielle
      3. 5.1.3 Analyse de la part de marché
      4. 5.1.4 Stratégie de croissance majeure dans les semi-conducteurs et l'électronique
      5. 5.1.5 Évaluation comparative
      6. 5.1.6 Acteurs principaux en termes de nombre de développements dans les semi-conducteurs et l'électronique
      7. 5.1.7 Développements clés et stratégies de croissance
        1. 5.1.7.1 Lancement de nouveaux produits / Déploiement de services
        2. 5.1.7.2 Fusions et acquisitions
        3. 5.1.7.3 Coentreprises
      8. 5.1.8 Matrice financière des principaux acteurs
        1. 5.1.8.1 Ventes et revenu d'exploitation
        2. 5.1.8.2 Dépenses de R&D des principaux acteurs. 2023
    2. 5.2 Profils d'entreprise
      1. 5.2.1 Samsung Electronics (KR)
        1. 5.2.1.1 Vue d'ensemble financière
        2. 5.2.1.2 Produits offerts
        3. 5.2.1.3 Développements clés
        4. 5.2.1.4 Analyse SWOT
        5. 5.2.1.5 Stratégies clés
      2. 5.2.2 LG Electronics (KR)
        1. 5.2.2.1 Vue d'ensemble financière
        2. 5.2.2.2 Produits offerts
        3. 5.2.2.3 Développements clés
        4. 5.2.2.4 Analyse SWOT
        5. 5.2.2.5 Stratégies clés
      3. 5.2.3 NEC Display Solutions (JP)
        1. 5.2.3.1 Vue d'ensemble financière
        2. 5.2.3.2 Produits offerts
        3. 5.2.3.3 Développements clés
        4. 5.2.3.4 Analyse SWOT
        5. 5.2.3.5 Stratégies clés
      4. 5.2.4 Sharp Corporation (JP)
        1. 5.2.4.1 Vue d'ensemble financière
        2. 5.2.4.2 Produits offerts
        3. 5.2.4.3 Développements clés
        4. 5.2.4.4 Analyse SWOT
        5. 5.2.4.5 Stratégies clés
      5. 5.2.5 Sony Corporation (JP)
        1. 5.2.5.1 Vue d'ensemble financière
        2. 5.2.5.2 Produits offerts
        3. 5.2.5.3 Développements clés
        4. 5.2.5.4 Analyse SWOT
        5. 5.2.5.5 Stratégies clés
      6. 5.2.6 Panasonic Corporation (JP)
        1. 5.2.6.1 Vue d'ensemble financière
        2. 5.2.6.2 Produits offerts
        3. 5.2.6.3 Développements clés
        4. 5.2.6.4 Analyse SWOT
        5. 5.2.6.5 Stratégies clés
      7. 5.2.7 Cisco Systems (US)
        1. 5.2.7.1 Vue d'ensemble financière
        2. 5.2.7.2 Produits offerts
        3. 5.2.7.3 Développements clés
        4. 5.2.7.4 Analyse SWOT
        5. 5.2.7.5 Stratégies clés
      8. 5.2.8 Barco (BE)
        1. 5.2.8.1 Vue d'ensemble financière
        2. 5.2.8.2 Produits offerts
        3. 5.2.8.3 Développements clés
        4. 5.2.8.4 Analyse SWOT
        5. 5.2.8.5 Stratégies clés
      9. 5.2.9 BrightSign (US)
        1. 5.2.9.1 Vue d'ensemble financière
        2. 5.2.9.2 Produits offerts
        3. 5.2.9.3 Développements clés
        4. 5.2.9.4 Analyse SWOT
        5. 5.2.9.5 Stratégies clés
      10. 5.2.10 ViewSonic (US)
        1. 5.2.10.1 Vue d'ensemble financière
        2. 5.2.10.2 Produits offerts
        3. 5.2.10.3 Développements clés
        4. 5.2.10.4 Analyse SWOT
        5. 5.2.10.5 Stratégies clés
    3. 5.3 Annexe
      1. 5.3.1 Références
      2. 5.3.2 Rapports connexes
  6. 6 LISTE DES FIGURES
    1. 6.1 SYNOPSIS DU MARCHÉ
    2. 6.2 ANALYSE DU MARCHÉ EN AMÉRIQUE DU NORD
    3. 6.3 ANALYSE DU MARCHÉ AUX ÉTATS-UNIS PAR TYPE DE COMPOSANT
    4. 6.4 ANALYSE DU MARCHÉ AUX ÉTATS-UNIS PAR VERTICAL
    5. 6.5 ANALYSE DU MARCHÉ AU CANADA PAR TYPE DE COMPOSANT
    6. 6.6 ANALYSE DU MARCHÉ AU CANADA PAR VERTICAL
    7. 6.7 ANALYSE DU MARCHÉ EN EUROPE
    8. 6.8 ANALYSE DU MARCHÉ EN ALLEMAGNE PAR TYPE DE COMPOSANT
    9. 6.9 ANALYSE DU MARCHÉ EN ALLEMAGNE PAR VERTICAL
    10. 6.10 ANALYSE DU MARCHÉ AU ROYAUME-UNI PAR TYPE DE COMPOSANT
    11. 6.11 ANALYSE DU MARCHÉ AU ROYAUME-UNI PAR VERTICAL
    12. 6.12 ANALYSE DU MARCHÉ EN FRANCE PAR TYPE DE COMPOSANT
    13. 6.13 ANALYSE DU MARCHÉ EN FRANCE PAR VERTICAL
    14. 6.14 ANALYSE DU MARCHÉ EN RUSSIE PAR TYPE DE COMPOSANT
    15. 6.15 ANALYSE DU MARCHÉ EN RUSSIE PAR VERTICAL
    16. 6.16 ANALYSE DU MARCHÉ EN ITALIE PAR TYPE DE COMPOSANT
    17. 6.17 ANALYSE DU MARCHÉ EN ITALIE PAR VERTICAL
    18. 6.18 ANALYSE DU MARCHÉ EN ESPAGNE PAR TYPE DE COMPOSANT
    19. 6.19 ANALYSE DU MARCHÉ EN ESPAGNE PAR VERTICAL
    20. 6.20 ANALYSE DU MARCHÉ DANS LE RESTE DE L'EUROPE PAR TYPE DE COMPOSANT
    21. 6.21 ANALYSE DU MARCHÉ DANS LE RESTE DE L'EUROPE PAR VERTICAL
    22. 6.22 ANALYSE DU MARCHÉ EN APAC
    23. 6.23 ANALYSE DU MARCHÉ EN CHINE PAR TYPE DE COMPOSANT
    24. 6.24 ANALYSE DU MARCHÉ EN CHINE PAR VERTICAL
    25. 6.25 ANALYSE DU MARCHÉ EN INDE PAR TYPE DE COMPOSANT
    26. 6.26 ANALYSE DU MARCHÉ EN INDE PAR VERTICAL
    27. 6.27 ANALYSE DU MARCHÉ AU JAPON PAR TYPE DE COMPOSANT
    28. 6.28 ANALYSE DU MARCHÉ AU JAPON PAR VERTICAL
    29. 6.29 ANALYSE DU MARCHÉ EN CORÉE DU SUD PAR TYPE DE COMPOSANT
    30. 6.30 ANALYSE DU MARCHÉ EN CORÉE DU SUD PAR VERTICAL
    31. 6.31 ANALYSE DU MARCHÉ EN MALAYSIE PAR TYPE DE COMPOSANT
    32. 6.32 ANALYSE DU MARCHÉ EN MALAYSIE PAR VERTICAL
    33. 6.33 ANALYSE DU MARCHÉ EN THAÏLANDE PAR TYPE DE COMPOSANT
    34. 6.34 ANALYSE DU MARCHÉ EN THAÏLANDE PAR VERTICAL
    35. 6.35 ANALYSE DU MARCHÉ EN INDONÉSIE PAR TYPE DE COMPOSANT
    36. 6.36 ANALYSE DU MARCHÉ EN INDONÉSIE PAR VERTICAL
    37. 6.37 ANALYSE DU MARCHÉ DANS LE RESTE DE L'APAC PAR TYPE DE COMPOSANT
    38. 6.38 ANALYSE DU MARCHÉ DANS LE RESTE DE L'APAC PAR VERTICAL
    39. 6.39 ANALYSE DU MARCHÉ EN AMÉRIQUE DU SUD
    40. 6.40 ANALYSE DU MARCHÉ AU BRÉSIL PAR TYPE DE COMPOSANT
    41. 6.41 ANALYSE DU MARCHÉ AU BRÉSIL PAR VERTICAL
    42. 6.42 ANALYSE DU MARCHÉ AU MEXIQUE PAR TYPE DE COMPOSANT
    43. 6.43 ANALYSE DU MARCHÉ AU MEXIQUE PAR VERTICAL
    44. 6.44 ANALYSE DU MARCHÉ EN ARGENTINE PAR TYPE DE COMPOSANT
    45. 6.45 ANALYSE DU MARCHÉ EN ARGENTINE PAR VERTICAL
    46. 6.46 ANALYSE DU MARCHÉ DANS LE RESTE DE L'AMÉRIQUE DU SUD PAR TYPE DE COMPOSANT
    47. 6.47 ANALYSE DU MARCHÉ DANS LE RESTE DE L'AMÉRIQUE DU SUD PAR VERTICAL
    48. 6.48 ANALYSE DU MARCHÉ EN MEA
    49. 6.49 ANALYSE DU MARCHÉ DANS LES PAYS DU CCG PAR TYPE DE COMPOSANT
    50. 6.50 ANALYSE DU MARCHÉ DANS LES PAYS DU CCG PAR VERTICAL
    51. 6.51 ANALYSE DU MARCHÉ EN AFRIQUE DU SUD PAR TYPE DE COMPOSANT
    52. 6.52 ANALYSE DU MARCHÉ EN AFRIQUE DU SUD PAR VERTICAL
    53. 6.53 ANALYSE DU MARCHÉ DANS LE RESTE DE LA MEA PAR TYPE DE COMPOSANT
    54. 6.54 ANALYSE DU MARCHÉ DANS LE RESTE DE LA MEA PAR VERTICAL
    55. 6.55 CRITÈRES D'ACHAT CLÉS DES SEMI-CONDUCTEURS ET DE L'ÉLECTRONIQUE
    56. 6.56 PROCESSUS DE RECHERCHE DE MRFR
    57. 6.57 ANALYSE DRO DES SEMI-CONDUCTEURS ET DE L'ÉLECTRONIQUE
    58. 6.58 ANALYSE D'IMPACT DES FACTEURS MOTRICES : SEMI-CONDUCTEURS ET ÉLECTRONIQUE
    59. 6.59 ANALYSE D'IMPACT DES CONTRAINTES : SEMI-CONDUCTEURS ET ÉLECTRONIQUE
    60. 6.60 CHAÎNE D'APPROVISIONNEMENT / CHAÎNE DE VALEUR : SEMI-CONDUCTEURS ET ÉLECTRONIQUE
    61. 6.61 SEMI-CONDUCTEURS ET ÉLECTRONIQUE, PAR TYPE DE COMPOSANT, 2024 (% PART)
    62. 6.62 SEMI-CONDUCTEURS ET ÉLECTRONIQUE, PAR TYPE DE COMPOSANT, 2024 À 2035 (milliards USD)
    63. 6.63 SEMI-CONDUCTEURS ET ÉLECTRONIQUE, PAR VERTICAL, 2024 (% PART)
    64. 6.64 SEMI-CONDUCTEURS ET ÉLECTRONIQUE, PAR VERTICAL, 2024 À 2035 (milliards USD)
    65. 6.65 ÉVALUATION COMPARATIVE DES PRINCIPAUX CONCURRENTS
  7. 7 LISTE DES TABLEAUX
    1. 7.1 LISTE DES HYPOTHÈSES
  8. 7.1.1
    1. 7.2 ESTIMATIONS DE TAILLE DU MARCHÉ EN AMÉRIQUE DU NORD ; PRÉVISIONS
      1. 7.2.1 PAR TYPE DE COMPOSANT, 2025-2035 (milliards USD)
      2. 7.2.2 PAR VERTICAL, 2025-2035 (milliards USD)
    2. 7.3 ESTIMATIONS DE TAILLE DU MARCHÉ AUX ÉTATS-UNIS ; PRÉVISIONS
      1. 7.3.1 PAR TYPE DE COMPOSANT, 2025-2035 (milliards USD)
      2. 7.3.2 PAR VERTICAL, 2025-2035 (milliards USD)
    3. 7.4 ESTIMATIONS DE TAILLE DU MARCHÉ AU CANADA ; PRÉVISIONS
      1. 7.4.1 PAR TYPE DE COMPOSANT, 2025-2035 (milliards USD)
      2. 7.4.2 PAR VERTICAL, 2025-2035 (milliards USD)
    4. 7.5 ESTIMATIONS DE TAILLE DU MARCHÉ EN EUROPE ; PRÉVISIONS
      1. 7.5.1 PAR TYPE DE COMPOSANT, 2025-2035 (milliards USD)
      2. 7.5.2 PAR VERTICAL, 2025-2035 (milliards USD)
    5. 7.6 ESTIMATIONS DE TAILLE DU MARCHÉ EN ALLEMAGNE ; PRÉVISIONS
      1. 7.6.1 PAR TYPE DE COMPOSANT, 2025-2035 (milliards USD)
      2. 7.6.2 PAR VERTICAL, 2025-2035 (milliards USD)
    6. 7.7 ESTIMATIONS DE TAILLE DU MARCHÉ AU ROYAUME-UNI ; PRÉVISIONS
      1. 7.7.1 PAR TYPE DE COMPOSANT, 2025-2035 (milliards USD)
      2. 7.7.2 PAR VERTICAL, 2025-2035 (milliards USD)
    7. 7.8 ESTIMATIONS DE TAILLE DU MARCHÉ EN FRANCE ; PRÉVISIONS
      1. 7.8.1 PAR TYPE DE COMPOSANT, 2025-2035 (milliards USD)
      2. 7.8.2 PAR VERTICAL, 2025-2035 (milliards USD)
    8. 7.9 ESTIMATIONS DE TAILLE DU MARCHÉ EN RUSSIE ; PRÉVISIONS
      1. 7.9.1 PAR TYPE DE COMPOSANT, 2025-2035 (milliards USD)
      2. 7.9.2 PAR VERTICAL, 2025-2035 (milliards USD)
    9. 7.10 ESTIMATIONS DE TAILLE DU MARCHÉ EN ITALIE ; PRÉVISIONS
      1. 7.10.1 PAR TYPE DE COMPOSANT, 2025-2035 (milliards USD)
      2. 7.10.2 PAR VERTICAL, 2025-2035 (milliards USD)
    10. 7.11 ESTIMATIONS DE TAILLE DU MARCHÉ EN ESPAGNE ; PRÉVISIONS
      1. 7.11.1 PAR TYPE DE COMPOSANT, 2025-2035 (milliards USD)
      2. 7.11.2 PAR VERTICAL, 2025-2035 (milliards USD)
    11. 7.12 ESTIMATIONS DE TAILLE DU MARCHÉ DANS LE RESTE DE L'EUROPE ; PRÉVISIONS
      1. 7.12.1 PAR TYPE DE COMPOSANT, 2025-2035 (milliards USD)
      2. 7.12.2 PAR VERTICAL, 2025-2035 (milliards USD)
    12. 7.13 ESTIMATIONS DE TAILLE DU MARCHÉ EN APAC ; PRÉVISIONS
      1. 7.13.1 PAR TYPE DE COMPOSANT, 2025-2035 (milliards USD)
      2. 7.13.2 PAR VERTICAL, 2025-2035 (milliards USD)
    13. 7.14 ESTIMATIONS DE TAILLE DU MARCHÉ EN CHINE ; PRÉVISIONS
      1. 7.14.1 PAR TYPE DE COMPOSANT, 2025-2035 (milliards USD)
      2. 7.14.2 PAR VERTICAL, 2025-2035 (milliards USD)
    14. 7.15 ESTIMATIONS DE TAILLE DU MARCHÉ EN INDE ; PRÉVISIONS
      1. 7.15.1 PAR TYPE DE COMPOSANT, 2025-2035 (milliards USD)
      2. 7.15.2 PAR VERTICAL, 2025-2035 (milliards USD)
    15. 7.16 ESTIMATIONS DE TAILLE DU MARCHÉ AU JAPON ; PRÉVISIONS
      1. 7.16.1 PAR TYPE DE COMPOSANT, 2025-2035 (milliards USD)
      2. 7.16.2 PAR VERTICAL, 2025-2035 (milliards USD)
    16. 7.17 ESTIMATIONS DE TAILLE DU MARCHÉ EN CORÉE DU SUD ; PRÉVISIONS
      1. 7.17.1 PAR TYPE DE COMPOSANT, 2025-2035 (milliards USD)
      2. 7.17.2 PAR VERTICAL, 2025-2035 (milliards USD)
    17. 7.18 ESTIMATIONS DE TAILLE DU MARCHÉ EN MALAYSIE ; PRÉVISIONS
      1. 7.18.1 PAR TYPE DE COMPOSANT, 2025-2035 (milliards USD)
      2. 7.18.2 PAR VERTICAL, 2025-2035 (milliards USD)
    18. 7.19 ESTIMATIONS DE TAILLE DU MARCHÉ EN THAÏLANDE ; PRÉVISIONS
      1. 7.19.1 PAR TYPE DE COMPOSANT, 2025-2035 (milliards USD)
      2. 7.19.2 PAR VERTICAL, 2025-2035 (milliards USD)
    19. 7.20 ESTIMATIONS DE TAILLE DU MARCHÉ EN INDONÉSIE ; PRÉVISIONS
      1. 7.20.1 PAR TYPE DE COMPOSANT, 2025-2035 (milliards USD)
      2. 7.20.2 PAR VERTICAL, 2025-2035 (milliards USD)
    20. 7.21 ESTIMATIONS DE TAILLE DU MARCHÉ DANS LE RESTE DE L'APAC ; PRÉVISIONS
      1. 7.21.1 PAR TYPE DE COMPOSANT, 2025-2035 (milliards USD)
      2. 7.21.2 PAR VERTICAL, 2025-2035 (milliards USD)
    21. 7.22 ESTIMATIONS DE TAILLE DU MARCHÉ EN AMÉRIQUE DU SUD ; PRÉVISIONS
      1. 7.22.1 PAR TYPE DE COMPOSANT, 2025-2035 (milliards USD)
      2. 7.22.2 PAR VERTICAL, 2025-2035 (milliards USD)
    22. 7.23 ESTIMATIONS DE TAILLE DU MARCHÉ AU BRÉSIL ; PRÉVISIONS
      1. 7.23.1 PAR TYPE DE COMPOSANT, 2025-2035 (milliards USD)
      2. 7.23.2 PAR VERTICAL, 2025-2035 (milliards USD)
    23. 7.24 ESTIMATIONS DE TAILLE DU MARCHÉ AU MEXIQUE ; PRÉVISIONS
      1. 7.24.1 PAR TYPE DE COMPOSANT, 2025-2035 (milliards USD)
      2. 7.24.2 PAR VERTICAL, 2025-2035 (milliards USD)
    24. 7.25 ESTIMATIONS DE TAILLE DU MARCHÉ EN ARGENTINE ; PRÉVISIONS
      1. 7.25.1 PAR TYPE DE COMPOSANT, 2025-2035 (milliards USD)
      2. 7.25.2 PAR VERTICAL, 2025-2035 (milliards USD)
    25. 7.26 ESTIMATIONS DE TAILLE DU MARCHÉ DANS LE RESTE DE L'AMÉRIQUE DU SUD ; PRÉVISIONS
      1. 7.26.1 PAR TYPE DE COMPOSANT, 2025-2035 (milliards USD)
      2. 7.26.2 PAR VERTICAL, 2025-2035 (milliards USD)
    26. 7.27 ESTIMATIONS DE TAILLE DU MARCHÉ EN MEA ; PRÉVISIONS
      1. 7.27.1 PAR TYPE DE COMPOSANT, 2025-2035 (milliards USD)
      2. 7.27.2 PAR VERTICAL, 2025-2035 (milliards USD)
    27. 7.28 ESTIMATIONS DE TAILLE DU MARCHÉ DANS LES PAYS DU CCG ; PRÉVISIONS
      1. 7.28.1 PAR TYPE DE COMPOSANT, 2025-2035 (milliards USD)
      2. 7.28.2 PAR VERTICAL, 2025-2035 (milliards USD)
    28. 7.29 ESTIMATIONS DE TAILLE DU MARCHÉ EN AFRIQUE DU SUD ; PRÉVISIONS
      1. 7.29.1 PAR TYPE DE COMPOSANT, 2025-2035 (milliards USD)
      2. 7.29.2 PAR VERTICAL, 2025-2035 (milliards USD)
    29. 7.30 ESTIMATIONS DE TAILLE DU MARCHÉ DANS LE RESTE DE LA MEA ; PRÉVISIONS
      1. 7.30.1 PAR TYPE DE COMPOSANT, 2025-2035 (milliards USD)
      2. 7.30.2 PAR VERTICAL, 2025-2035 (milliards USD)
    30. 7.31 LANCEMENT DE PRODUIT / DÉVELOPPEMENT / APPROBATION
  9. 7.31.1
    1. 7.32 ACQUISITION / PARTENARIAT
  10. 7.32.1

Segmentation du marché de l'affichage numérique

Perspectives par type de composant du marché de l'affichage numérique (milliards USD, 2018-2032)
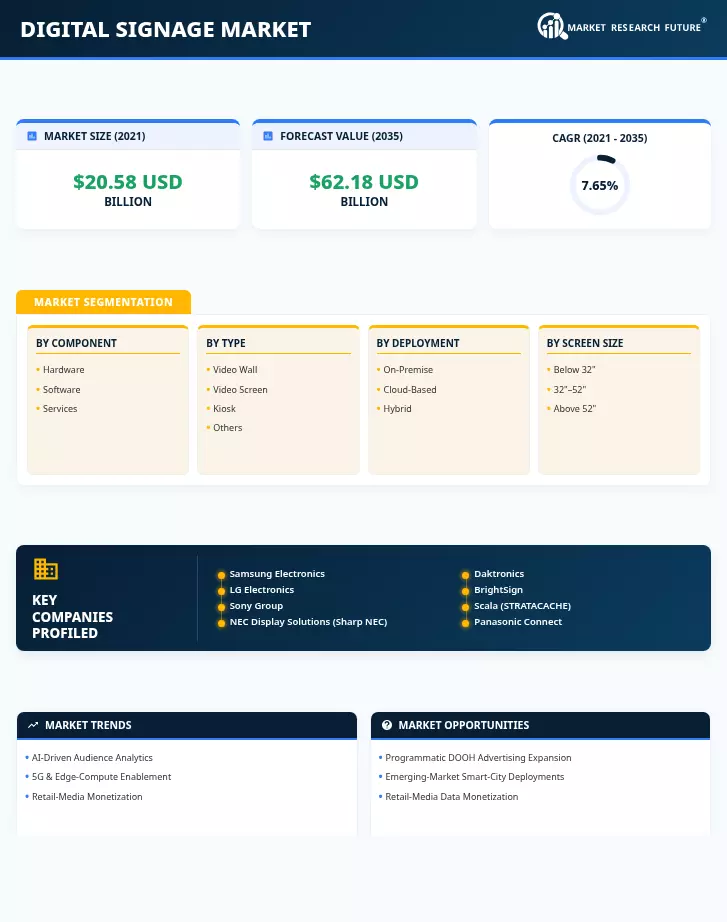
Matériel

Logiciel

Service

Perspectives par secteur du marché de l'affichage numérique (milliards USD, 2018-2032)

Commercial

Institutionnel

Infrastructure

Institutionnel

Perspectives régionales du marché de l'affichage numérique (milliards USD, 2018-2032)

Perspectives du marché de l'affichage numérique en Amérique du Nord (milliards USD, 2018-2032)

Affichage numérique en Amérique du Nord par type de composant

Matériel

Logiciel

Service

Affichage numérique en Amérique du Nord par secteur

Commercial

Institutionnel

Infrastructure

Institutionnel

Perspectives du marché de l'affichage numérique aux États-Unis (milliards USD, 2018-2032)

Affichage numérique aux États-Unis par type de composant

Matériel

Logiciel

Service

Affichage numérique aux États-Unis par secteur

Commercial

Institutionnel

Infrastructure

Institutionnel

Perspectives du marché de l'affichage numérique au Canada (milliards USD, 2018-2032)

Affichage numérique au Canada par type de composant

Matériel

Logiciel

Service

Affichage numérique au Canada par secteur

Commercial

Institutionnel

Infrastructure

Institutionnel

Perspectives du marché de l'affichage numérique en Europe (milliards USD, 2018-2032)

Affichage numérique en Europe par type de composant

Matériel

Logiciel

Service

Affichage numérique en Europe par secteur

Commercial

Institutionnel

Infrastructure

Institutionnel

Perspectives du marché de l'affichage numérique en Allemagne (milliards USD, 2018-2032)

Affichage numérique en Allemagne par type de composant

Matériel

Logiciel

Service

Affichage numérique en Allemagne par secteur

Commercial

Institutionnel

Infrastructure

Institutionnel

Perspectives du marché de l'affichage numérique en France (milliards USD, 2018-2032)

Affichage numérique en France par type de composant

Matériel

Logiciel

Service

Affichage numérique en France par secteur

Commercial

Institutionnel

Infrastructure

Institutionnel

Perspectives du marché de l'affichage numérique au Royaume-Uni (milliards USD, 2018-2032)

Affichage numérique au Royaume-Uni par type de composant

Matériel

Logiciel

Service

Affichage numérique au Royaume-Uni par secteur

Commercial

Institutionnel

Infrastructure

Institutionnel

Perspectives du marché de l'affichage numérique en Italie (milliards USD, 2018-2032)

Affichage numérique en Italie par type de composant

Matériel

Logiciel

Service

Affichage numérique en Italie par secteur

Commercial

Institutionnel

Infrastructure

Institutionnel

Perspectives du marché de l'affichage numérique en Espagne (milliards USD, 2018-2032)

Affichage numérique en Espagne par type de composant

Matériel

Logiciel

Service

Affichage numérique en Espagne par secteur

Commercial

Institutionnel

Infrastructure

Institutionnel

Perspectives du marché de l'affichage numérique dans le reste de l'Europe (milliards USD, 2018-2032)

Affichage numérique dans le reste de l'Europe par type de composant

Matériel

Logiciel

Service

Affichage numérique dans le reste de l'Europe par secteur

Commercial

Institutionnel

Infrastructure

Institutionnel

Perspectives du marché de l'affichage numérique en Asie-Pacifique (milliards USD, 2018-2032)

Affichage numérique en Asie-Pacifique par type de composant

Matériel

Logiciel

Service

Affichage numérique en Asie-Pacifique par secteur

Commercial

Institutionnel

Infrastructure

Institutionnel

Perspectives du marché de l'affichage numérique en Chine (milliards USD, 2018-2032)

Affichage numérique en Chine par type de composant

Matériel

Logiciel

Service

Affichage numérique en Chine par secteur

Commercial

Institutionnel

Infrastructure

Institutionnel

Perspectives du marché de l'affichage numérique au Japon (milliards USD, 2018-2032)

Affichage numérique au Japon par type de composant

Matériel

Logiciel

Service

Affichage numérique au Japon par secteur

Commercial

Institutionnel

Infrastructure

Institutionnel

Perspectives du marché de l'affichage numérique en Inde (milliards USD, 2018-2032)

Affichage numérique en Inde par type de composant

Matériel

Logiciel

Service

Affichage numérique en Inde par secteur

Commercial

Institutionnel

Infrastructure

Institutionnel

Perspectives du marché de l'affichage numérique en Australie (milliards USD, 2018-2032)

Affichage numérique en Australie par type de composant

Matériel

Logiciel

Service

Affichage numérique en Australie par secteur

Commercial

Institutionnel

Infrastructure

Institutionnel

Perspectives du marché de l'affichage numérique dans le reste de l'Asie-Pacifique (milliards USD, 2018-2032)

Affichage numérique dans le reste de l'Asie-Pacifique par type de composant

Matériel

Logiciel

Service

Affichage numérique dans le reste de l'Asie-Pacifique par secteur

Commercial

Institutionnel

Infrastructure

Institutionnel

Perspectives du marché de l'affichage numérique dans le reste du monde (milliards USD, 2018-2032)

Affichage numérique dans le reste du monde par type de composant

Matériel

Logiciel

Service

Affichage numérique dans le reste du monde par secteur

Commercial

Institutionnel

Infrastructure

Institutionnel

Perspectives du marché de l'affichage numérique au Moyen-Orient (milliards USD, 2018-2032)

Affichage numérique au Moyen-Orient par type de composant

Matériel

Logiciel

Service

Affichage numérique au Moyen-Orient par secteur

Commercial

Institutionnel

Infrastructure

Institutionnel

Perspectives du marché de l'affichage numérique en Afrique (milliards USD, 2018-2032)

Affichage numérique en Afrique par type de composant

Matériel

Logiciel

Service

Affichage numérique en Afrique par secteur

Commercial

Institutionnel

Infrastructure

Institutionnel

Perspectives du marché de l'affichage numérique en Amérique latine (milliards USD, 2018-2032)

Affichage numérique en Amérique latine par type de composant

Matériel

Logiciel

Service

Affichage numérique en Amérique latine par secteur

Commercial

Institutionnel

Infrastructure

Institutionnel