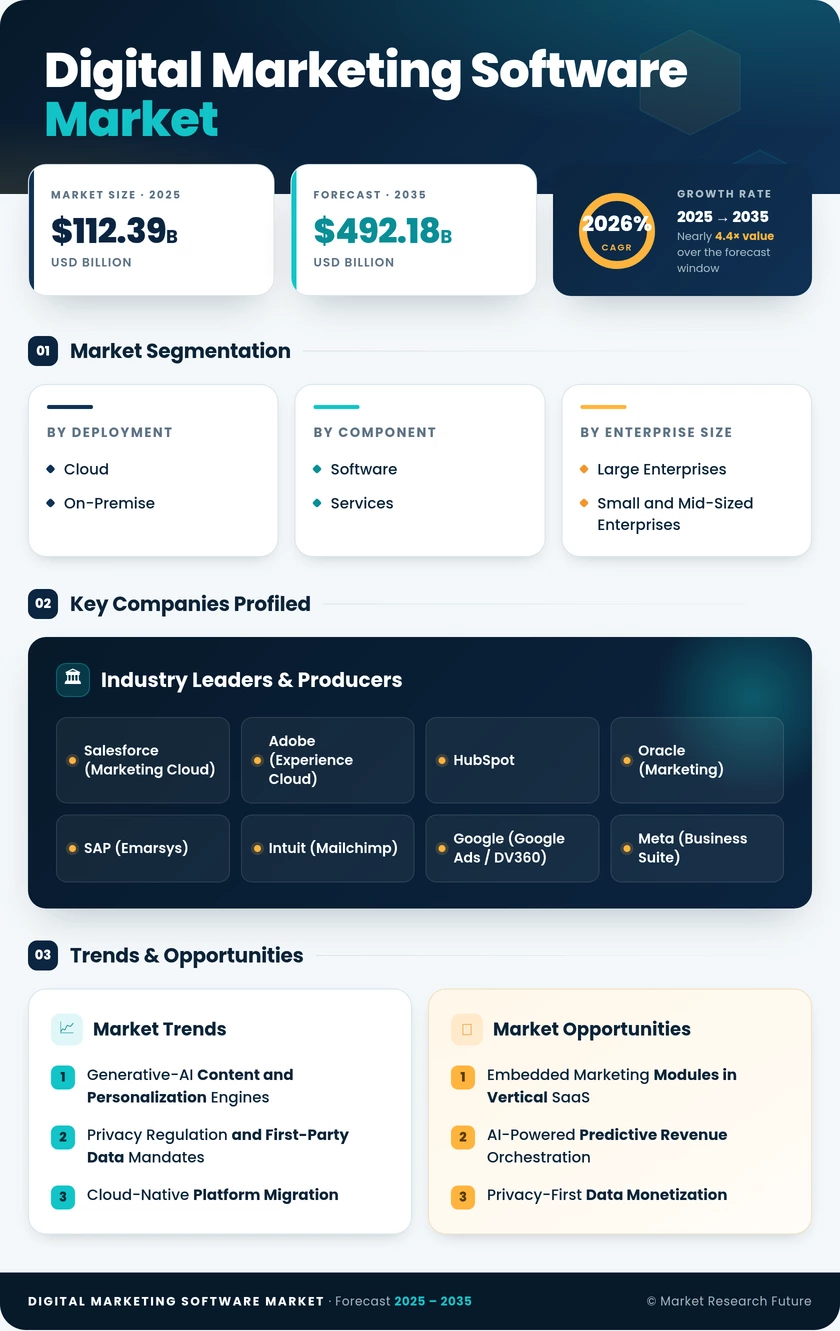
Digital Marketing Software Market
Market Size
Key Players
- Generative-AI Content and Personalization Engines
- Privacy Regulation and First-Party Data Mandates
- Cloud-Native Platform Migration
- Embedded Marketing Modules in Vertical SaaS
- AI-Powered Predictive Revenue Orchestration
- Privacy-First Data Monetization
- 1 Résumé
-
2 Présentation du marché
- 2.1 Définition 12
- 2.2 Portée de l'étude 12
- 2.3 Liste des hypothèses 13
- 2.4 Structure du marché 13
- 3 Aperçu du marché
-
4 Méthodologie de recherche
- 4.1 Processus de recherche 17
- 4.2 Modèle de prévision 21
-
5 Dynamique du marché
- 5.1 Introduction 23
-
5.2 Facteurs moteurs 23
- 5.2.1 Adoption croissante des plateformes de médias sociaux pour la publicité 23
- 5.2.2 Essor de la publicité mobile via les appareils mobiles 25
- 5.2.3 Analyse de l'impact des facteurs moteurs 26
-
5.3 Opportunité 26
- 5.3.1 Intégration de l'intelligence artificielle (IA) et de l'analyse du Big Data dans le marketing numérique 26
-
5.4 Contraintes 26
- 5.4.1 Préoccupations en matière de sécurité et de confidentialité des données 26
-
6 Analyse des facteurs de marché
- 6.1 Analyse de la chaîne de valeur 28
-
6.2 Modèle des cinq forces de Porter 28
- 6.2.1 Menace des nouveaux entrants 29
- 6.2.2 Pouvoir de négociation des fournisseurs 29
- 6.2.3 Pouvoir de négociation des acheteurs 30
- 6.2.4 Menace des substituts 30
- 6.2.5 Intensité de la rivalité 30
- 7 Marché mondial des logiciels de marketing numérique, par type
- 7.1.1 Aperçu 32
- 7.1.2 Interaction Systèmes 32
- 7.1.3 Système de données et d'analyse 32
- 7.1.4 Production et gestion de contenu 32
- 7.1.5 Applications orientées gestion et administration 32
-
8 Marché mondial des logiciels de marketing numérique, par application
-
8.1 Aperçu 36
- 8.1.1 Vente au détail 36
- 8.1.2 Médias et divertissement 36
- 8.1.3 Fabrication 36
- 8.1.4 Haute technologie et IT 36
- 8.1.5 BFSI 37
- 8.1.6 Autres 37
-
8.1 Aperçu 36
-
9 Marché mondial des logiciels de marketing numérique, par région
- 9.1 États-Unis 41
- 9.2 Europe 45
- 9.3 Chine 49
- 9.4 Japon 52
- 9.5 Inde 56
- 9.6 Asie du Sud-Est 59
-
10 Paysage concurrentiel
- 10.1 Paysage concurrentiel 64
-
11 Profils d'entreprise
-
11.1 Oracle Corporation 67
- 11.1.1 Présentation de l'entreprise 67
- 11.1.2 Aperçu financier 67
- 11.1.3 Produits/services/solutions proposés 68
- 11.1.4 Légende Développements 68
- 11.1.5 Analyse SWOT 68
- 11.1.6 Stratégies clés 69
-
11.2 IBM Corporation 70
- 11.2.1 Présentation de l'entreprise 70
- 11.2.2 Aperçu financier 71
- 11.2.3 Produits/Services/Solutions proposés 71
- 11.2.4 Développements clés 72
- 11.2.5 Analyse SWOT 72
- 11.2.6 Stratégie clé 72
-
11.3 SAP SE 73
- 11.3.1 Présentation de l'entreprise 73
- 11.3.2 Aperçu financier 74
- 11.3.3 Produits/Services/Solutions proposés 74
- 11.3.4 Développements clés 74
- 11.3.5 Analyse SWOT 75
- 11.3.6 Stratégies clés 75
-
11.4 Microsoft Corporation 76
- 11.4.1 Présentation de l'entreprise 76
- 11.4.2 Aperçu financier 76
- 11.4.3 Produits/Services/Solutions proposés 77
- 11.4.4 Principaux développements 77
- 11.4.5 Analyse SWOT 77
- 11.4.6 Stratégies clés 77
-
11.5 SAS Institute Inc 78
- 11.5.1 Présentation de l'entreprise 78
- 11.5.2 Aperçu financier 78
- 11.5.3 Produits/Services/Solutions proposés 79
- 11.5.4 Principaux développements 79
- 11.5.5 Analyse SWOT 79
- 11.5.6 Stratégie clé 80
-
11.6 Adobe Systems 81
- 11.6.1 Présentation de l'entreprise 81
- 11.6.2 Aperçu financier 81
- 11.6.3 Produits/Services/Solutions proposés 82
- 11.6.4 Principaux développements 82
- 11.6.5 Analyse SWOT 82
- 11.6.6 Stratégie clé 83
-
11.7 HP Enterprise Development L.P 84
- 11.7.1 Présentation de l'entreprise 84
- 11.7.2 Aperçu financier 84
- 11.7.3 Produits/Services/Solutions proposés 85
- 11.7.4 Principaux développements 85
- 11.7.5 Analyse SWOT 86
- 11.7.6 Stratégie clé 86
-
11.8 Hubspot Inc 87
- 11.8.1 Présentation de l'entreprise 87
- 11.8.2 Aperçu financier 87
- 11.8.3 Produits/Services/Solutions proposés 88
- 11.8.4 Principaux développements 88
- 11.8.5 Analyse SWOT 89
- 11.8.6 Stratégie clé 89
- ?
-
11.1 Oracle Corporation 67
-
12 Liste des tableaux
- TABLEAU 1 SYNOPSIS DU MARCHÉ 10
- TABLEAU 2 LISTE DES HYPOTHÈSES 13
- TABLEAU 3 MARCHÉ MONDIAL DES LOGICIELS DE MARKETING NUMÉRIQUE, PAR TYPE, 2020-2027 (MILLIONS USD) 33
- TABLEAU 4 MARCHÉ MONDIAL DES LOGICIELS DE MARKETING NUMÉRIQUE, PAR TYPE, 2020-2027 (MILLIONS USD) 34
- TABLEAU 5 MARCHÉ MONDIAL DES LOGICIELS DE MARKETING NUMÉRIQUE, PAR APPLICATION, 2020-2027 (MILLIONS USD) 38
- TABLEAU 6 MARCHÉ MONDIAL DES LOGICIELS DE MARKETING NUMÉRIQUE, PAR APPLICATION, 2020-2027 (MILLIONS USD) 39
- TABLEAU 7 MARCHÉ AMÉRICAIN DES LOGICIELS DE MARKETING NUMÉRIQUE, PAR TYPE, 2020-2027 (MILLIONS USD) 41
- TABLEAU 8 MARCHÉ AMÉRICAIN DES LOGICIELS DE MARKETING NUMÉRIQUE, PAR TYPE, 2020-2027 (MILLIONS USD) 42
- TABLEAU 9 MARCHÉ DES LOGICIELS DE MARKETING NUMÉRIQUE AUX ÉTATS-UNIS, PAR APPLICATION, 2020-2027 (EN MILLIONS USD) 43
- TABLEAU 10 MARCHÉ DES LOGICIELS DE MARKETING NUMÉRIQUE AUX ÉTATS-UNIS, PAR APPLICATION, 2020-2027 (EN MILLIONS USD) 44
- TABLEAU 11 MARCHÉ DES LOGICIELS DE MARKETING NUMÉRIQUE EN EUROPE, PAR TYPE, 2020-2027 (EN MILLIONS USD) 45
- TABLEAU 12 MARCHÉ DES LOGICIELS DE MARKETING NUMÉRIQUE EN EUROPE, PAR TYPE, 2020-2027 (EN MILLIONS USD) 46
- TABLEAU 13 MARCHÉ DES LOGICIELS DE MARKETING NUMÉRIQUE EN EUROPE, PAR APPLICATION, 2020-2027 (EN MILLIONS USD) 47
- TABLEAU 14 MARKETING NUMÉRIQUE EN EUROPE MARCHÉ DES LOGICIELS, PAR APPLICATION, 2020 À 2027 (EN MILLIONS USD) 48
- TABLEAU 15 MARCHÉ DES LOGICIELS DE MARKETING NUMÉRIQUE EN CHINE, PAR TYPE, 2020-2027 (EN MILLIONS USD) 49
- TABLEAU 16 MARCHÉ DES LOGICIELS DE MARKETING NUMÉRIQUE EN CHINE, PAR TYPE, 2020-2027 (EN MILLIONS USD) 50
- TABLEAU 17 MARCHÉ DES LOGICIELS DE MARKETING NUMÉRIQUE EN CHINE, PAR APPLICATION, 2020-2027 (EN MILLIONS USD) 51
- TABLEAU 18 MARCHÉ DES LOGICIELS DE MARKETING NUMÉRIQUE EN CHINE, PAR APPLICATION, 2020-2027 (EN MILLIONS USD) 51
- TABLEAU 19 MARCHÉ DES LOGICIELS DE MARKETING NUMÉRIQUE AU JAPON, PAR TYPE, 2020-2027 (MILLIONS USD) 52
- TABLEAU 20 MARCHÉ JAPONAIS DES LOGICIELS DE MARKETING NUMÉRIQUE, PAR TYPE, 2020-2027 (MILLIONS USD) 53
- TABLEAU 21 MARCHÉ JAPONAIS DES LOGICIELS DE MARKETING NUMÉRIQUE, PAR APPLICATION, 2020-2027 (MILLIONS USD) 54
- TABLEAU 22 MARCHÉ JAPONAIS DES LOGICIELS DE MARKETING NUMÉRIQUE, PAR APPLICATION, 2020-2027 (MILLIONS USD) 55
- TABLEAU 23 MARCHÉ INDIEN DES LOGICIELS DE MARKETING NUMÉRIQUE, PAR TYPE, 2020-2027 (MILLIONS USD) 56
- TABLEAU 24 MARCHÉ INDIEN DES LOGICIELS DE MARKETING NUMÉRIQUE, PAR TYPE, 2020-2027 (USD) MILLIONS) 57
- TABLEAU 25 MARCHÉ INDIEN DES LOGICIELS DE MARKETING NUMÉRIQUE, PAR APPLICATION, 2020-2027 (MILLIONS USD) 58
- TABLEAU 26 MARCHÉ INDIEN DES LOGICIELS DE MARKETING NUMÉRIQUE, PAR APPLICATION, 2020-2027 (MILLIONS USD) 58
- TABLEAU 27 MARCHÉ DES LOGICIELS DE MARKETING NUMÉRIQUE EN ASIE DU SUD-EST, PAR TYPE, 2020-2027 (MILLIONS USD) 59
- TABLEAU 28 MARCHÉ DES LOGICIELS DE MARKETING NUMÉRIQUE EN ASIE DU SUD-EST, PAR TYPE, 2020-2027 (MILLIONS USD) 60
- TABLEAU 29 MARCHÉ DES LOGICIELS DE MARKETING NUMÉRIQUE EN ASIE DU SUD-EST, PAR APPLICATION, 2020-2027 (EN MILLIONS USD) 61
- TABLEAU 30 MARCHÉ DES LOGICIELS DE MARKETING NUMÉRIQUE EN ASIE DU SUD-EST, PAR APPLICATION, 2020-2027 (EN MILLIONS USD) 62
- ?
- 13 Liste des figures
- FIGURE 1 MARCHÉ MONDIAL DES LOGICIELS DE MARKETING NUMÉRIQUE : STRUCTURE DU MARCHÉ 13
- FIGURE 2 TAILLE DU MARCHÉ MONDIAL ET PART DE MARCHÉ PAR RÉGION/PAYS (2020 VS 2027) 15
- FIGURE 3 DEBOUT ET APPROCHE ASCENDANTE 20
- FIGURE 4 ANALYSE DRO DU MARCHÉ MONDIAL DES LOGICIELS DE MARKETING NUMÉRIQUE 23
- FIGURE 5 VALEUR COMMERCIALE DES PLATEFORMES DE MÉDIAS SOCIAUX 24
- FIGURE 6 TAUX DE CONVERSION MOYEN PAR CANAL PUBLICITAIRE 24
- FIGURE 7 ADOPTION DES SMARTPHONES 25
- FIGURE 8 ANALYSE DE L'IMPACT DES FACTEURS : MARCHÉ DES LOGICIELS DE MARKETING NUMÉRIQUE 26
- FIGURE 9 CHAÎNE DE VALEUR : MARCHÉ MONDIAL DES LOGICIELS DE MARKETING NUMÉRIQUE 28
- FIGURE 10 ANALYSE DES CINQ FORCES DE PORTER DU MARCHÉ MONDIAL DES LOGICIELS DE MARKETING NUMÉRIQUE 29
- FIGURE 11 MARCHÉ MONDIAL DES LOGICIELS DE MARKETING NUMÉRIQUE, PAR TYPE, 2020 À 2027 (EN MILLIONS USD) 33
- FIGURE 12 MARCHÉ MONDIAL DES LOGICIELS DE MARKETING NUMÉRIQUE, PAR TYPE, 2020 À 2027 (EN MILLIONS USD) 34
- FIGURE 13 MARCHÉ MONDIAL DES LOGICIELS DE MARKETING NUMÉRIQUE, PAR APPLICATION, 2020 À 2027 (EN MILLIONS USD) 38
- FIGURE 14 MARCHÉ MONDIAL DES LOGICIELS DE MARKETING NUMÉRIQUE, PAR APPLICATION, 2020 À 2027 (EN MILLIONS USD) 39
- FIGURE 15 MARCHÉ AMÉRICAIN DES LOGICIELS DE MARKETING NUMÉRIQUE, PAR TYPE, 2020 À 2027 (EN MILLIONS USD) 41
- FIGURE 16 MARCHÉ DES LOGICIELS DE MARKETING NUMÉRIQUE AUX ÉTATS-UNIS, PAR TYPE, 2020 À 2027 (EN MILLIONS USD) 42
- FIGURE 17 MARCHÉ DES LOGICIELS DE MARKETING NUMÉRIQUE AUX ÉTATS-UNIS, PAR APPLICATION, 2020 À 2027 (EN MILLIONS USD) 43
- FIGURE 18 MARCHÉ DES LOGICIELS DE MARKETING NUMÉRIQUE AUX ÉTATS-UNIS, PAR APPLICATION, 2020 À 2027 (EN MILLIONS USD) 44
- FIGURE 19 MARCHÉ DES LOGICIELS DE MARKETING NUMÉRIQUE EN EUROPE, PAR TYPE, 2020 À 2027 (EN MILLIONS USD) 45
- FIGURE 20 MARCHÉ DES LOGICIELS DE MARKETING NUMÉRIQUE EN EUROPE, PAR TYPE, 2020 À 2027 (EN MILLIONS USD) 46
- FIGURE 21 MARCHÉ EUROPÉEN DES LOGICIELS DE MARKETING NUMÉRIQUE, PAR APPLICATION, 2020 À 2027 (EN MILLIONS USD) 47
- FIGURE 22 MARCHÉ EUROPÉEN DES LOGICIELS DE MARKETING NUMÉRIQUE, PAR APPLICATION, 2020 À 2027 (EN MILLIONS USD) 48
- FIGURE 23 MARCHÉ CHINOIS DES LOGICIELS DE MARKETING NUMÉRIQUE, PAR TYPE, 2020 À 2027 (EN MILLIONS USD) 49
- FIGURE 24 MARCHÉ CHINOIS DES LOGICIELS DE MARKETING NUMÉRIQUE, PAR TYPE, 2020 À 2027 (EN MILLIONS USD) 49
- FIGURE 25 MARCHÉ CHINOIS DES LOGICIELS DE MARKETING NUMÉRIQUE, PAR APPLICATION, 2020 À 2027 (EN MILLIONS USD) 50
- FIGURE 26 MARCHÉ DES LOGICIELS DE MARKETING NUMÉRIQUE EN CHINE, PAR APPLICATION, 2020 À 2027 (EN MILLIONS USD) 51
- FIGURE 27 MARCHÉ DES LOGICIELS DE MARKETING NUMÉRIQUE AU JAPON, PAR TYPE, 2020 À 2027 (EN MILLIONS USD) 52
- FIGURE 28 MARCHÉ DES LOGICIELS DE MARKETING NUMÉRIQUE AU JAPON, PAR TYPE, 2020 À 2027 (EN MILLIONS USD) 53
- FIGURE 29 MARCHÉ DES LOGICIELS DE MARKETING NUMÉRIQUE AU JAPON, PAR APPLICATION, 2020 À 2027 (EN MILLIONS USD) 54
- FIGURE 30 MARCHÉ DES LOGICIELS DE MARKETING NUMÉRIQUE AU JAPON, PAR APPLICATION, 2020 À 2027 (EN MILLIONS USD) MILLIONS) 55
- FIGURE 31 MARCHÉ INDIEN DES LOGICIELS DE MARKETING NUMÉRIQUE, PAR TYPE, 2020 À 2027 (MILLIONS USD) 56
- FIGURE 32 MARCHÉ INDIEN DES LOGICIELS DE MARKETING NUMÉRIQUE, PAR TYPE, 2020 À 2027 (MILLIONS USD) 56
- FIGURE 33 MARCHÉ INDIEN DES LOGICIELS DE MARKETING NUMÉRIQUE, PAR APPLICATION, 2020 À 2027 (MILLIONS USD) 57
- FIGURE 34 MARCHÉ INDIEN DES LOGICIELS DE MARKETING NUMÉRIQUE, PAR APPLICATION, 2020 À 2027 (MILLIONS USD) 58
- FIGURE 35 MARCHÉ DES LOGICIELS DE MARKETING NUMÉRIQUE EN ASIE DU SUD-EST, PAR TYPE, 2020 À 2027 (MILLIONS USD) 59
- FIGURE 36 MARCHÉ DES LOGICIELS DE MARKETING NUMÉRIQUE EN ASIE DU SUD-EST, PAR TYPE, 2020 À 2027 (MILLIONS USD) 60
- FIGURE 37 MARCHÉ DES LOGICIELS DE MARKETING NUMÉRIQUE EN ASIE DU SUD-EST, PAR APPLICATION, 2020 À 2027 (MILLIONS USD) 61
- FIGURE 38 MARCHÉ DES LOGICIELS DE MARKETING NUMÉRIQUE EN ASIE DU SUD-EST, PAR APPLICATION, 2020 À 2027 (MILLIONS USD) 62
- FIGURE 39 ANALYSE COMPARATIVE DES PRINCIPAUX ACTEURS 65
Customer Stories

“This is really good guys. Excellent work on a tight deadline. I will continue to use you going forward and recommend you to others. Nice job”

“Thanks. It’s been a pleasure working with you, please use me as reference with any other Intel employees.”

“Thanks for sending the report it gives us a good global view of the Betaïne market.”

“Thank you, this will be very helpful for OQS.”

“We found the report very insightful! we found your research firm very helpful. I'm sending this email to secure our future business.”

“I am very pleased with how market segments have been defined in a relevant way for my purposes (such as "Portable Freezers & refrigerators" and "last-mile"). In general the report is well structured. Thanks very much for your efforts.”

“I have been reading the first document or the study, ,the Global HVAC and FP market report 2021 till 2026. Must say, good info! I have not gone in depth at all parts, but got a good indication of the data inside!”

“We got the report in time, we really thank you for your support in this process. I also thank to all of your team as they did a great job.”