Marché des Améliorants de l'Indice de Viscosité Automobile

ID: MRFR/CnM/36856-HCR
111 Pages
Chitranshi Jaiswal
Last Updated: April 06, 2026
Rapport de recherche sur le marché des améliorants de l'indice de viscosité automobile : par application (véhicules particuliers, véhicules commerciaux, motos, véhicules lourds), par type de produit (polyalphaoléfines, polyisobutylènes, polymères acryliques, copolymères éthylène-propylène), par grade de viscosité (viscosité faible, viscosité moyenne, viscosité élevée), par utilisation finale (industrie automobile, applications industrielles, machines agricoles) et par région (Amérique du Nord, Europe, Amérique du Sud, Asie-Pacifique, Moyen-Orient et Afrique) - Prévisions jusqu'en 2035.
Download PDF ×

We do not share your information with anyone. However, we may send you emails based on your report interest from time to time. You may contact us at any time to opt-out.

  1. 1 RÉSUMÉ EXÉCUTIF
    1. 1.1 Aperçu du marché
    2. 1.2 Principales conclusions
    3. 1.3 Segmentation du marché
    4. 1.4 Paysage concurrentiel
    5. 1.5 Défis et opportunités
    6. 1.6 Perspectives futures
  2. 2 INTRODUCTION AU MARCHÉ
    1. 2.1 Définition
    2. 2.2 Portée de l'étude
      1. 2.2.1 Objectif de recherche
      2. 2.2.2 Hypothèse
      3. 2.2.3 Limitations
  3. 3 MÉTHODOLOGIE DE RECHERCHE
    1. 3.1 Aperçu
    2. 3.2 Exploration de données
    3. 3.3 Recherche secondaire
    4. 3.4 Recherche primaire
      1. 3.4.1 Interviews primaires et processus de collecte d'informations
      2. 3.4.2 Répartition des répondants principaux
    5. 3.5 Modèle de prévision
    6. 3.6 Estimation de la taille du marché
      1. 3.6.1 Approche ascendante
      2. 3.6.2 Approche descendante
    7. 3.7 Triangulation des données
    8. 3.8 Validation
  4. 4 DYNAMIQUE DU MARCHÉ
    1. 4.1 Aperçu
    2. 4.2 Facteurs moteurs
    3. 4.3 Contraintes
    4. 4.4 Opportunités
  5. 5 ANALYSE DES FACTEURS DU MARCHÉ
    1. 5.1 Analyse de la chaîne de valeur
    2. 5.2 Analyse des cinq forces de Porter
      1. 5.2.1 Pouvoir de négociation des fournisseurs
      2. 5.2.2 Pouvoir de négociation des acheteurs
      3. 5.2.3 Menace des nouveaux entrants
      4. 5.2.4 Menace des substituts
      5. 5.2.5 Intensité de la rivalité
    3. 5.3 Analyse de l'impact du COVID-19
      1. 5.3.1 Analyse de l'impact sur le marché
      2. 5.3.2 Impact régional
      3. 5.3.3 Analyse des opportunités et des menaces
  6. 6 Marché des améliorants de l'indice de viscosité automobile, PAR application (milliards USD)
    1. 6.1 Véhicules particuliers
    2. 6.2 Véhicules commerciaux
    3. 6.3 Motos
    4. 6.4 Véhicules lourds
  7. 7 Marché des améliorants de l'indice de viscosité automobile, PAR type de produit (milliards USD)
    1. 7.1 Polyalphaoléfines
    2. 7.2 Polyisobutylènes
    3. 7.3 Polymères acryliques
    4. 7.4 Copolymères éthylène-propylène
  8. 8 Marché des améliorants de l'indice de viscosité automobile, PAR grade de viscosité (milliards USD)
    1. 8.1 Basse viscosité
    2. 8.2 Viscosité moyenne
    3. 8.3 Haute viscosité
  9. 9 Marché des améliorants de l'indice de viscosité automobile, PAR utilisation finale (milliards USD)
    1. 9.1 Industrie automobile
    2. 9.2 Applications industrielles
    3. 9.3 Machinerie agricole
  10. 10 Marché des améliorants de l'indice de viscosité automobile, PAR région (milliards USD)
    1. 10.1 Amérique du Nord
      1. 10.1.1 États-Unis
      2. 10.1.2 Canada
    2. 10.2 Europe
      1. 10.2.1 Allemagne
      2. 10.2.2 Royaume-Uni
      3. 10.2.3 France
      4. 10.2.4 Russie
      5. 10.2.5 Italie
      6. 10.2.6 Espagne
      7. 10.2.7 Reste de l'Europe
    3. 10.3 APAC
      1. 10.3.1 Chine
      2. 10.3.2 Inde
      3. 10.3.3 Japon
      4. 10.3.4 Corée du Sud
      5. 10.3.5 Malaisie
      6. 10.3.6 Thaïlande
      7. 10.3.7 Indonésie
      8. 10.3.8 Reste de l'APAC
    4. 10.4 Amérique du Sud
      1. 10.4.1 Brésil
      2. 10.4.2 Mexique
      3. 10.4.3 Argentine
      4. 10.4.4 Reste de l'Amérique du Sud
    5. 10.5 MEA
      1. 10.5.1 Pays du CCG
      2. 10.5.2 Afrique du Sud
      3. 10.5.3 Reste de la MEA
  11. 11 PAYSAGE CONCURRENTIEL
    1. 11.1 Aperçu
    2. 11.2 Analyse concurrentielle
    3. 11.3 Analyse de la part de marché
    4. 11.4 Principale stratégie de croissance sur le marché des améliorants de l'indice de viscosité automobile
    5. 11.5 Évaluation concurrentielle
    6. 11.6 Acteurs principaux en termes de nombre de développements sur le marché des améliorants de l'indice de viscosité automobile
    7. 11.7 Développements clés et stratégies de croissance
      1. 11.7.1 Lancement de nouveaux produits / Déploiement de services
      2. 11.7.2 Fusions et acquisitions
      3. 11.7.3 Coentreprises
    8. 11.8 Matrice financière des principaux acteurs
      1. 11.8.1 Ventes et revenus d'exploitation
      2. 11.8.2 Dépenses de R&D des principaux acteurs. 2023
  12. 12 PROFILS D'ENTREPRISE
    1. 12.1 Perstorp
      1. 12.1.1 Aperçu financier
      2. 12.1.2 Produits offerts
      3. 12.1.3 Développements clés
      4. 12.1.4 Analyse SWOT
      5. 12.1.5 Stratégies clés
    2. 12.2 Idemitsu Kosan
      1. 12.2.1 Aperçu financier
      2. 12.2.2 Produits offerts
      3. 12.2.3 Développements clés
      4. 12.2.4 Analyse SWOT
      5. 12.2.5 Stratégies clés
    3. 12.3 SABIC
      1. 12.3.1 Aperçu financier
      2. 12.3.2 Produits offerts
      3. 12.3.3 Développements clés
      4. 12.3.4 Analyse SWOT
      5. 12.3.5 Stratégies clés
    4. 12.4 Chevron
      1. 12.4.1 Aperçu financier
      2. 12.4.2 Produits offerts
      3. 12.4.3 Développements clés
      4. 12.4.4 Analyse SWOT
      5. 12.4.5 Stratégies clés
    5. 12.5 ExxonMobil
      1. 12.5.1 Aperçu financier
      2. 12.5.2 Produits offerts
      3. 12.5.3 Développements clés
      4. 12.5.4 Analyse SWOT
      5. 12.5.5 Stratégies clés
    6. 12.6 Afton Chemical
      1. 12.6.1 Aperçu financier
      2. 12.6.2 Produits offerts
      3. 12.6.3 Développements clés
      4. 12.6.4 Analyse SWOT
      5. 12.6.5 Stratégies clés
    7. 12.7 Infineum
      1. 12.7.1 Aperçu financier
      2. 12.7.2 Produits offerts
      3. 12.7.3 Développements clés
      4. 12.7.4 Analyse SWOT
      5. 12.7.5 Stratégies clés
    8. 12.8 Evonik
      1. 12.8.1 Aperçu financier
      2. 12.8.2 Produits offerts
      3. 12.8.3 Développements clés
      4. 12.8.4 Analyse SWOT
      5. 12.8.5 Stratégies clés
    9. 12.9 TotalEnergies
      1. 12.9.1 Aperçu financier
      2. 12.9.2 Produits offerts
      3. 12.9.3 Développements clés
      4. 12.9.4 Analyse SWOT
      5. 12.9.5 Stratégies clés
    10. 12.10 Petrobras
      1. 12.10.1 Aperçu financier
      2. 12.10.2 Produits offerts
      3. 12.10.3 Développements clés
      4. 12.10.4 Analyse SWOT
      5. 12.10.5 Stratégies clés
    11. 12.11 The Lubrizol Corporation
      1. 12.11.1 Aperçu financier
      2. 12.11.2 Produits offerts
      3. 12.11.3 Développements clés
      4. 12.11.4 Analyse SWOT
      5. 12.11.5 Stratégies clés
    12. 12.12 Fuchs Petrolub
      1. 12.12.1 Aperçu financier
      2. 12.12.2 Produits offerts
      3. 12.12.3 Développements clés
      4. 12.12.4 Analyse SWOT
      5. 12.12.5 Stratégies clés
    13. 12.13 BASF
      1. 12.13.1 Aperçu financier
      2. 12.13.2 Produits offerts
      3. 12.13.3 Développements clés
      4. 12.13.4 Analyse SWOT
      5. 12.13.5 Stratégies clés
    14. 12.14 Dow
      1. 12.14.1 Aperçu financier
      2. 12.14.2 Produits offerts
      3. 12.14.3 Développements clés
      4. 12.14.4 Analyse SWOT
      5. 12.14.5 Stratégies clés
    15. 12.15 Royal Dutch Shell
      1. 12.15.1 Aperçu financier
      2. 12.15.2 Produits offerts
      3. 12.15.3 Développements clés
      4. 12.15.4 Analyse SWOT
      5. 12.15.5 Stratégies clés
  13. 13 Annexe
    1. 13.1 Références
    2. 13.2 Rapports connexes
    3. LISTE
  14. TABLE 1 LISTE DES HYPOTHÈSES
  15. TABLE 2 ESTIMATIONS DE TAILLE DU MARCHÉ DES AMÉLIORANTS DE L'INDICE DE VISCOSITÉ AUTOMOBILE EN AMÉRIQUE DU NORD & PRÉVISIONS, PAR APPLICATION, 2025-2034 (milliards USD)
  16. TABLE 3 ESTIMATIONS DE TAILLE DU MARCHÉ DES AMÉLIORANTS DE L'INDICE DE VISCOSITÉ AUTOMOBILE EN AMÉRIQUE DU NORD & PRÉVISIONS, PAR TYPE DE PRODUIT, 2025-2034 (milliards USD)
  17. TABLE 4 ESTIMATIONS DE TAILLE DU MARCHÉ DES AMÉLIORANTS DE L'INDICE DE VISCOSITÉ AUTOMOBILE EN AMÉRIQUE DU NORD & PRÉVISIONS, PAR GRADE DE VISCOSITÉ, 2025-2034 (milliards USD)
  18. TABLE 5 ESTIMATIONS DE TAILLE DU MARCHÉ DES AMÉLIORANTS DE L'INDICE DE VISCOSITÉ AUTOMOBILE EN AMÉRIQUE DU NORD & PRÉVISIONS, PAR UTILISATION FINALE, 2025-2034 (milliards USD)
  19. TABLE 6 ESTIMATIONS DE TAILLE DU MARCHÉ DES AMÉLIORANTS DE L'INDICE DE VISCOSITÉ AUTOMOBILE EN AMÉRIQUE DU NORD & PRÉVISIONS, PAR RÉGION, 2025-2034 (milliards USD)
  20. TABLE 7 ESTIMATIONS DE TAILLE DU MARCHÉ DES AMÉLIORANTS DE L'INDICE DE VISCOSITÉ AUTOMOBILE AUX ÉTATS-UNIS & PRÉVISIONS, PAR APPLICATION, 2025-2034 (milliards USD)
  21. TABLE 8 ESTIMATIONS DE TAILLE DU MARCHÉ DES AMÉLIORANTS DE L'INDICE DE VISCOSITÉ AUTOMOBILE AUX ÉTATS-UNIS & PRÉVISIONS, PAR TYPE DE PRODUIT, 2025-2034 (milliards USD)
  22. TABLE 9 ESTIMATIONS DE TAILLE DU MARCHÉ DES AMÉLIORANTS DE L'INDICE DE VISCOSITÉ AUTOMOBILE AUX ÉTATS-UNIS & PRÉVISIONS, PAR GRADE DE VISCOSITÉ, 2025-2034 (milliards USD)
  23. TABLE 10 ESTIMATIONS DE TAILLE DU MARCHÉ DES AMÉLIORANTS DE L'INDICE DE VISCOSITÉ AUTOMOBILE AUX ÉTATS-UNIS & PRÉVISIONS, PAR UTILISATION FINALE, 2025-2034 (milliards USD)
  24. TABLE 11 ESTIMATIONS DE TAILLE DU MARCHÉ DES AMÉLIORANTS DE L'INDICE DE VISCOSITÉ AUTOMOBILE AUX ÉTATS-UNIS & PRÉVISIONS, PAR RÉGION, 2025-2034 (milliards USD)
  25. TABLE 12 ESTIMATIONS DE TAILLE DU MARCHÉ DES AMÉLIORANTS DE L'INDICE DE VISCOSITÉ AUTOMOBILE AU CANADA & PRÉVISIONS, PAR APPLICATION, 2025-2034 (milliards USD)
  26. TABLE 13 ESTIMATIONS DE TAILLE DU MARCHÉ DES AMÉLIORANTS DE L'INDICE DE VISCOSITÉ AUTOMOBILE AU CANADA & PRÉVISIONS, PAR TYPE DE PRODUIT, 2025-2034 (milliards USD)
  27. TABLE 14 ESTIMATIONS DE TAILLE DU MARCHÉ DES AMÉLIORANTS DE L'INDICE DE VISCOSITÉ AUTOMOBILE AU CANADA & PRÉVISIONS, PAR GRADE DE VISCOSITÉ, 2025-2034 (milliards USD)
  28. TABLE 15 ESTIMATIONS DE TAILLE DU MARCHÉ DES AMÉLIORANTS DE L'INDICE DE VISCOSITÉ AUTOMOBILE AU CANADA & PRÉVISIONS, PAR UTILISATION FINALE, 2025-2034 (milliards USD)
  29. TABLE 16 ESTIMATIONS DE TAILLE DU MARCHÉ DES AMÉLIORANTS DE L'INDICE DE VISCOSITÉ AUTOMOBILE AU CANADA & PRÉVISIONS, PAR RÉGION, 2025-2034 (milliards USD)
  30. TABLE 17 ESTIMATIONS DE TAILLE DU MARCHÉ DES AMÉLIORANTS DE L'INDICE DE VISCOSITÉ AUTOMOBILE EN EUROPE & PRÉVISIONS, PAR APPLICATION, 2025-2034 (milliards USD)
  31. TABLE 18 ESTIMATIONS DE TAILLE DU MARCHÉ DES AMÉLIORANTS DE L'INDICE DE VISCOSITÉ AUTOMOBILE EN EUROPE & PRÉVISIONS, PAR TYPE DE PRODUIT, 2025-2034 (milliards USD)
  32. TABLE 19 ESTIMATIONS DE TAILLE DU MARCHÉ DES AMÉLIORANTS DE L'INDICE DE VISCOSITÉ AUTOMOBILE EN EUROPE & PRÉVISIONS, PAR GRADE DE VISCOSITÉ, 2025-2034 (milliards USD)
  33. TABLE 20 ESTIMATIONS DE TAILLE DU MARCHÉ DES AMÉLIORANTS DE L'INDICE DE VISCOSITÉ AUTOMOBILE EN EUROPE & PRÉVISIONS, PAR UTILISATION FINALE, 2025-2034 (milliards USD)
  34. TABLE 21 ESTIMATIONS DE TAILLE DU MARCHÉ DES AMÉLIORANTS DE L'INDICE DE VISCOSITÉ AUTOMOBILE EN EUROPE & PRÉVISIONS, PAR RÉGION, 2025-2034 (milliards USD)
  35. TABLE 22 ESTIMATIONS DE TAILLE DU MARCHÉ DES AMÉLIORANTS DE L'INDICE DE VISCOSITÉ AUTOMOBILE EN ALLEMAGNE & PRÉVISIONS, PAR APPLICATION, 2025-2034 (milliards USD)
  36. TABLE 23 ESTIMATIONS DE TAILLE DU MARCHÉ DES AMÉLIORANTS DE L'INDICE DE VISCOSITÉ AUTOMOBILE EN ALLEMAGNE & PRÉVISIONS, PAR TYPE DE PRODUIT, 2025-2034 (milliards USD)
  37. TABLE 24 ESTIMATIONS DE TAILLE DU MARCHÉ DES AMÉLIORANTS DE L'INDICE DE VISCOSITÉ AUTOMOBILE EN ALLEMAGNE & PRÉVISIONS, PAR GRADE DE VISCOSITÉ, 2025-2034 (milliards USD)
  38. TABLE 25 ESTIMATIONS DE TAILLE DU MARCHÉ DES AMÉLIORANTS DE L'INDICE DE VISCOSITÉ AUTOMOBILE EN ALLEMAGNE & PRÉVISIONS, PAR UTILISATION FINALE, 2025-2034 (milliards USD)
  39. TABLE 26 ESTIMATIONS DE TAILLE DU MARCHÉ DES AMÉLIORANTS DE L'INDICE DE VISCOSITÉ AUTOMOBILE EN ALLEMAGNE & PRÉVISIONS, PAR RÉGION, 2025-2034 (milliards USD)
  40. TABLE 27 ESTIMATIONS DE TAILLE DU MARCHÉ DES AMÉLIORANTS DE L'INDICE DE VISCOSITÉ AUTOMOBILE AU ROYAUME-UNI & PRÉVISIONS, PAR APPLICATION, 2025-2034 (milliards USD)
  41. TABLE 28 ESTIMATIONS DE TAILLE DU MARCHÉ DES AMÉLIORANTS DE L'INDICE DE VISCOSITÉ AUTOMOBILE AU ROYAUME-UNI & PRÉVISIONS, PAR TYPE DE PRODUIT, 2025-2034 (milliards USD)
  42. TABLE 29 ESTIMATIONS DE TAILLE DU MARCHÉ DES AMÉLIORANTS DE L'INDICE DE VISCOSITÉ AUTOMOBILE AU ROYAUME-UNI & PRÉVISIONS, PAR GRADE DE VISCOSITÉ, 2025-2034 (milliards USD)
  43. TABLE 30 ESTIMATIONS DE TAILLE DU MARCHÉ DES AMÉLIORANTS DE L'INDICE DE VISCOSITÉ AUTOMOBILE AU ROYAUME-UNI & PRÉVISIONS, PAR UTILISATION FINALE, 2025-2034 (milliards USD)
  44. TABLE 31 ESTIMATIONS DE TAILLE DU MARCHÉ DES AMÉLIORANTS DE L'INDICE DE VISCOSITÉ AUTOMOBILE AU ROYAUME-UNI & PRÉVISIONS, PAR RÉGION, 2025-2034 (milliards USD)
  45. TABLE 32 ESTIMATIONS DE TAILLE DU MARCHÉ DES AMÉLIORANTS DE L'INDICE DE VISCOSITÉ AUTOMOBILE EN FRANCE & PRÉVISIONS, PAR APPLICATION, 2025-2034 (milliards USD)
  46. TABLE 33 ESTIMATIONS DE TAILLE DU MARCHÉ DES AMÉLIORANTS DE L'INDICE DE VISCOSITÉ AUTOMOBILE EN FRANCE & PRÉVISIONS, PAR TYPE DE PRODUIT, 2025-2034 (milliards USD)
  47. TABLE 34 ESTIMATIONS DE TAILLE DU MARCHÉ DES AMÉLIORANTS DE L'INDICE DE VISCOSITÉ AUTOMOBILE EN FRANCE & PRÉVISIONS, PAR GRADE DE VISCOSITÉ, 2025-2034 (milliards USD)
  48. TABLE 35 ESTIMATIONS DE TAILLE DU MARCHÉ DES AMÉLIORANTS DE L'INDICE DE VISCOSITÉ AUTOMOBILE EN FRANCE & PRÉVISIONS, PAR UTILISATION FINALE, 2025-2034 (milliards USD)
  49. TABLE 36 ESTIMATIONS DE TAILLE DU MARCHÉ DES AMÉLIORANTS DE L'INDICE DE VISCOSITÉ AUTOMOBILE EN FRANCE & PRÉVISIONS, PAR RÉGION, 2025-2034 (milliards USD)
  50. TABLE 37 ESTIMATIONS DE TAILLE DU MARCHÉ DES AMÉLIORANTS DE L'INDICE DE VISCOSITÉ AUTOMOBILE EN RUSSIE & PRÉVISIONS, PAR APPLICATION, 2025-2034 (milliards USD)
  51. TABLE 38 ESTIMATIONS DE TAILLE DU MARCHÉ DES AMÉLIORANTS DE L'INDICE DE VISCOSITÉ AUTOMOBILE EN RUSSIE & PRÉVISIONS, PAR TYPE DE PRODUIT, 2025-2034 (milliards USD)
  52. TABLE 39 ESTIMATIONS DE TAILLE DU MARCHÉ DES AMÉLIORANTS DE L'INDICE DE VISCOSITÉ AUTOMOBILE EN RUSSIE & PRÉVISIONS, PAR GRADE DE VISCOSITÉ, 2025-2034 (milliards USD)
  53. TABLE 40 ESTIMATIONS DE TAILLE DU MARCHÉ DES AMÉLIORANTS DE L'INDICE DE VISCOSITÉ AUTOMOBILE EN RUSSIE & PRÉVISIONS, PAR UTILISATION FINALE, 2025-2034 (milliards USD)
  54. TABLE 41 ESTIMATIONS DE TAILLE DU MARCHÉ DES AMÉLIORANTS DE L'INDICE DE VISCOSITÉ AUTOMOBILE EN RUSSIE & PRÉVISIONS, PAR RÉGION, 2025-2034 (milliards USD)
  55. TABLE 42 ESTIMATIONS DE TAILLE DU MARCHÉ DES AMÉLIORANTS DE L'INDICE DE VISCOSITÉ AUTOMOBILE EN ITALIE & PRÉVISIONS, PAR APPLICATION, 2025-2034 (milliards USD)
  56. TABLE 43 ESTIMATIONS DE TAILLE DU MARCHÉ DES AMÉLIORANTS DE L'INDICE DE VISCOSITÉ AUTOMOBILE EN ITALIE & PRÉVISIONS, PAR TYPE DE PRODUIT, 2025-2034 (milliards USD)
  57. TABLE 44 ESTIMATIONS DE TAILLE DU MARCHÉ DES AMÉLIORANTS DE L'INDICE DE VISCOSITÉ AUTOMOBILE EN ITALIE & PRÉVISIONS, PAR GRADE DE VISCOSITÉ, 2025-2034 (milliards USD)
  58. TABLE 45 ESTIMATIONS DE TAILLE DU MARCHÉ DES AMÉLIORANTS DE L'INDICE DE VISCOSITÉ AUTOMOBILE EN ITALIE & PRÉVISIONS, PAR UTILISATION FINALE, 2025-2034 (milliards USD)
  59. TABLE 46 ESTIMATIONS DE TAILLE DU MARCHÉ DES AMÉLIORANTS DE L'INDICE DE VISCOSITÉ AUTOMOBILE EN ITALIE & PRÉVISIONS, PAR RÉGION, 2025-2034 (milliards USD)
  60. TABLE 47 ESTIMATIONS DE TAILLE DU MARCHÉ DES AMÉLIORANTS DE L'INDICE DE VISCOSITÉ AUTOMOBILE EN ESPAGNE & PRÉVISIONS, PAR APPLICATION, 2025-2034 (milliards USD)
  61. TABLE 48 ESTIMATIONS DE TAILLE DU MARCHÉ DES AMÉLIORANTS DE L'INDICE DE VISCOSITÉ AUTOMOBILE EN ESPAGNE & PRÉVISIONS, PAR TYPE DE PRODUIT, 2025-2034 (milliards USD)
  62. TABLE 49 ESTIMATIONS DE TAILLE DU MARCHÉ DES AMÉLIORANTS DE L'INDICE DE VISCOSITÉ AUTOMOBILE EN ESPAGNE & PRÉVISIONS, PAR GRADE DE VISCOSITÉ, 2025-2034 (milliards USD)
  63. TABLE 50 ESTIMATIONS DE TAILLE DU MARCHÉ DES AMÉLIORANTS DE L'INDICE DE VISCOSITÉ AUTOMOBILE EN ESPAGNE & PRÉVISIONS, PAR UTILISATION FINALE, 2025-2034 (milliards USD)
  64. TABLE 51 ESTIMATIONS DE TAILLE DU MARCHÉ DES AMÉLIORANTS DE L'INDICE DE VISCOSITÉ AUTOMOBILE EN ESPAGNE & PRÉVISIONS, PAR RÉGION, 2025-2034 (milliards USD)
  65. TABLE 52 ESTIMATIONS DE TAILLE DU MARCHÉ DES AMÉLIORANTS DE L'INDICE DE VISCOSITÉ AUTOMOBILE EN RESTE DE L'EUROPE & PRÉVISIONS, PAR APPLICATION, 2025-2034 (milliards USD)
  66. TABLE 53 ESTIMATIONS DE TAILLE DU MARCHÉ DES AMÉLIORANTS DE L'INDICE DE VISCOSITÉ AUTOMOBILE EN RESTE DE L'EUROPE & PRÉVISIONS, PAR TYPE DE PRODUIT, 2025-2034 (milliards USD)
  67. TABLE 54 ESTIMATIONS DE TAILLE DU MARCHÉ DES AMÉLIORANTS DE L'INDICE DE VISCOSITÉ AUTOMOBILE EN RESTE DE L'EUROPE & PRÉVISIONS, PAR GRADE DE VISCOSITÉ, 2025-2034 (milliards USD)
  68. TABLE 55 ESTIMATIONS DE TAILLE DU MARCHÉ DES AMÉLIORANTS DE L'INDICE DE VISCOSITÉ AUTOMOBILE EN RESTE DE L'EUROPE & PRÉVISIONS, PAR UTILISATION FINALE, 2025-2034 (milliards USD)
  69. TABLE 56 ESTIMATIONS DE TAILLE DU MARCHÉ DES AMÉLIORANTS DE L'INDICE DE VISCOSITÉ AUTOMOBILE EN RESTE DE L'EUROPE & PRÉVISIONS, PAR RÉGION, 2025-2034 (milliards USD)
  70. TABLE 57 ESTIMATIONS DE TAILLE DU MARCHÉ DES AMÉLIORANTS DE L'INDICE DE VISCOSITÉ AUTOMOBILE EN APAC & PRÉVISIONS, PAR APPLICATION, 2025-2034 (milliards USD)
  71. TABLE 58 ESTIMATIONS DE TAILLE DU MARCHÉ DES AMÉLIORANTS DE L'INDICE DE VISCOSITÉ AUTOMOBILE EN APAC & PRÉVISIONS, PAR TYPE DE PRODUIT, 2025-2034 (milliards USD)
  72. TABLE 59 ESTIMATIONS DE TAILLE DU MARCHÉ DES AMÉLIORANTS DE L'INDICE DE VISCOSITÉ AUTOMOBILE EN APAC & PRÉVISIONS, PAR GRADE DE VISCOSITÉ, 2025-2034 (milliards USD)
  73. TABLE 60 ESTIMATIONS DE TAILLE DU MARCHÉ DES AMÉLIORANTS DE L'INDICE DE VISCOSITÉ AUTOMOBILE EN APAC & PRÉVISIONS, PAR UTILISATION FINALE, 2025-2034 (milliards USD)
  74. TABLE 61 ESTIMATIONS DE TAILLE DU MARCHÉ DES AMÉLIORANTS DE L'INDICE DE VISCOSITÉ AUTOMOBILE EN APAC & PRÉVISIONS, PAR RÉGION, 2025-2034 (milliards USD)
  75. TABLE 62 ESTIMATIONS DE TAILLE DU MARCHÉ DES AMÉLIORANTS DE L'INDICE DE VISCOSITÉ AUTOMOBILE EN CHINE & PRÉVISIONS, PAR APPLICATION, 2025-2034 (milliards USD)
  76. TABLE 63 ESTIMATIONS DE TAILLE DU MARCHÉ DES AMÉLIORANTS DE L'INDICE DE VISCOSITÉ AUTOMOBILE EN CHINE & PRÉVISIONS, PAR TYPE DE PRODUIT, 2025-2034 (milliards USD)
  77. TABLE 64 ESTIMATIONS DE TAILLE DU MARCHÉ DES AMÉLIORANTS DE L'INDICE DE VISCOSITÉ AUTOMOBILE EN CHINE & PRÉVISIONS, PAR GRADE DE VISCOSITÉ, 2025-2034 (milliards USD)
  78. TABLE 65 ESTIMATIONS DE TAILLE DU MARCHÉ DES AMÉLIORANTS DE L'INDICE DE VISCOSITÉ AUTOMOBILE EN CHINE & PRÉVISIONS, PAR UTILISATION FINALE, 2025-2034 (milliards USD)
  79. TABLE 66 ESTIMATIONS DE TAILLE DU MARCHÉ DES AMÉLIORANTS DE L'INDICE DE VISCOSITÉ AUTOMOBILE EN CHINE & PRÉVISIONS, PAR RÉGION, 2025-2034 (milliards USD)
  80. TABLE 67 ESTIMATIONS DE TAILLE DU MARCHÉ DES AMÉLIORANTS DE L'INDICE DE VISCOSITÉ AUTOMOBILE EN INDE & PRÉVISIONS, PAR APPLICATION, 2025-2034 (milliards USD)
  81. TABLE 68 ESTIMATIONS DE TAILLE DU MARCHÉ DES AMÉLIORANTS DE L'INDICE DE VISCOSITÉ AUTOMOBILE EN INDE & PRÉVISIONS, PAR TYPE DE PRODUIT, 2025-2034 (milliards USD)
  82. TABLE 69 ESTIMATIONS DE TAILLE DU MARCHÉ DES AMÉLIORANTS DE L'INDICE DE VISCOSITÉ AUTOMOBILE EN INDE & PRÉVISIONS, PAR GRADE DE VISCOSITÉ, 2025-2034 (milliards USD)
  83. TABLE 70 ESTIMATIONS DE TAILLE DU MARCHÉ DES AMÉLIORANTS DE L'INDICE DE VISCOSITÉ AUTOMOBILE EN INDE & PRÉVISIONS, PAR UTILISATION FINALE, 2025-2034 (milliards USD)
  84. TABLE 71 ESTIMATIONS DE TAILLE DU MARCHÉ DES AMÉLIORANTS DE L'INDICE DE VISCOSITÉ AUTOMOBILE EN INDE & PRÉVISIONS, PAR RÉGION, 2025-2034 (milliards USD)
  85. TABLE 72 ESTIMATIONS DE TAILLE DU MARCHÉ DES AMÉLIORANTS DE L'INDICE DE VISCOSITÉ AUTOMOBILE AU JAPON & PRÉVISIONS, PAR APPLICATION, 2025-2034 (milliards USD)
  86. TABLE 73 ESTIMATIONS DE TAILLE DU MARCHÉ DES AMÉLIORANTS DE L'INDICE DE VISCOSITÉ AUTOMOBILE AU JAPON & PRÉVISIONS, PAR TYPE DE PRODUIT, 2025-2034 (milliards USD)
  87. TABLE 74 ESTIMATIONS DE TAILLE DU MARCHÉ DES AMÉLIORANTS DE L'INDICE DE VISCOSITÉ AUTOMOBILE AU JAPON & PRÉVISIONS, PAR GRADE DE VISCOSITÉ, 2025-2034 (milliards USD)
  88. TABLE 75 ESTIMATIONS DE TAILLE DU MARCHÉ DES AMÉLIORANTS DE L'INDICE DE VISCOSITÉ AUTOMOBILE AU JAPON & PRÉVISIONS, PAR UTILISATION FINALE, 2025-2034 (milliards USD)
  89. TABLE 76 ESTIMATIONS DE TAILLE DU MARCHÉ DES AMÉLIORANTS DE L'INDICE DE VISCOSITÉ AUTOMOBILE AU JAPON & PRÉVISIONS, PAR RÉGION, 2025-2034 (milliards USD)
  90. TABLE 77 ESTIMATIONS DE TAILLE DU MARCHÉ DES AMÉLIORANTS DE L'INDICE DE VISCOSITÉ AUTOMOBILE EN CORÉE DU SUD & PRÉVISIONS, PAR APPLICATION, 2025-2034 (milliards USD)
  91. TABLE 78 ESTIMATIONS DE TAILLE DU MARCHÉ DES AMÉLIORANTS DE L'INDICE DE VISCOSITÉ AUTOMOBILE EN CORÉE DU SUD & PRÉVISIONS, PAR TYPE DE PRODUIT, 2025-2034 (milliards USD)
  92. TABLE 79 ESTIMATIONS DE TAILLE DU MARCHÉ DES AMÉLIORANTS DE L'INDICE DE VISCOSITÉ AUTOMOBILE EN CORÉE DU SUD & PRÉVISIONS, PAR GRADE DE VISCOSITÉ, 2025-2034 (milliards USD)
  93. TABLE 80 ESTIMATIONS DE TAILLE DU MARCHÉ DES AMÉLIORANTS DE L'INDICE DE VISCOSITÉ AUTOMOBILE EN CORÉE DU SUD & PRÉVISIONS, PAR UTILISATION FINALE, 2025-2034 (milliards USD)
  94. TABLE 81 ESTIMATIONS DE TAILLE DU MARCHÉ DES AMÉLIORANTS DE L'INDICE DE VISCOSITÉ AUTOMOBILE EN CORÉE DU SUD & PRÉVISIONS, PAR RÉGION, 2025-2034 (milliards USD)
  95. TABLE 82 ESTIMATIONS DE TAILLE DU MARCHÉ DES AMÉLIORANTS DE L'INDICE DE VISCOSITÉ AUTOMOBILE EN MALAYSIE & PRÉVISIONS, PAR APPLICATION, 2025-2034 (milliards USD)
  96. TABLE 83 ESTIMATIONS DE TAILLE DU MARCHÉ DES AMÉLIORANTS DE L'INDICE DE VISCOSITÉ AUTOMOBILE EN MALAYSIE & PRÉVISIONS, PAR TYPE DE PRODUIT, 2025-2034 (milliards USD)
  97. TABLE 84 ESTIMATIONS DE TAILLE DU MARCHÉ DES AMÉLIORANTS DE L'INDICE DE VISCOSITÉ AUTOMOBILE EN MALAYSIE & PRÉVISIONS, PAR GRADE DE VISCOSITÉ, 2025-2034 (milliards USD)
  98. TABLE 85 ESTIMATIONS DE TAILLE DU MARCHÉ DES AMÉLIORANTS DE L'INDICE DE VISCOSITÉ AUTOMOBILE EN MALAYSIE & PRÉVISIONS, PAR UTILISATION FINALE, 2025-2034 (milliards USD)
  99. TABLE 86 ESTIMATIONS DE TAILLE DU MARCHÉ DES AMÉLIORANTS DE L'INDICE DE VISCOSITÉ AUTOMOBILE EN MALAYSIE & PRÉVISIONS, PAR RÉGION, 2025-2034 (milliards USD)
  100. TABLE 87 ESTIMATIONS DE TAILLE DU MARCHÉ DES AMÉLIORANTS DE L'INDICE DE VISCOSITÉ AUTOMOBILE EN THAÏLANDE & PRÉVISIONS, PAR APPLICATION, 2025-2034 (milliards USD)
  101. TABLE 88 ESTIMATIONS DE TAILLE DU MARCHÉ DES AMÉLIORANTS DE L'INDICE DE VISCOSITÉ AUTOMOBILE EN THAÏLANDE & PRÉVISIONS, PAR TYPE DE PRODUIT, 2025-2034 (milliards USD)
  102. TABLE 89 ESTIMATIONS DE TAILLE DU MARCHÉ DES AMÉLIORANTS DE L'INDICE DE VISCOSITÉ AUTOMOBILE EN THAÏLANDE & PRÉVISIONS, PAR GRADE DE VISCOSITÉ, 2025-2034 (milliards USD)
  103. TABLE 90 ESTIMATIONS DE TAILLE DU MARCHÉ DES AMÉLIORANTS DE L'INDICE DE VISCOSITÉ AUTOMOBILE EN THAÏLANDE & PRÉVISIONS, PAR UTILISATION FINALE, 2025-2034 (milliards USD)
  104. TABLE 91 ESTIMATIONS DE TAILLE DU MARCHÉ DES AMÉLIORANTS DE L'INDICE DE VISCOSITÉ AUTOMOBILE EN THAÏLANDE & PRÉVISIONS, PAR RÉGION, 2025-2034 (milliards USD)
  105. TABLE 92 ESTIMATIONS DE TAILLE DU MARCHÉ DES AMÉLIORANTS DE L'INDICE DE VISCOSITÉ AUTOMOBILE EN INDONÉSIE & PRÉVISIONS, PAR APPLICATION, 2025-2034 (milliards USD)
  106. TABLE 93 ESTIMATIONS DE TAILLE DU MARCHÉ DES AMÉLIORANTS DE L'INDICE DE VISCOSITÉ AUTOMOBILE EN INDONÉSIE & PRÉVISIONS, PAR TYPE DE PRODUIT, 2025-2034 (milliards USD)
  107. TABLE 94 ESTIMATIONS DE TAILLE DU MARCHÉ DES AMÉLIORANTS DE L'INDICE DE VISCOSITÉ AUTOMOBILE EN INDONÉSIE & PRÉVISIONS, PAR GRADE DE VISCOSITÉ, 2025-2034 (milliards USD)
  108. TABLE 95 ESTIMATIONS DE TAILLE DU MARCHÉ DES AMÉLIORANTS DE L'INDICE DE VISCOSITÉ AUTOMOBILE EN INDONÉSIE & PRÉVISIONS, PAR UTILISATION FINALE, 2025-2034 (milliards USD)
  109. TABLE 96 ESTIMATIONS DE TAILLE DU MARCHÉ DES AMÉLIORANTS DE L'INDICE DE VISCOSITÉ AUTOMOBILE EN INDONÉSIE & PRÉVISIONS, PAR RÉGION, 2025-2034 (milliards USD)
  110. TABLE 97 ESTIMATIONS DE TAILLE DU MARCHÉ DES AMÉLIORANTS DE L'INDICE DE VISCOSITÉ AUTOMOBILE EN RESTE DE L'APAC & PRÉVISIONS, PAR APPLICATION, 2025-2034 (milliards USD)
  111. TABLE 98 ESTIMATIONS DE TAILLE DU MARCHÉ DES AMÉLIORANTS DE L'INDICE DE VISCOSITÉ AUTOMOBILE EN RESTE DE L'APAC & PRÉVISIONS, PAR TYPE DE PRODUIT, 2025-2034 (milliards USD)
  112. TABLE 99 ESTIMATIONS DE TAILLE DU MARCHÉ DES AMÉLIORANTS DE L'INDICE DE VISCOSITÉ AUTOMOBILE EN RESTE DE L'APAC & PRÉVISIONS, PAR GRADE DE VISCOSITÉ, 2025-2034 (milliards USD)
  113. TABLE 100 ESTIMATIONS DE TAILLE DU MARCHÉ DES AMÉLIORANTS DE L'INDICE DE VISCOSITÉ AUTOMOBILE EN RESTE DE L'APAC & PRÉVISIONS, PAR UTILISATION FINALE, 2025-2034 (milliards USD)
  114. TABLE 101 ESTIMATIONS DE TAILLE DU MARCHÉ DES AMÉLIORANTS DE L'INDICE DE VISCOSITÉ AUTOMOBILE EN RESTE DE L'APAC & PRÉVISIONS, PAR RÉGION, 2025-2034 (milliards USD)
  115. TABLE 102 ESTIMATIONS DE TAILLE DU MARCHÉ DES AMÉLIORANTS DE L'INDICE DE VISCOSITÉ AUTOMOBILE EN AMÉRIQUE DU SUD & PRÉVISIONS, PAR APPLICATION, 2025-2034 (milliards USD)
  116. TABLE 103 ESTIMATIONS DE TAILLE DU MARCHÉ DES AMÉLIORANTS DE L'INDICE DE VISCOSITÉ AUTOMOBILE EN AMÉRIQUE DU SUD & PRÉVISIONS, PAR TYPE DE PRODUIT, 2025-2034 (milliards USD)
  117. TABLE 104 ESTIMATIONS DE TAILLE DU MARCHÉ DES AMÉLIORANTS DE L'INDICE DE VISCOSITÉ AUTOMOBILE EN AMÉRIQUE DU SUD & PRÉVISIONS, PAR GRADE DE VISCOSITÉ, 2025-2034 (milliards USD)
  118. TABLE 105 ESTIMATIONS DE TAILLE DU MARCHÉ DES AMÉLIORANTS DE L'INDICE DE VISCOSITÉ AUTOMOBILE EN AMÉRIQUE DU SUD & PRÉVISIONS, PAR UTILISATION FINALE, 2025-2034 (milliards USD)
  119. TABLE 106 ESTIMATIONS DE TAILLE DU MARCHÉ DES AMÉLIORANTS DE L'INDICE DE VISCOSITÉ AUTOMOBILE EN AMÉRIQUE DU SUD & PRÉVISIONS, PAR RÉGION, 2025-2034 (milliards USD)
  120. TABLE 107 ESTIMATIONS DE TAILLE DU MARCHÉ DES AMÉLIORANTS DE L'INDICE DE VISCOSITÉ AUTOMOBILE AU BRÉSIL & PRÉVISIONS, PAR APPLICATION, 2025-2034 (milliards USD)
  121. TABLE 108 ESTIMATIONS DE TAILLE DU MARCHÉ DES AMÉLIORANTS DE L'INDICE DE VISCOSITÉ AUTOMOBILE AU BRÉSIL & PRÉVISIONS, PAR TYPE DE PRODUIT, 2025-2034 (milliards USD)
  122. TABLE 109 ESTIMATIONS DE TAILLE DU MARCHÉ DES AMÉLIORANTS DE L'INDICE DE VISCOSITÉ AUTOMOBILE AU BRÉSIL & PRÉVISIONS, PAR GRADE DE VISCOSITÉ, 2025-2034 (milliards USD)
  123. TABLE 110 ESTIMATIONS DE TAILLE DU MARCHÉ DES AMÉLIORANTS DE L'INDICE DE VISCOSITÉ AUTOMOBILE AU BRÉSIL & PRÉVISIONS, PAR UTILISATION FINALE, 2025-2034 (milliards USD)
  124. TABLE 111 ESTIMATIONS DE TAILLE DU MARCHÉ DES AMÉLIORANTS DE L'INDICE DE VISCOSITÉ AUTOMOBILE AU BRÉSIL & PRÉVISIONS, PAR RÉGION, 2025-2034 (milliards USD)
  125. TABLE 112 ESTIMATIONS DE TAILLE DU MARCHÉ DES AMÉLIORANTS DE L'INDICE DE VISCOSITÉ AUTOMOBILE AU MEXIQUE & PRÉVISIONS, PAR APPLICATION, 2025-2034 (milliards USD)
  126. TABLE 113 ESTIMATIONS DE TAILLE DU MARCHÉ DES AMÉLIORANTS DE L'INDICE DE VISCOSITÉ AUTOMOBILE AU MEXIQUE & PRÉVISIONS, PAR TYPE DE PRODUIT, 2025-2034 (milliards USD)
  127. TABLE 114 ESTIMATIONS DE TAILLE DU MARCHÉ DES AMÉLIORANTS DE L'INDICE DE VISCOSITÉ AUTOMOBILE AU MEXIQUE & PRÉVISIONS, PAR GRADE DE VISCOSITÉ, 2025-2034 (milliards USD)
  128. TABLE 115 ESTIMATIONS DE TAILLE DU MARCHÉ DES AMÉLIORANTS DE L'INDICE DE VISCOSITÉ AUTOMOBILE AU MEXIQUE & PRÉVISIONS, PAR UTILISATION FINALE, 2025-2034 (milliards USD)
  129. TABLE 116 ESTIMATIONS DE TAILLE DU MARCHÉ DES AMÉLIORANTS DE L'INDICE DE VISCOSITÉ AUTOMOBILE AU MEXIQUE & PRÉVISIONS, PAR RÉGION, 2025-2034 (milliards USD)
  130. TABLE 117 ESTIMATIONS DE TAILLE DU MARCHÉ DES AMÉLIORANTS DE L'INDICE DE VISCOSITÉ AUTOMOBILE EN ARGENTINE & PRÉVISIONS, PAR APPLICATION, 2025-2034 (milliards USD)
  131. TABLE 118 ESTIMATIONS DE TAILLE DU MARCHÉ DES AMÉLIORANTS DE L'INDICE DE VISCOSITÉ AUTOMOBILE EN ARGENTINE & PRÉVISIONS, PAR TYPE DE PRODUIT, 2025-2034 (milliards USD)
  132. TABLE 119 ESTIMATIONS DE TAILLE DU MARCHÉ DES AMÉLIORANTS DE L'INDICE DE VISCOSITÉ AUTOMOBILE EN ARGENTINE & PRÉVISIONS, PAR GRADE DE VISCOSITÉ, 2025-2034 (milliards USD)
  133. TABLE 120 ESTIMATIONS DE TAILLE DU MARCHÉ DES AMÉLIORANTS DE L'INDICE DE VISCOSITÉ AUTOMOBILE EN ARGENTINE & PRÉVISIONS, PAR UTILISATION FINALE, 2025-2034 (milliards USD)
  134. TABLE 121 ESTIMATIONS DE TAILLE DU MARCHÉ DES AMÉLIORANTS DE L'INDICE DE VISCOSITÉ AUTOMOBILE EN ARGENTINE & PRÉVISIONS, PAR RÉGION, 2025-2034 (milliards USD)
  135. TABLE 122 ESTIMATIONS DE TAILLE DU MARCHÉ DES AMÉLIORANTS DE L'INDICE DE VISCOSITÉ AUTOMOBILE EN RESTE DE L'AMÉRIQUE DU SUD & PRÉVISIONS, PAR APPLICATION, 2025-2034 (milliards USD)
  136. TABLE 123 ESTIMATIONS DE TAILLE DU MARCHÉ DES AMÉLIORANTS DE L'INDICE DE VISCOSITÉ AUTOMOBILE EN RESTE DE L'AMÉRIQUE DU SUD & PRÉVISIONS, PAR TYPE DE PRODUIT, 2025-2034 (milliards USD)
  137. TABLE 124 ESTIMATIONS DE TAILLE DU MARCHÉ DES AMÉLIORANTS DE L'INDICE DE VISCOSITÉ AUTOMOBILE EN RESTE DE L'AMÉRIQUE DU SUD & PRÉVISIONS, PAR GRADE DE VISCOSITÉ, 2025-2034 (milliards USD)
  138. TABLE 125 ESTIMATIONS DE TAILLE DU MARCHÉ DES AMÉLIORANTS DE L'INDICE DE VISCOSITÉ AUTOMOBILE EN RESTE DE L'AMÉRIQUE DU SUD & PRÉVISIONS, PAR UTILISATION FINALE, 2025-2034 (milliards USD)
  139. TABLE 126 ESTIMATIONS DE TAILLE DU MARCHÉ DES AMÉLIORANTS DE L'INDICE DE VISCOSITÉ AUTOMOBILE EN RESTE DE L'AMÉRIQUE DU SUD & PRÉVISIONS, PAR RÉGION, 2025-2034 (milliards USD)
  140. TABLE 127 ESTIMATIONS DE TAILLE DU MARCHÉ DES AMÉLIORANTS DE L'INDICE DE VISCOSITÉ AUTOMOBILE EN MEA & PRÉVISIONS, PAR APPLICATION, 2025-2034 (milliards USD)
  141. TABLE 128 ESTIMATIONS DE TAILLE DU MARCHÉ DES AMÉLIORANTS DE L'INDICE DE VISCOSITÉ AUTOMOBILE EN MEA & PRÉVISIONS, PAR TYPE DE PRODUIT, 2025-2034 (milliards USD)
  142. TABLE 129 ESTIMATIONS DE TAILLE DU MARCHÉ DES AMÉLIORANTS DE L'INDICE DE VISCOSITÉ AUTOMOBILE EN MEA & PRÉVISIONS, PAR GRADE DE VISCOSITÉ, 2025-2034 (milliards USD)
  143. TABLE 130 ESTIMATIONS DE TAILLE DU MARCHÉ DES AMÉLIORANTS DE L'INDICE DE VISCOSITÉ AUTOMOBILE EN MEA & PRÉVISIONS, PAR UTILISATION FINALE, 2025-2034 (milliards USD)
  144. TABLE 131 ESTIMATIONS DE TAILLE DU MARCHÉ DES AMÉLIORANTS DE L'INDICE DE VISCOSITÉ AUTOMOBILE EN MEA & PRÉVISIONS, PAR RÉGION, 2025-2034 (milliards USD)
  145. TABLE 132 ESTIMATIONS DE TAILLE DU MARCHÉ DES AMÉLIORANTS DE L'INDICE DE VISCOSITÉ AUTOMOBILE EN PAYS DU CCG & PRÉVISIONS, PAR APPLICATION, 2025-2034 (milliards USD)
  146. TABLE 133 ESTIMATIONS DE TAILLE DU MARCHÉ DES AMÉLIORANTS DE L'INDICE DE VISCOSITÉ AUTOMOBILE EN PAYS DU CCG & PRÉVISIONS, PAR TYPE DE PRODUIT, 2025-2034 (milliards USD)
  147. TABLE 134 ESTIMATIONS DE TAILLE DU MARCHÉ DES AMÉLIORANTS DE L'INDICE DE VISCOSITÉ AUTOMOBILE EN PAYS DU CCG & PRÉVISIONS, PAR GRADE DE VISCOSITÉ, 2025-2034 (milliards USD)
  148. TABLE 135 ESTIMATIONS DE TAILLE DU MARCHÉ DES AMÉLIORANTS DE L'INDICE DE VISCOSITÉ AUTOMOBILE EN PAYS DU CCG & PRÉVISIONS, PAR UTILISATION FINALE, 2025-2034 (milliards USD)
  149. TABLE 136 ESTIMATIONS DE TAILLE DU MARCHÉ DES AMÉLIORANTS DE L'INDICE DE VISCOSITÉ AUTOMOBILE EN PAYS DU CCG & PRÉVISIONS, PAR RÉGION, 2025-2034 (milliards USD)
  150. TABLE 137 ESTIMATIONS DE TAILLE DU MARCHÉ DES AMÉLIORANTS DE L'INDICE DE VISCOSITÉ AUTOMOBILE EN AFRIQUE DU SUD & PRÉVISIONS, PAR APPLICATION, 2025-2034 (milliards USD)
  151. TABLE 138 ESTIMATIONS DE TAILLE DU MARCHÉ DES AMÉLIORANTS DE L'INDICE DE VISCOSITÉ AUTOMOBILE EN AFRIQUE DU SUD & PRÉVISIONS, PAR TYPE DE PRODUIT, 2025-2034 (milliards USD)
  152. TABLE 139 ESTIMATIONS DE TAILLE DU MARCHÉ DES AMÉLIORANTS DE L'INDICE DE VISCOSITÉ AUTOMOBILE EN AFRIQUE DU SUD & PRÉVISIONS, PAR GRADE DE VISCOSITÉ, 2025-2034 (milliards USD)
  153. TABLE 140 ESTIMATIONS DE TAILLE DU MARCHÉ DES AMÉLIORANTS DE L'INDICE DE VISCOSITÉ AUTOMOBILE EN AFRIQUE DU SUD & PRÉVISIONS, PAR UTILISATION FINALE, 2025-2034 (milliards USD)
  154. TABLE 141 ESTIMATIONS DE TAILLE DU MARCHÉ DES AMÉLIORANTS DE L'INDICE DE VISCOSITÉ AUTOMOBILE EN AFRIQUE DU SUD & PRÉVISIONS, PAR RÉGION, 2025-2034 (milliards USD)
  155. TABLE 142 ESTIMATIONS DE TAILLE DU MARCHÉ DES AMÉLIORANTS DE L'INDICE DE VISCOSITÉ AUTOMOBILE EN RESTE DE LA MEA & PRÉVISIONS, PAR APPLICATION, 2025-2034 (milliards USD)
  156. TABLE 143 ESTIMATIONS DE TAILLE DU MARCHÉ DES AMÉLIORANTS DE L'INDICE DE VISCOSITÉ AUTOMOBILE EN RESTE DE LA MEA & PRÉVISIONS, PAR TYPE DE PRODUIT, 2025-2034 (milliards USD)
  157. TABLE 144 ESTIMATIONS DE TAILLE DU MARCHÉ DES AMÉLIORANTS DE L'INDICE DE VISCOSITÉ AUTOMOBILE EN RESTE DE LA MEA & PRÉVISIONS, PAR GRADE DE VISCOSITÉ, 2025-2034 (milliards USD)
  158. TABLE 145 ESTIMATIONS DE TAILLE DU MARCHÉ DES AMÉLIORANTS DE L'INDICE DE VISCOSITÉ AUTOMOBILE EN RESTE DE LA MEA & PRÉVISIONS, PAR UTILISATION FINALE, 2025-2034 (milliards USD)
  159. TABLE 146 ESTIMATIONS DE TAILLE DU MARCHÉ DES AMÉLIORANTS DE L'INDICE DE VISCOSITÉ AUTOMOBILE EN RESTE DE LA MEA & PRÉVISIONS, PAR RÉGION, 2025-2034 (milliards USD)
  160. TABLE 147 LANCEMENT DE PRODUIT / DÉVELOPPEMENT / APPROBATION
  161. TABLE 148 ACQUISITION / PARTENARIAT
    1. LISTE
  162. FIGURE 1 SYNOPSIS DU MARCHÉ
  163. FIGURE 2 ANALYSE DU MARCHÉ DES AMÉLIORANTS DE L'INDICE DE VISCOSITÉ AUTOMOBILE EN AMÉRIQUE DU NORD
  164. FIGURE 3 ANALYSE DU MARCHÉ DES AMÉLIORANTS DE L'INDICE DE VISCOSITÉ AUTOMOBILE AUX ÉTATS-UNIS PAR APPLICATION
  165. FIGURE 4 ANALYSE DU MARCHÉ DES AMÉLIORANTS DE L'INDICE DE VISCOSITÉ AUTOMOBILE AUX ÉTATS-UNIS PAR TYPE DE PRODUIT
  166. FIGURE 5 ANALYSE DU MARCHÉ DES AMÉLIORANTS DE L'INDICE DE VISCOSITÉ AUTOMOBILE AUX ÉTATS-UNIS PAR GRADE DE VISCOSITÉ
  167. FIGURE 6 ANALYSE DU MARCHÉ DES AMÉLIORANTS DE L'INDICE DE VISCOSITÉ AUTOMOBILE AUX ÉTATS-UNIS PAR UTILISATION FINALE
  168. FIGURE 7 ANALYSE DU MARCHÉ DES AMÉLIORANTS DE L'INDICE DE VISCOSITÉ AUTOMOBILE AUX ÉTATS-UNIS PAR RÉGION
  169. FIGURE 8 ANALYSE DU MARCHÉ DES AMÉLIORANTS DE L'INDICE DE VISCOSITÉ AUTOMOBILE AU CANADA PAR APPLICATION
  170. FIGURE 9 ANALYSE DU MARCHÉ DES AMÉLIORANTS DE L'INDICE DE VISCOSITÉ AUTOMOBILE AU CANADA PAR TYPE DE PRODUIT
  171. FIGURE 10 ANALYSE DU MARCHÉ DES AMÉLIORANTS DE L'INDICE DE VISCOSITÉ AUTOMOBILE AU CANADA PAR GRADE DE VISCOSITÉ
  172. FIGURE 11 ANALYSE DU MARCHÉ DES AMÉLIORANTS DE L'INDICE DE VISCOSITÉ AUTOMOBILE AU CANADA PAR UTILISATION FINALE
  173. FIGURE 12 ANALYSE DU MARCHÉ DES AMÉLIORANTS DE L'INDICE DE VISCOSITÉ AUTOMOBILE AU CANADA PAR RÉGION
  174. FIGURE 13 ANALYSE DU MARCHÉ DES AMÉLIORANTS DE L'INDICE DE VISCOSITÉ AUTOMOBILE EN EUROPE
  175. FIGURE 14 ANALYSE DU MARCHÉ DES AMÉLIORANTS DE L'INDICE DE VISCOSITÉ AUTOMOBILE EN ALLEMAGNE PAR APPLICATION
  176. FIGURE 15 ANALYSE DU MARCHÉ DES AMÉLIORANTS DE L'INDICE DE VISCOSITÉ AUTOMOBILE EN ALLEMAGNE PAR TYPE DE PRODUIT
  177. FIGURE 16 ANALYSE DU MARCHÉ DES AMÉLIORANTS DE L'INDICE DE VISCOSITÉ AUTOMOBILE EN ALLEMAGNE PAR GRADE DE VISCOSITÉ
  178. FIGURE 17 ANALYSE DU MARCHÉ DES AMÉLIORANTS DE L'INDICE DE VISCOSITÉ AUTOMOBILE EN ALLEMAGNE PAR UTILISATION FINALE
  179. FIGURE 18 ANALYSE DU MARCHÉ DES AMÉLIORANTS DE L'INDICE DE VISCOSITÉ AUTOMOBILE EN ALLEMAGNE PAR RÉGION
  180. FIGURE 19 ANALYSE DU MARCHÉ DES AMÉLIORANTS DE L'INDICE DE VISCOSITÉ AUTOMOBILE AU ROYAUME-UNI PAR APPLICATION
  181. FIGURE 20 ANALYSE DU MARCHÉ DES AMÉLIORANTS DE L'INDICE DE VISCOSITÉ AUTOMOBILE AU ROYAUME-UNI PAR TYPE DE PRODUIT
  182. FIGURE 21 ANALYSE DU MARCHÉ DES AMÉLIORANTS DE L'INDICE DE VISCOSITÉ AUTOMOBILE AU ROYAUME-UNI PAR GRADE DE VISCOSITÉ
  183. FIGURE 22 ANALYSE DU MARCHÉ DES AMÉLIORANTS DE L'INDICE DE VISCOSITÉ AUTOMOBILE AU ROYAUME-UNI PAR UTILISATION FINALE
  184. FIGURE 23 ANALYSE DU MARCHÉ DES AMÉLIORANTS DE L'INDICE DE VISCOSITÉ AUTOMOBILE AU ROYAUME-UNI PAR RÉGION
  185. FIGURE 24 ANALYSE DU MARCHÉ DES AMÉLIORANTS DE L'INDICE DE VISCOSITÉ AUTOMOBILE EN FRANCE PAR APPLICATION
  186. FIGURE 25 ANALYSE DU MARCHÉ DES AMÉLIORANTS DE L'INDICE DE VISCOSITÉ AUTOMOBILE EN FRANCE PAR TYPE DE PRODUIT
  187. FIGURE 26 ANALYSE DU MARCHÉ DES AMÉLIORANTS DE L'INDICE DE VISCOSITÉ AUTOMOBILE EN FRANCE PAR GRADE DE VISCOSITÉ
  188. FIGURE 27 ANALYSE DU MARCHÉ DES AMÉLIORANTS DE L'INDICE DE VISCOSITÉ AUTOMOBILE EN FRANCE PAR UTILISATION FINALE
  189. FIGURE 28 ANALYSE DU MARCHÉ DES AMÉLIORANTS DE L'INDICE DE VISCOSITÉ AUTOMOBILE EN FRANCE PAR RÉGION
  190. FIGURE 29 ANALYSE DU MARCHÉ DES AMÉLIORANTS DE L'INDICE DE VISCOSITÉ AUTOMOBILE EN RUSSIE PAR APPLICATION
  191. FIGURE 30 ANALYSE DU MARCHÉ DES AMÉLIORANTS DE L'INDICE DE VISCOSITÉ AUTOMOBILE EN RUSSIE PAR TYPE DE PRODUIT
  192. FIGURE 31 ANALYSE DU MARCHÉ DES AMÉLIORANTS DE L'INDICE DE VISCOSITÉ AUTOMOBILE EN RUSSIE PAR GRADE DE VISCOSITÉ
  193. FIGURE 32 ANALYSE DU MARCHÉ DES AMÉLIORANTS DE L'INDICE DE VISCOSITÉ AUTOMOBILE EN RUSSIE PAR UTILISATION FINALE
  194. FIGURE 33 ANALYSE DU MARCHÉ DES AMÉLIORANTS DE L'INDICE DE VISCOSITÉ AUTOMOBILE EN RUSSIE PAR RÉGION
  195. FIGURE 34 ANALYSE DU MARCHÉ DES AMÉLIORANTS DE L'INDICE DE VISCOSITÉ AUTOMOBILE EN ITALIE PAR APPLICATION
  196. FIGURE 35 ANALYSE DU MARCHÉ DES AMÉLIORANTS DE L'INDICE DE VISCOSITÉ AUTOMOBILE EN ITALIE PAR TYPE DE PRODUIT
  197. FIGURE 36 ANALYSE DU MARCHÉ DES AMÉLIORANTS DE L'INDICE DE VISCOSITÉ AUTOMOBILE EN ITALIE PAR GRADE DE VISCOSITÉ
  198. FIGURE 37 ANALYSE DU MARCHÉ DES AMÉLIORANTS DE L'INDICE DE VISCOSITÉ AUTOMOBILE EN ITALIE PAR UTILISATION FINALE
  199. FIGURE 38 ANALYSE DU MARCHÉ DES AMÉLIORANTS DE L'INDICE DE VISCOSITÉ AUTOMOBILE EN ITALIE PAR RÉGION
  200. FIGURE 39 ANALYSE DU MARCHÉ DES AMÉLIORANTS DE L'INDICE DE VISCOSITÉ AUTOMOBILE EN ESPAGNE PAR APPLICATION
  201. FIGURE 40 ANALYSE DU MARCHÉ DES AMÉLIORANTS DE L'INDICE DE VISCOSITÉ AUTOMOBILE EN ESPAGNE PAR TYPE DE PRODUIT
  202. FIGURE 41 ANALYSE DU MARCHÉ DES AMÉLIORANTS DE L'INDICE DE VISCOSITÉ AUTOMOBILE EN ESPAGNE PAR GRADE DE VISCOSITÉ
  203. FIGURE 42 ANALYSE DU MARCHÉ DES AMÉLIORANTS DE L'INDICE DE VISCOSITÉ AUTOMOBILE EN ESPAGNE PAR UTILISATION FINALE
  204. FIGURE 43 ANALYSE DU MARCHÉ DES AMÉLIORANTS DE L'INDICE DE VISCOSITÉ AUTOMOBILE EN ESPAGNE PAR RÉGION
  205. FIGURE 44 ANALYSE DU MARCHÉ DES AMÉLIORANTS DE L'INDICE DE VISCOSITÉ AUTOMOBILE EN RESTE DE L'EUROPE PAR APPLICATION
  206. FIGURE 45 ANALYSE DU MARCHÉ DES AMÉLIORANTS DE L'INDICE DE VISCOSITÉ AUTOMOBILE EN RESTE DE L'EUROPE PAR TYPE DE PRODUIT
  207. FIGURE 46 ANALYSE DU MARCHÉ DES AMÉLIORANTS DE L'INDICE DE VISCOSITÉ AUTOMOBILE EN RESTE DE L'EUROPE PAR GRADE DE VISCOSITÉ
  208. FIGURE 47 ANALYSE DU MARCHÉ DES AMÉLIORANTS DE L'INDICE DE VISCOSITÉ AUTOMOBILE EN RESTE DE L'EUROPE PAR UTILISATION FINALE
  209. FIGURE 48 ANALYSE DU MARCHÉ DES AMÉLIORANTS DE L'INDICE DE VISCOSITÉ AUTOMOBILE EN RESTE DE L'EUROPE PAR RÉGION
  210. FIGURE 49 ANALYSE DU MARCHÉ DES AMÉLIORANTS DE L'INDICE DE VISCOSITÉ AUTOMOBILE EN APAC
  211. FIGURE 50 ANALYSE DU MARCHÉ DES AMÉLIORANTS DE L'INDICE DE VISCOSITÉ AUTOMOBILE EN CHINE PAR APPLICATION
  212. FIGURE 51 ANALYSE DU MARCHÉ DES AMÉLIORANTS DE L'INDICE DE VISCOSITÉ AUTOMOBILE EN CHINE PAR TYPE DE PRODUIT
  213. FIGURE 52 ANALYSE DU MARCHÉ DES AMÉLIORANTS DE L'INDICE DE VISCOSITÉ AUTOMOBILE EN CHINE PAR GRADE DE VISCOSITÉ
  214. FIGURE 53 ANALYSE DU MARCHÉ DES AMÉLIORANTS DE L'INDICE DE VISCOSITÉ AUTOMOBILE EN CHINE PAR UTILISATION FINALE
  215. FIGURE 54 ANALYSE DU MARCHÉ DES AMÉLIORANTS DE L'INDICE DE VISCOSITÉ AUTOMOBILE EN CHINE PAR RÉGION
  216. FIGURE 55 ANALYSE DU MARCHÉ DES AMÉLIORANTS DE L'INDICE DE VISCOSITÉ AUTOMOBILE EN INDE PAR APPLICATION
  217. FIGURE 56 ANALYSE DU MARCHÉ DES AMÉLIORANTS DE L'INDICE DE VISCOSITÉ AUTOMOBILE EN INDE PAR TYPE DE PRODUIT
  218. FIGURE 57 ANALYSE DU MARCHÉ DES AMÉLIORANTS DE L'INDICE DE VISCOSITÉ AUTOMOBILE EN INDE PAR GRADE DE VISCOSITÉ
  219. FIGURE 58 ANALYSE DU MARCHÉ DES AMÉLIORANTS DE L'INDICE DE VISCOSITÉ AUTOMOBILE EN INDE PAR UTILISATION FINALE
  220. FIGURE 59 ANALYSE DU MARCHÉ DES AMÉLIORANTS DE L'INDICE DE VISCOSITÉ AUTOMOBILE EN INDE PAR RÉGION
  221. FIGURE 60 ANALYSE DU MARCHÉ DES AMÉLIORANTS DE L'INDICE DE VISCOSITÉ AUTOMOBILE AU JAPON PAR APPLICATION
  222. FIGURE 61 ANALYSE DU MARCHÉ DES AMÉLIORANTS DE L'INDICE DE VISCOSITÉ AUTOMOBILE AU JAPON PAR TYPE DE PRODUIT
  223. FIGURE 62 ANALYSE DU MARCHÉ DES AMÉLIORANTS DE L'INDICE DE VISCOSITÉ AUTOMOBILE AU JAPON PAR GRADE DE VISCOSITÉ
  224. FIGURE 63 ANALYSE DU MARCHÉ DES AMÉLIORANTS DE L'INDICE DE VISCOSITÉ AUTOMOBILE AU JAPON PAR UTILISATION FINALE
  225. FIGURE 64 ANALYSE DU MARCHÉ DES AMÉLIORANTS DE L'INDICE DE VISCOSITÉ AUTOMOBILE AU JAPON PAR RÉGION
  226. FIGURE 65 ANALYSE DU MARCHÉ DES AMÉLIORANTS DE L'INDICE DE VISCOSITÉ AUTOMOBILE EN CORÉE DU SUD PAR APPLICATION
  227. FIGURE 66 ANALYSE DU MARCHÉ DES AMÉLIORANTS DE L'INDICE DE VISCOSITÉ AUTOMOBILE EN CORÉE DU SUD PAR TYPE DE PRODUIT
  228. FIGURE 67 ANALYSE DU MARCHÉ DES AMÉLIORANTS DE L'INDICE DE VISCOSITÉ AUTOMOBILE EN CORÉE DU SUD PAR GRADE DE VISCOSITÉ
  229. FIGURE 68 ANALYSE DU MARCHÉ DES AMÉLIORANTS DE L'INDICE DE VISCOSITÉ AUTOMOBILE EN CORÉE DU SUD PAR UTILISATION FINALE
  230. FIGURE 69 ANALYSE DU MARCHÉ DES AMÉLIORANTS DE L'INDICE DE VISCOSITÉ AUTOMOBILE EN CORÉE DU SUD PAR RÉGION
  231. FIGURE 70 ANALYSE DU MARCHÉ DES AMÉLIORANTS DE L'INDICE DE VISCOSITÉ AUTOMOBILE EN MALAYSIE PAR APPLICATION
  232. FIGURE 71 ANALYSE DU MARCHÉ DES AMÉLIORANTS DE L'INDICE DE VISCOSITÉ AUTOMOBILE EN MALAYSIE PAR TYPE DE PRODUIT
  233. FIGURE 72 ANALYSE DU MARCHÉ DES AMÉLIORANTS DE L'INDICE DE VISCOSITÉ AUTOMOBILE EN MALAYSIE PAR GRADE DE VISCOSITÉ
  234. FIGURE 73 ANALYSE DU MARCHÉ DES AMÉLIORANTS DE L'INDICE DE VISCOSITÉ AUTOMOBILE EN MALAYSIE PAR UTILISATION FINALE
  235. FIGURE 74 ANALYSE DU MARCHÉ DES AMÉLIORANTS DE L'INDICE DE VISCOSITÉ AUTOMOBILE EN MALAYSIE PAR RÉGION
  236. FIGURE 75 ANALYSE DU MARCHÉ DES AMÉLIORANTS DE L'INDICE DE VISCOSITÉ AUTOMOBILE EN THAÏLANDE PAR APPLICATION
  237. FIGURE 76 ANALYSE DU MARCHÉ DES AMÉLIORANTS DE L'INDICE DE VISCOSITÉ AUTOMOBILE EN THAÏLANDE PAR TYPE DE PRODUIT
  238. FIGURE 77 ANALYSE DU MARCHÉ DES AMÉLIORANTS DE L'INDICE DE VISCOSITÉ AUTOMOBILE EN THAÏLANDE PAR GRADE DE VISCOSITÉ
  239. FIGURE 78 ANALYSE DU MARCHÉ DES AMÉLIORANTS DE L'INDICE DE VISCOSITÉ AUTOMOBILE EN THAÏLANDE PAR UTILISATION FINALE
  240. FIGURE 79 ANALYSE DU MARCHÉ DES AMÉLIORANTS DE L'INDICE DE VISCOSITÉ AUTOMOBILE EN THAÏLANDE PAR RÉGION
  241. FIGURE 80 ANALYSE DU MARCHÉ DES AMÉLIORANTS DE L'INDICE DE VISCOSITÉ AUTOMOBILE EN INDONÉSIE PAR APPLICATION
  242. FIGURE 81 ANALYSE DU MARCHÉ DES AMÉLIORANTS DE L'INDICE DE VISCOSITÉ AUTOMOBILE EN INDONÉSIE PAR TYPE DE PRODUIT
  243. FIGURE 82 ANALYSE DU MARCHÉ DES AMÉLIORANTS DE L'INDICE DE VISCOSITÉ AUTOMOBILE EN INDONÉSIE PAR GRADE DE VISCOSITÉ
  244. FIGURE 83 ANALYSE DU MARCHÉ DES AMÉLIORANTS DE L'INDICE DE VISCOSITÉ AUTOMOBILE EN INDONÉSIE PAR UTILISATION FINALE
  245. FIGURE 84 ANALYSE DU MARCHÉ DES AMÉLIORANTS DE L'INDICE DE VISCOSITÉ AUTOMOBILE EN INDONÉSIE PAR RÉGION
  246. FIGURE 85 ANALYSE DU MARCHÉ DES AMÉLIORANTS DE L'INDICE DE VISCOSITÉ AUTOMOBILE EN RESTE DE L'APAC PAR APPLICATION
  247. FIGURE 86 ANALYSE DU MARCHÉ DES AMÉLIORANTS DE L'INDICE DE VISCOSITÉ AUTOMOBILE EN RESTE DE L'APAC PAR TYPE DE PRODUIT
  248. FIGURE 87 ANALYSE DU MARCHÉ DES AMÉLIORANTS DE L'INDICE DE VISCOSITÉ AUTOMOBILE EN RESTE DE L'APAC PAR GRADE DE VISCOSITÉ
  249. FIGURE 88 ANALYSE DU MARCHÉ DES AMÉLIORANTS DE L'INDICE DE VISCOSITÉ AUTOMOBILE EN RESTE DE L'APAC PAR UTILISATION FINALE
  250. FIGURE 89 ANALYSE DU MARCHÉ DES AMÉLIORANTS DE L'INDICE DE VISCOSITÉ AUTOMOBILE EN RESTE DE L'APAC PAR RÉGION
  251. FIGURE 90 ANALYSE DU MARCHÉ DES AMÉLIORANTS DE L'INDICE DE VISCOSITÉ AUTOMOBILE EN AMÉRIQUE DU SUD
  252. FIGURE 91 ANALYSE DU MARCHÉ DES AMÉLIORANTS DE L'INDICE DE VISCOSITÉ AUTOMOBILE AU BRÉSIL PAR APPLICATION
  253. FIGURE 92 ANALYSE DU MARCHÉ DES AMÉLIORANTS DE L'INDICE DE VISCOSITÉ AUTOMOBILE AU BRÉSIL PAR TYPE DE PRODUIT
  254. FIGURE 93 ANALYSE DU MARCHÉ DES AMÉLIORANTS DE L'INDICE DE VISCOSITÉ AUTOMOBILE AU BRÉSIL PAR GRADE DE VISCOSITÉ
  255. FIGURE 94 ANALYSE DU MARCHÉ DES AMÉLIORANTS DE L'INDICE DE VISCOSITÉ AUTOMOBILE AU BRÉSIL PAR UTILISATION FINALE
  256. FIGURE 95 ANALYSE DU MARCHÉ DES AMÉLIORANTS DE L'INDICE DE VISCOSITÉ AUTOMOBILE AU BRÉSIL PAR RÉGION
  257. FIGURE 96 ANALYSE DU MARCHÉ DES AMÉLIORANTS DE L'INDICE DE VISCOSITÉ AUTOMOBILE AU MEXIQUE PAR APPLICATION
  258. FIGURE 97 ANALYSE DU MARCHÉ DES AMÉLIORANTS DE L'INDICE DE VISCOSITÉ AUTOMOBILE AU MEXIQUE PAR TYPE DE PRODUIT
  259. FIGURE 98 ANALYSE DU MARCHÉ DES AMÉLIORANTS DE L'INDICE DE VISCOSITÉ AUTOMOBILE AU MEXIQUE PAR GRADE DE VISCOSITÉ
  260. FIGURE 99 ANALYSE DU MARCHÉ DES AMÉLIORANTS DE L'INDICE DE VISCOSITÉ AUTOMOBILE AU MEXIQUE PAR UTILISATION FINALE
  261. FIGURE 100 ANALYSE DU MARCHÉ DES AMÉLIORANTS DE L'INDICE DE VISCOSITÉ AUTOMOBILE AU MEXIQUE PAR RÉGION
  262. FIGURE 101 ANALYSE DU MARCHÉ DES AMÉLIORANTS DE L'INDICE DE VISCOSITÉ AUTOMOBILE EN ARGENTINE PAR APPLICATION
  263. FIGURE 102 ANALYSE DU MARCHÉ DES AMÉLIORANTS DE L'INDICE DE VISCOSITÉ AUTOMOBILE EN ARGENTINE PAR TYPE DE PRODUIT
  264. FIGURE 103 ANALYSE DU MARCHÉ DES AMÉLIORANTS DE L'INDICE DE VISCOSITÉ AUTOMOBILE EN ARGENTINE PAR GRADE DE VISCOSITÉ
  265. FIGURE 104 ANALYSE DU MARCHÉ DES AMÉLIORANTS DE L'INDICE DE VISCOSITÉ AUTOMOBILE EN ARGENTINE PAR UTILISATION FINALE
  266. FIGURE 105 ANALYSE DU MARCHÉ DES AMÉLIORANTS DE L'INDICE DE VISCOSITÉ AUTOMOBILE EN ARGENTINE PAR RÉGION
  267. FIGURE 106 ANALYSE DU MARCHÉ DES AMÉLIORANTS DE L'INDICE DE VISCOSITÉ AUTOMOBILE EN RESTE DE L'AMÉRIQUE DU S

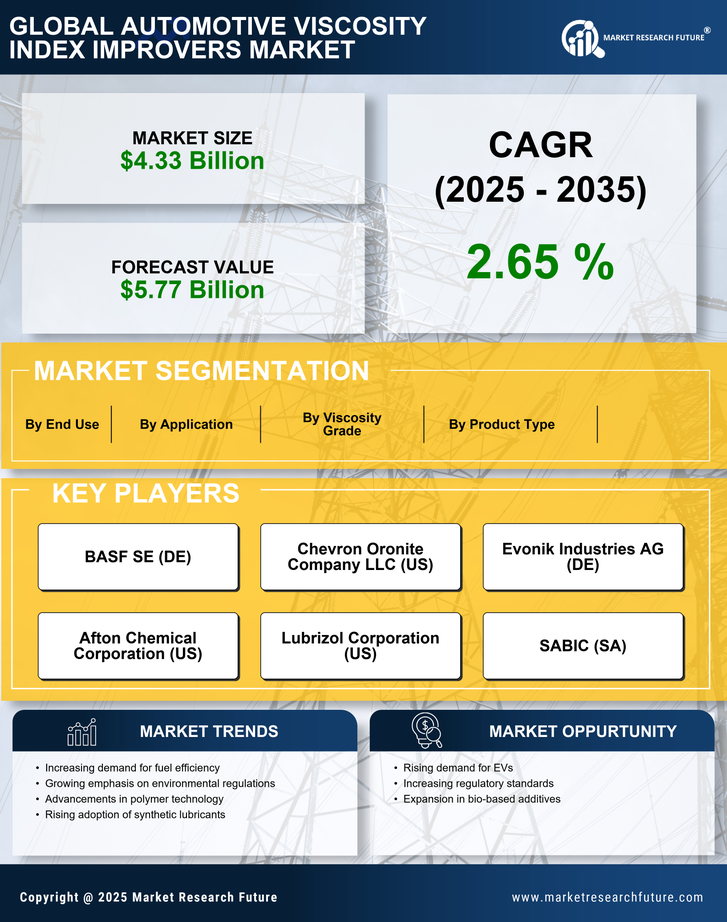
Segmentation du marché des améliorants de l'indice de viscosité automobile

Marché des améliorants d'indice de viscosité automobile par application (en milliards USD, 2019-2032)

  • Véhicules de tourisme

  • Véhicules commerciaux

  • Motos

  • Véhicules lourds


Marché des améliorants d'indice de viscosité automobile par type de produit (en milliards USD, 2019-2032)

  • Polyalphaoléfines

  • Polyisobutylènes

  • Polymères acryliques

  • Copolymères éthylène-propylène


Marché des améliorants d'indice de viscosité automobile par niveau de viscosité (en milliards USD, 2019-2032)

  • Faible viscosité

  • Viscosité moyenne

  • Haute viscosité


Marché des améliorants d'indice de viscosité automobile par utilisation finale (en milliards USD, 2019-2032)

  • Industrie automobile

  • Applications industrielles

  • Machines agricoles


Marché des améliorants de l'indice de viscosité automobile par région (en milliards USD, 2019-2032)

  • Amérique du Nord

  • Europe

  • Amérique du Sud

  • Asie-Pacifique

  • Moyen-Orient et Afrique

Perspectives régionales du marché des améliorants de l'indice de viscosité automobile (en milliards USD, 2019-2032)


  • Perspectives de l'Amérique du Nord (milliards USD, 2019-2032)

    • Marché des améliorants d'indice de viscosité automobile en Amérique du Nord par type d'application

      • Véhicules de tourisme

      • Véhicules commerciaux

      • Motos

      • Véhicules lourds

    • Marché des améliorants d'indice de viscosité automobile en Amérique du Nord par type de produit

      • Polyalphaoléfines

      • Polyisobutylènes

      • Polymères acryliques

      • Copolymères éthylène-propylène

    • Marché des améliorants d'indice de viscosité automobile en Amérique du Nord par type de grade de viscosité

      • Faible viscosité

      • Viscosité moyenne

      • Haute viscosité

    • Marché des améliorants d'indice de viscosité automobile en Amérique du Nord par type d'utilisation finale

      • Industrie automobile

      • Applications industrielles

      • Machines agricoles

    • Marché des améliorants d’indice de viscosité automobile en Amérique du Nord par type régional

      • États-Unis

      • Canada

    • Perspectives des États-Unis (milliards USD, 2019-2032)

    • Marché américain des améliorants d'indice de viscosité automobile par type d'application

      • Véhicules de tourisme

      • Véhicules commerciaux

      • Motos

      • Véhicules lourds

    • Marché américain des améliorants d'indice de viscosité automobile par type de produit

      • Polyalphaoléfines

      • Polyisobutylènes

      • Polymères acryliques

      • Copolymères éthylène-propylène

    • Marché américain des améliorants d'indice de viscosité automobile par type de grade de viscosité

      • Faible viscosité

      • Viscosité moyenne

      • Haute viscosité

    • Marché américain des améliorants d'indice de viscosité automobile par type d'utilisation finale

      • Industrie automobile

      • Applications industrielles

      • Machines agricoles

    • Perspectives du CANADA (milliards USD, 2019-2032)

    • Marché canadien des améliorants d'indice de viscosité automobile par type d'application

      • Véhicules de tourisme

      • Véhicules commerciaux

      • Motos

      • Véhicules lourds

    • Marché canadien des améliorants d'indice de viscosité automobile par type de produit

      • Polyalphaoléfines

      • Polyisobutylènes

      • Polymères acryliques

      • Copolymères éthylène-propylène

    • Marché canadien des améliorants d'indice de viscosité automobile par type de grade de viscosité

      • Faible viscosité

      • Viscosité moyenne

      • Haute viscosité

    • Marché canadien des améliorants d'indice de viscosité automobile par type d'utilisation finale

      • Industrie automobile

      • Applications industrielles

      • Machines agricoles

  • Perspectives européennes (milliards USD, 2019-2032)

    • Marché européen des améliorants d'indice de viscosité automobile par type d'application

      • Véhicules de tourisme

      • Véhicules commerciaux

      • Motos

      • Véhicules lourds

    • Marché européen des améliorants d'indice de viscosité automobile par type de produit

      • Polyalphaoléfines

      • Polyisobutylènes

      • Polymères acryliques

      • Copolymères éthylène-propylène

    • Marché européen des améliorants d'indice de viscosité automobile par type de grade de viscosité

      • Faible viscosité

      • Viscosité moyenne

      • Haute viscosité

    • Marché européen des améliorants d'indice de viscosité automobile par type d'utilisation finale

      • Industrie automobile

      • Applications industrielles

      • Machines agricoles

    • Marché européen des améliorants d’indice de viscosité automobile par type régional

      • Allemagne

      • Royaume-Uni

      • France

      • Russie

      • Italie

      • Espagne

      • Reste de l'Europe

    • Perspectives de l'ALLEMAGNE (milliards USD, 2019-2032)

    • Marché des améliorants d'indice de viscosité automobile en ALLEMAGNE par type d'application

      • Véhicules de tourisme

      • Véhicules commerciaux

      • Motos

      • Véhicules lourds

    • Marché des améliorants d'indice de viscosité automobile en ALLEMAGNE par type de produit

      • Polyalphaoléfines

      • Polyisobutylènes

      • Polymères acryliques

      • Copolymères éthylène-propylène

    • ALLEMAGNE Marché des améliorants d'indice de viscosité automobile par type de grade de viscosité

      • Faible viscosité

      • Viscosité moyenne

      • Haute viscosité

    • ALLEMAGNE Marché des améliorants d'indice de viscosité automobile par type d'utilisation finale

      • Industrie automobile

      • Applications industrielles

      • Machines agricoles

    • Perspectives du Royaume-Uni (milliards USD, 2019-2032)

    • Marché britannique des améliorants d'indice de viscosité automobile par type d'application

      • Véhicules de tourisme

      • Véhicules commerciaux

      • Motos

      • Véhicules lourds

    • Marché britannique des améliorants d'indice de viscosité automobile par type de produit

      • Polyalphaoléfines

      • Polyisobutylènes

      • Polymères acryliques

      • Copolymères éthylène-propylène

    • Marché britannique des améliorants d'indice de viscosité automobile par type de grade de viscosité

      • Faible viscosité

      • Viscosité moyenne

      • Haute viscosité

    • Marché britannique des améliorants d'indice de viscosité automobile par type d'utilisation finale

      • Industrie automobile

      • Applications industrielles

      • Machines agricoles

    • Perspectives de la FRANCE (en milliards de dollars, 2019-2032)

    • FRANCE Marché des améliorants d'indice de viscosité automobile par type d'application

      • Véhicules de tourisme

      • Véhicules commerciaux

      • Motos

      • Véhicules lourds

    • FRANCE Marché des améliorants d'indice de viscosité automobile par type de produit

      • Polyalphaoléfines

      • Polyisobutylènes

      • Polymères acryliques

      • Copolymères éthylène-propylène

    • FRANCE Marché des améliorants d'indice de viscosité automobile par type de grade de viscosité

      • Faible viscosité

      • Viscosité moyenne

      • Haute viscosité

    • FRANCE Marché des améliorants d'indice de viscosité automobile par type d'utilisation finale

      • Industrie automobile

      • Applications industrielles

      • Machines agricoles

    • Perspectives de la RUSSIE (milliards USD, 2019-2032)

    • Marché des améliorants d'indice de viscosité automobile en RUSSIE par type d'application

      • Véhicules de tourisme

      • Véhicules commerciaux

      • Motos

      • Véhicules lourds

    • Marché des améliorants d'indice de viscosité automobile en RUSSIE par type de produit

      • Polyalphaoléfines

      • Polyisobutylènes

      • Polymères acryliques

      • Copolymères éthylène-propylène

    • Marché des améliorants d'indice de viscosité automobile en RUSSIE par type de grade de viscosité

      • Faible viscosité

      • Viscosité moyenne

      • Haute viscosité

    • Marché des améliorants d'indice de viscosité automobile en RUSSIE par type d'utilisation finale

      • Industrie automobile

      • Applications industrielles

      • Machines agricoles

    • Perspectives de l'ITALIE (milliards USD, 2019-2032)

    • ITALIE Marché des améliorants d’indice de viscosité automobile par type d’application

      • Véhicules de tourisme

      • Véhicules commerciaux

      • Motos

      • Véhicules lourds

    • Marché des améliorants d'indice de viscosité automobile en ITALIE par type de produit

      • Polyalphaoléfines

      • Polyisobutylènes

      • Polymères acryliques

      • Copolymères éthylène-propylène

    • ITALIE Marché des améliorants d'indice de viscosité automobile par type de grade de viscosité

      • Faible viscosité

      • Viscosité moyenne

      • Haute viscosité

    • ITALIE Marché des améliorants d’indice de viscosité automobile par type d’utilisation finale

      • Industrie automobile

      • Applications industrielles

      • Machines agricoles

    • Perspectives de l'ESPAGNE (milliards USD, 2019-2032)

    • ESPAGNE Marché des améliorants d'indice de viscosité automobile par type d'application

      • Véhicules de tourisme

      • Véhicules commerciaux

      • Motos

      • Véhicules lourds

    • ESPAGNE Marché des améliorants d'indice de viscosité automobile par type de produit

      • Polyalphaoléfines

      • Polyisobutylènes

      • Polymères acryliques

      • Copolymères éthylène-propylène

    • ESPAGNE Marché des améliorants d'indice de viscosité automobile par type de grade de viscosité

      • Faible viscosité

      • Viscosité moyenne

      • Haute viscosité

    • ESPAGNE Marché des améliorants d'indice de viscosité automobile par type d'utilisation finale

      • Industrie automobile

      • Applications industrielles

      • Machines agricoles

    • Perspectives RESTE DE L'EUROPE (milliards USD, 2019-2032)

    • RESTE DE L'EUROPE Marché des améliorants d'indice de viscosité automobile par type d'application

      • Véhicules de tourisme

      • Véhicules commerciaux

      • Motos

      • Véhicules lourds

    • RESTE DE L'EUROPE Marché des améliorants d'indice de viscosité automobile par type de produit

      • Polyalphaoléfines

      • Polyisobutylènes

      • Polymères acryliques

      • Copolymères éthylène-propylène

    • RESTE DE L'EUROPE Marché des améliorants d'indice de viscosité automobile par type de grade de viscosité

      • Faible viscosité

      • Viscosité moyenne

      • Haute viscosité

    • RESTE DE L'EUROPE Marché des améliorants d'indice de viscosité automobile par type d'utilisation finale

      • Industrie automobile

      • Applications industrielles

      • Machines agricoles

  • Perspectives APAC (milliards USD, 2019-2032)

    • Marché des améliorateurs de l'indice de viscosité automobile APAC par type d'application

      • Véhicules de tourisme

      • Véhicules commerciaux

      • Motos

      • Véhicules lourds

    • Marché des améliorants d'indice de viscosité automobile APAC par type de produit

      • Polyalphaoléfines

      • Polyisobutylènes

      • Polymères acryliques

      • Copolymères éthylène-propylène

    • Marché des améliorateurs d'indice de viscosité automobile APAC par type de grade de viscosité

      • Faible viscosité

      • Viscosité moyenne

      • Haute viscosité

    • Marché des améliorants d'indice de viscosité automobile APAC par type d'utilisation finale

      • Industrie automobile

      • Applications industrielles

      • Machines agricoles

    • Marché des améliorateurs de l'indice de viscosité automobile APAC par type régional

      • Chine

      • Inde

      • Japon

      • Corée du Sud

      • Malaisie

      • Thaïlande

      • Indonésie

      • Reste de l'APAC

    • Perspectives de la CHINE (milliards USD, 2019-2032)

    • Marché des améliorants d'indice de viscosité automobile en CHINE par type d'application

      • Véhicules de tourisme

      • Véhicules commerciaux

      • Motos

      • Véhicules lourds

    • Marché des améliorants d'indice de viscosité automobile en CHINE par type de produit

      • Polyalphaoléfines

      • Polyisobutylènes

      • Polymères acryliques

      • Copolymères éthylène-propylène

    • Marché des améliorants d'indice de viscosité automobile en CHINE par type de grade de viscosité

      • Faible viscosité

      • Viscosité moyenne

      • Haute viscosité

    • Marché des améliorants d'indice de viscosité automobile en CHINE par type d'utilisation finale

      • Industrie automobile

      • Applications industrielles

      • Machines agricoles

    • Perspectives de l'INDE (milliards USD, 2019-2032)

    • Marché des améliorants d'indice de viscosité automobile en INDE par type d'application

      • Véhicules de tourisme

      • Véhicules commerciaux

      • Motos

      • Véhicules lourds

    • Marché des améliorants d'indice de viscosité automobile en INDE par type de produit

      • Polyalphaoléfines

      • Polyisobutylènes

      • Polymères acryliques

      • Copolymères éthylène-propylène

    • Marché indien des améliorants d'indice de viscosité automobile par type de grade de viscosité

      • Faible viscosité

      • Viscosité moyenne

      • Haute viscosité

    • Marché des améliorants d'indice de viscosité automobile en INDE par type d'utilisation finale

      • Industrie automobile

      • Applications industrielles

      • Machines agricoles

    • Perspectives du JAPON (milliards USD, 2019-2032)

    • Marché des améliorants d'indice de viscosité automobile au JAPON par type d'application

      • Véhicules de tourisme

      • Véhicules commerciaux

      • Motos

      • Véhicules lourds

    • Marché des améliorants d'indice de viscosité automobile au JAPON par type de produit

      • Polyalphaoléfines

      • Polyisobutylènes

      • Polymères acryliques

      • Copolymères éthylène-propylène

    • Marché des améliorants d'indice de viscosité automobile au JAPON par type de grade de viscosité

      • Faible viscosité

      • Viscosité moyenne

      • Haute viscosité

    • Marché des améliorants d'indice de viscosité automobile au JAPON par type d'utilisation finale

      • Industrie automobile

      • Applications industrielles

      • Machines agricoles

    • Perspectives de la CORÉE DU SUD (milliards USD, 2019-2032)

    • Marché des améliorants d'indice de viscosité automobile en CORÉE DU SUD par type d'application

      • Véhicules de tourisme

      • Véhicules commerciaux

      • Motos

      • Véhicules lourds

    • Marché des améliorants d'indice de viscosité automobile en CORÉE DU SUD par type de produit

      • Polyalphaoléfines

      • Polyisobutylènes

      • Polymères acryliques

      • Copolymères éthylène-propylène

    • Marché des améliorants d'indice de viscosité automobile en CORÉE DU SUD par type de grade de viscosité

      • Faible viscosité

      • Viscosité moyenne

      • Haute viscosité

    • Marché des améliorants d'indice de viscosité automobile en CORÉE DU SUD par type d'utilisation finale

      • Industrie automobile

      • Applications industrielles

      • Machines agricoles

    • Perspectives de la MALAISIE (milliards USD, 2019-2032)

    • Marché des améliorants d'indice de viscosité automobile en MALAISIE par type d'application

      • Véhicules de tourisme

      • Véhicules commerciaux

      • Motos

      • Véhicules lourds

    • Marché des améliorants d'indice de viscosité automobile en MALAISIE par type de produit

      • Polyalphaoléfines

      • Polyisobutylènes

      • Polymères acryliques

      • Copolymères éthylène-propylène

    • Marché des améliorants d'indice de viscosité automobile en MALAISIE par type de grade de viscosité

      • Faible viscosité

      • Viscosité moyenne

      • Haute viscosité

    • Marché des améliorants d'indice de viscosité automobile en MALAISIE par type d'utilisation finale

      • Industrie automobile

      • Applications industrielles

      • Machines agricoles

    • Perspectives de la THAÏLANDE (milliards USD, 2019-2032)

    • THAÏLANDE Marché des améliorants d'indice de viscosité automobile par type d'application

      • Véhicules de tourisme

      • Véhicules commerciaux

      • Motos

      • Véhicules lourds

    • THAÏLANDE Marché des améliorants d'indice de viscosité automobile par type de produit

      • Polyalphaoléfines

      • Polyisobutylènes

      • Polymères acryliques

      • Copolymères éthylène-propylène

    • THAÏLANDE Marché des améliorants d'indice de viscosité automobile par type de grade de viscosité

      • Faible viscosité

      • Viscosité moyenne

      • Haute viscosité

    • THAÏLANDE Marché des améliorants d'indice de viscosité automobile par type d'utilisation finale

      • Industrie automobile

      • Applications industrielles

      • Machines agricoles

    • Perspectives de l'INDONÉSIE (milliards USD, 2019-2032)

    • Marché des améliorants d'indice de viscosité automobile en INDONÉSIE par type d'application

      • Véhicules de tourisme

      • Véhicules commerciaux

      • Motos

      • Véhicules lourds

    • Marché des améliorants d'indice de viscosité automobile en INDONÉSIE par type de produit

      • Polyalphaoléfines

      • Polyisobutylènes

      • Polymères acryliques

      • Copolymères éthylène-propylène

    • Marché des améliorants d'indice de viscosité automobile en INDONÉSIE par type de grade de viscosité

      • Faible viscosité

      • Viscosité moyenne

      • Haute viscosité

    • Marché des améliorants d'indice de viscosité automobile en INDONÉSIE par type d'utilisation finale

      • Industrie automobile

      • Applications industrielles

      • Machines agricoles

    • Perspectives RESTE DE L'APAC (milliards USD, 2019-2032)

    • RESTE DE L'APAC Marché des améliorants d'indice de viscosité automobile par type d'application

      • Véhicules de tourisme

      • Véhicules commerciaux

      • Motos

      • Véhicules lourds

    • RESTE DE L'APAC Marché des améliorants d'indice de viscosité automobile par type de produit

      • Polyalphaoléfines

      • Polyisobutylènes

      • Polymères acryliques

      • Copolymères éthylène-propylène

    • RESTE DE L'APAC Marché des améliorants d'indice de viscosité automobile par type de grade de viscosité

      • Faible viscosité

      • Viscosité moyenne

      • Haute viscosité

    • RESTE DE L'APAC Marché des améliorants d'indice de viscosité automobile par type d'utilisation finale

      • Industrie automobile

      • Applications industrielles

      • Machines agricoles

  • Perspectives de l'Amérique du Sud (milliards USD, 2019-2032)

    • Marché des améliorants d’indice de viscosité automobile en Amérique du Sud par type d’application

      • Véhicules de tourisme

      • Véhicules commerciaux

      • Motos

      • Véhicules lourds

    • Marché des améliorants d'indice de viscosité automobile en Amérique du Sud par type de produit

      • Polyalphaoléfines

      • Polyisobutylènes

      • Polymères acryliques

      • Copolymères éthylène-propylène

    • Marché des améliorants d'indice de viscosité automobile en Amérique du Sud par type de grade de viscosité

      • Faible viscosité

      • Viscosité moyenne

      • Haute viscosité

    • Marché des améliorants d'indice de viscosité automobile en Amérique du Sud par type d'utilisation finale

      • Industrie automobile

      • Applications industrielles

      • Machines agricoles

    • Marché des améliorants d’indice de viscosité automobile en Amérique du Sud par type régional

      • Brésil

      • Mexique

      • Argentine

      • Reste de l'Amérique du Sud

    • Perspectives du BRÉSIL (milliards USD, 2019-2032)

    • Marché des améliorants d'indice de viscosité automobile au Brésil par type d'application

      • Véhicules de tourisme

      • Véhicules commerciaux

      • Motos

      • Véhicules lourds

    • Marché des améliorants d'indice de viscosité automobile au Brésil par type de produit

      • Polyalphaoléfines

      • Polyisobutylènes

      • Polymères acryliques

      • Copolymères éthylène-propylène

    • BRÉSIL Marché des améliorants d'indice de viscosité automobile par type de grade de viscosité

      • Faible viscosité

      • Viscosité moyenne

      • Haute viscosité

    • BRÉSIL Marché des améliorants d'indice de viscosité automobile par type d'utilisation finale

      • Industrie automobile

      • Applications industrielles

      • Machines agricoles

    • Perspectives du MEXIQUE (milliards USD, 2019-2032)

    • MEXIQUE Marché des améliorants d’indice de viscosité automobile par type d’application

      • Véhicules de tourisme

      • Véhicules commerciaux

      • Motos

      • Véhicules lourds

    • MEXIQUE Marché des améliorants d'indice de viscosité automobile par type de produit

      • Polyalphaoléfines

      • Polyisobutylènes

      • Polymères acryliques

      • Copolymères éthylène-propylène

    • MEXIQUE Marché des améliorants d'indice de viscosité automobile par type de grade de viscosité

      • Faible viscosité

      • Viscosité moyenne

      • Haute viscosité

    • MEXIQUE Marché des améliorants d’indice de viscosité automobile par type d’utilisation finale

      • Industrie automobile

      • Applications industrielles

      • Machines agricoles

    • Perspectives de l'ARGENTINE (milliards USD, 2019-2032)

    • Marché des améliorants d'indice de viscosité automobile en Argentine par type d'application

      • Véhicules de tourisme

      • Véhicules commerciaux

      • Motos

      • Véhicules lourds

    • Marché des améliorants d'indice de viscosité automobile en Argentine par type de produit

      • Polyalphaoléfines

      • Polyisobutylènes

      • Polymères acryliques

      • Copolymères éthylène-propylène

    • Marché des améliorants d'indice de viscosité automobile en Argentine par type de grade de viscosité

      • Faible viscosité

      • Viscosité moyenne

      • Haute viscosité

    • Marché des améliorants d'indice de viscosité automobile en Argentine par type d'utilisation finale

      • Industrie automobile

      • Applications industrielles

      • Machines agricoles

    • Perspectives du reste de l'Amérique du Sud (en milliards de dollars américains, 2019-2032)

    • RESTE DE L'AMÉRIQUE DU SUD Marché des améliorants d'indice de viscosité automobile par type d'application

      • Véhicules de tourisme

      • Véhicules commerciaux

      • Motos

      • Véhicules lourds

    • RESTE DE L'AMÉRIQUE DU SUD Marché des améliorants d'indice de viscosité automobile par type de produit

      • Polyalphaoléfines

      • Polyisobutylènes

      • Polymères acryliques

      • Copolymères éthylène-propylène

    • RESTE DE L'AMÉRIQUE DU SUD Marché des améliorants d'indice de viscosité automobile par type de grade de viscosité

      • Faible viscosité

      • Viscosité moyenne

      • Haute viscosité

    • RESTE DE L'AMÉRIQUE DU SUD Marché des améliorants d'indice de viscosité automobile par type d'utilisation finale

      • Industrie automobile

      • Applications industrielles

      • Machines agricoles

  • Perspectives MEA (milliards USD, 2019-2032)

    • Marché des améliorants d’indice de viscosité automobile MEA par type d’application

      • Véhicules de tourisme

      • Véhicules commerciaux

      • Motos

      • Véhicules lourds

    • Marché des améliorants d'indice de viscosité automobile MEA par type de produit

      • Polyalphaoléfines

      • Polyisobutylènes

      • Polymères acryliques

      • Copolymères éthylène-propylène

    • Marché des améliorants d'indice de viscosité automobile MEA par type de grade de viscosité

      • Faible viscosité

      • Viscosité moyenne

      • Haute viscosité

    • Marché des améliorants d'indice de viscosité automobile MEA par type d'utilisation finale

      • Industrie automobile

      • Applications industrielles

      • Machines agricoles

    • Marché des améliorants d’indice de viscosité automobile MEA par type régional

      • Pays du CCG

      • Afrique du Sud

      • Reste de la MEA

    • Perspectives des pays du CCG (en milliards de dollars, 2019-2032)

    • Pays du CCG Marché des améliorants d'indice de viscosité automobile par type d'application

      • Véhicules de tourisme

      • Véhicules commerciaux

      • Motos

      • Véhicules lourds

    • Marché des améliorants d'indice de viscosité automobile dans les pays du CCG par type de produit

      • Polyalphaoléfines

      • Polyisobutylènes

      • Polymères acryliques

      • Copolymères éthylène-propylène

    • Pays du CCG Marché des améliorants d'indice de viscosité automobile par type de grade de viscosité

      • Faible viscosité

      • Viscosité moyenne

      • Haute viscosité

    • Pays du CCG Marché des améliorants d'indice de viscosité automobile par type d'utilisation finale

      • Industrie automobile

      • Applications industrielles

      • Machines agricoles

    • Perspectives de l'AFRIQUE DU SUD (milliards USD, 2019-2032)

    • Marché des améliorants d'indice de viscosité automobile en AFRIQUE DU SUD par type d'application

      • Véhicules de tourisme

      • Véhicules commerciaux

      • Motos

      • Véhicules lourds

    • Marché des améliorants d'indice de viscosité automobile en AFRIQUE DU SUD par type de produit

      • Polyalphaoléfines

      • Polyisobutylènes

      • Polymères acryliques

      • Copolymères éthylène-propylène

    • Marché des améliorants d'indice de viscosité automobile en AFRIQUE DU SUD par type de grade de viscosité

      • Faible viscosité

      • Viscosité moyenne

      • Haute viscosité

    • Marché des améliorants d'indice de viscosité automobile en AFRIQUE DU SUD par type d'utilisation finale

      • Industrie automobile

      • Applications industrielles

      • Machines agricoles

    • Perspectives RESTE DES MEA (milliards USD, 2019-2032)

    • RESTE DU MEA Marché des améliorants d’indice de viscosité automobile par type d’application

      • Véhicules de tourisme

      • Véhicules commerciaux

      • Motos

      • Véhicules lourds

    • RESTE DU MEA Marché des améliorants d’indice de viscosité automobile par type de produit

      • Polyalphaoléfines

      • Polyisobutylènes

      • Polymères acryliques

      • Copolymères éthylène-propylène

    • RESTE DU MEA Marché des améliorants d’indice de viscosité automobile par type de grade de viscosité

      • Faible viscosité

      • Viscosité moyenne

      • Haute viscosité

    • RESTE DU MEA Marché des améliorants d’indice de viscosité automobile par type d’utilisation finale

      • Industrie automobile

      • Applications industrielles

      • Machines agricoles