Request Free Sample ×

Kindly complete the form below to receive a free sample of this Report

* Please use a valid business email

Leading companies partner with us for data-driven Insights

clients tt-cursor
Hero Background

Marché des caméras d'action

ID: MRFR/SEM/3163-CR
200 Pages
Ankit Gupta
Last Updated: April 02, 2026

Rapport de recherche sur le marché des caméras d'action Informations par type (style boîte, style cube, style balle et périscope & 360 degrés), résolution (Full HD, Ultra HD, HD et SD), canal de distribution (en ligne et magasins physiques), utilisateur final (professionnel et personnel), application (sports, activités récréatives, services d'urgence et autres), et par région (Amérique du Nord, Europe, Asie-Pacifique, Moyen-Orient et Afrique, et Amérique du Sud) - Taille de l'industrie, part de marché et prévisions jusqu'en 2035

Partager
Download PDF ×

We do not share your information with anyone. However, we may send you emails based on your report interest from time to time. You may contact us at any time to opt-out.

Action Camera Market Infographic
Purchase Options
  1. SECTION I : RÉSUMÉ EXÉCUTIF ET POINTS CLÉS
    1. 1.1 RÉSUMÉ EXÉCUTIF
      1. 1.1.1 Aperçu du marché
      2. 1.1.2 Conclusions clés
      3. 1.1.3 Segmentation du marché
      4. 1.1.4 Paysage concurrentiel
      5. 1.1.5 Défis et opportunités
      6. 1.1.6 Perspectives futures 2
  2. SECTION II : DÉLIMITATION, MÉTHODOLOGIE ET STRUCTURE DU MARCHÉ
    1. 2.1 INTRODUCTION AU MARCHÉ
      1. 2.1.1 Définition
      2. 2.1.2 Portée de l'étude
        1. 2.1.2.1 Objectif de recherche
        2. 2.1.2.2 Hypothèse
        3. 2.1.2.3 Limitations
    2. 2.2 MÉTHODOLOGIE DE RECHERCHE
      1. 2.2.1 Aperçu
      2. 2.2.2 Exploration de données
      3. 2.2.3 Recherche secondaire
      4. 2.2.4 Recherche primaire
        1. 2.2.4.1 Interviews primaires et processus de collecte d'informations
        2. 2.2.4.2 Répartition des répondants principaux
      5. 2.2.5 Modèle de prévision
      6. 2.2.6 Estimation de la taille du marché
        1. 2.2.6.1 Approche ascendante
        2. 2.2.6.2 Approche descendante
      7. 2.2.7 Triangulation des données
      8. 2.2.8 Validation 3
  3. SECTION III : ANALYSE QUALITATIVE
    1. 3.1 DYNAMIQUE DU MARCHÉ
      1. 3.1.1 Aperçu
      2. 3.1.2 Facteurs moteurs
      3. 3.1.3 Contraintes
      4. 3.1.4 Opportunités
    2. 3.2 ANALYSE DES FACTEURS DU MARCHÉ
      1. 3.2.1 Analyse de la chaîne de valeur
      2. 3.2.2 Analyse des cinq forces de Porter
        1. 3.2.2.1 Pouvoir de négociation des fournisseurs
        2. 3.2.2.2 Pouvoir de négociation des acheteurs
        3. 3.2.2.3 Menace des nouveaux entrants
        4. 3.2.2.4 Menace des substituts
        5. 3.2.2.5 Intensité de la rivalité
      3. 3.2.3 Analyse de l'impact du COVID-19
        1. 3.2.3.1 Analyse de l'impact sur le marché
        2. 3.2.3.2 Impact régional
        3. 3.2.3.3 Analyse des opportunités et des menaces 4
  4. SECTION IV : ANALYSE QUANTITATIVE
    1. 4.1 Semi-conducteurs et Électronique, PAR Type (milliards USD)
      1. 4.1.1 Style boîte
      2. 4.1.2 Style cube
      3. 4.1.3 Style bullet
      4. 4.1.4 Périscope et 360 degrés
    2. 4.2 Semi-conducteurs et Électronique, PAR Résolution (milliards USD)
      1. 4.2.1 Full HD
      2. 4.2.2 Ultra HD
      3. 4.2.3 HD
      4. 4.2.4 SD
    3. 4.3 Semi-conducteurs et Électronique, PAR Canal de distribution (milliards USD)
      1. 4.3.1 En ligne
      2. 4.3.2 Magasins physiques
    4. 4.4 Semi-conducteurs et Électronique, PAR Utilisateur final (milliards USD)
      1. 4.4.1 Professionnel
      2. 4.4.2 Personnel
    5. 4.5 Semi-conducteurs et Électronique, PAR Application (milliards USD)
      1. 4.5.1 Sports
      2. 4.5.2 Activités récréatives
      3. 4.5.3 Services d'urgence
      4. 4.5.4 Autres
    6. 4.6 Semi-conducteurs et Électronique, PAR Région (milliards USD)
      1. 4.6.1 Amérique du Nord
        1. 4.6.1.1 États-Unis
        2. 4.6.1.2 Canada
      2. 4.6.2 Europe
        1. 4.6.2.1 Allemagne
        2. 4.6.2.2 Royaume-Uni
        3. 4.6.2.3 France
        4. 4.6.2.4 Russie
        5. 4.6.2.5 Italie
        6. 4.6.2.6 Espagne
        7. 4.6.2.7 Reste de l'Europe
      3. 4.6.3 APAC
        1. 4.6.3.1 Chine
        2. 4.6.3.2 Inde
        3. 4.6.3.3 Japon
        4. 4.6.3.4 Corée du Sud
        5. 4.6.3.5 Malaisie
        6. 4.6.3.6 Thaïlande
        7. 4.6.3.7 Indonésie
        8. 4.6.3.8 Reste de l'APAC
      4. 4.6.4 Amérique du Sud
        1. 4.6.4.1 Brésil
        2. 4.6.4.2 Mexique
        3. 4.6.4.3 Argentine
        4. 4.6.4.4 Reste de l'Amérique du Sud
      5. 4.6.5 MEA
        1. 4.6.5.1 Pays du CCG
        2. 4.6.5.2 Afrique du Sud
        3. 4.6.5.3 Reste de la MEA 5
  5. SECTION V : ANALYSE CONCURRENTIELLE
    1. 5.1 Paysage concurrentiel
      1. 5.1.1 Aperçu
      2. 5.1.2 Analyse concurrentielle
      3. 5.1.3 Analyse de part de marché
      4. 5.1.4 Stratégie de croissance majeure dans les Semi-conducteurs et Électronique
      5. 5.1.5 Évaluation comparative
      6. 5.1.6 Acteurs principaux en termes de nombre de développements dans les Semi-conducteurs et Électronique
      7. 5.1.7 Développements clés et stratégies de croissance
        1. 5.1.7.1 Lancement de nouveaux produits/Déploiement de services
        2. 5.1.7.2 Fusions et acquisitions
        3. 5.1.7.3 Coentreprises
      8. 5.1.8 Matrice financière des principaux acteurs
        1. 5.1.8.1 Ventes et revenu d'exploitation
        2. 5.1.8.2 Dépenses de R&D des principaux acteurs. 2023
    2. 5.2 Profils d'entreprise
      1. 5.2.1 GoPro (États-Unis)
        1. 5.2.1.1 Aperçu financier
        2. 5.2.1.2 Produits offerts
        3. 5.2.1.3 Développements clés
        4. 5.2.1.4 Analyse SWOT
        5. 5.2.1.5 Stratégies clés
      2. 5.2.2 DJI (CN)
        1. 5.2.2.1 Aperçu financier
        2. 5.2.2.2 Produits offerts
        3. 5.2.2.3 Développements clés
        4. 5.2.2.4 Analyse SWOT
        5. 5.2.2.5 Stratégies clés
      3. 5.2.3 Sony (JP)
        1. 5.2.3.1 Aperçu financier
        2. 5.2.3.2 Produits offerts
        3. 5.2.3.3 Développements clés
        4. 5.2.3.4 Analyse SWOT
        5. 5.2.3.5 Stratégies clés
      4. 5.2.4 Insta360 (CN)
        1. 5.2.4.1 Aperçu financier
        2. 5.2.4.2 Produits offerts
        3. 5.2.4.3 Développements clés
        4. 5.2.4.4 Analyse SWOT
        5. 5.2.4.5 Stratégies clés
      5. 5.2.5 Garmin (États-Unis)
        1. 5.2.5.1 Aperçu financier
        2. 5.2.5.2 Produits offerts
        3. 5.2.5.3 Développements clés
        4. 5.2.5.4 Analyse SWOT
        5. 5.2.5.5 Stratégies clés
      6. 5.2.6 Akaso (CN)
        1. 5.2.6.1 Aperçu financier
        2. 5.2.6.2 Produits offerts
        3. 5.2.6.3 Développements clés
        4. 5.2.6.4 Analyse SWOT
        5. 5.2.6.5 Stratégies clés
      7. 5.2.7 Yi Technology (CN)
        1. 5.2.7.1 Aperçu financier
        2. 5.2.7.2 Produits offerts
        3. 5.2.7.3 Développements clés
        4. 5.2.7.4 Analyse SWOT
        5. 5.2.7.5 Stratégies clés
      8. 5.2.8 Kodak (États-Unis)
        1. 5.2.8.1 Aperçu financier
        2. 5.2.8.2 Produits offerts
        3. 5.2.8.3 Développements clés
        4. 5.2.8.4 Analyse SWOT
        5. 5.2.8.5 Stratégies clés
      9. 5.2.9 Olympus (JP)
        1. 5.2.9.1 Aperçu financier
        2. 5.2.9.2 Produits offerts
        3. 5.2.9.3 Développements clés
        4. 5.2.9.4 Analyse SWOT
        5. 5.2.9.5 Stratégies clés
    3. 5.3 Annexe
      1. 5.3.1 Références
      2. 5.3.2 Rapports connexes 6 LISTE DES FIGURES
    4. 6.1 SYNOPSIS DU MARCHÉ
    5. 6.2 ANALYSE DU MARCHÉ EN AMÉRIQUE DU NORD
    6. 6.3 ANALYSE DU MARCHÉ AUX ÉTATS-UNIS PAR TYPE
    7. 6.4 ANALYSE DU MARCHÉ AUX ÉTATS-UNIS PAR RÉSOLUTION
    8. 6.5 ANALYSE DU MARCHÉ AUX ÉTATS-UNIS PAR CANAL DE DISTRIBUTION
    9. 6.6 ANALYSE DU MARCHÉ AUX ÉTATS-UNIS PAR UTILISATEUR FINAL
    10. 6.7 ANALYSE DU MARCHÉ AUX ÉTATS-UNIS PAR APPLICATION
    11. 6.8 ANALYSE DU MARCHÉ AU CANADA PAR TYPE
    12. 6.9 ANALYSE DU MARCHÉ AU CANADA PAR RÉSOLUTION
    13. 6.10 ANALYSE DU MARCHÉ AU CANADA PAR CANAL DE DISTRIBUTION
    14. 6.11 ANALYSE DU MARCHÉ AU CANADA PAR UTILISATEUR FINAL
    15. 6.12 ANALYSE DU MARCHÉ AU CANADA PAR APPLICATION
    16. 6.13 ANALYSE DU MARCHÉ EN EUROPE
    17. 6.14 ANALYSE DU MARCHÉ EN ALLEMAGNE PAR TYPE
    18. 6.15 ANALYSE DU MARCHÉ EN ALLEMAGNE PAR RÉSOLUTION
    19. 6.16 ANALYSE DU MARCHÉ EN ALLEMAGNE PAR CANAL DE DISTRIBUTION
    20. 6.17 ANALYSE DU MARCHÉ EN ALLEMAGNE PAR UTILISATEUR FINAL
    21. 6.18 ANALYSE DU MARCHÉ EN ALLEMAGNE PAR APPLICATION
    22. 6.19 ANALYSE DU MARCHÉ AU ROYAUME-UNI PAR TYPE
    23. 6.20 ANALYSE DU MARCHÉ AU ROYAUME-UNI PAR RÉSOLUTION
    24. 6.21 ANALYSE DU MARCHÉ AU ROYAUME-UNI PAR CANAL DE DISTRIBUTION
    25. 6.22 ANALYSE DU MARCHÉ AU ROYAUME-UNI PAR UTILISATEUR FINAL
    26. 6.23 ANALYSE DU MARCHÉ AU ROYAUME-UNI PAR APPLICATION
    27. 6.24 ANALYSE DU MARCHÉ EN FRANCE PAR TYPE
    28. 6.25 ANALYSE DU MARCHÉ EN FRANCE PAR RÉSOLUTION
    29. 6.26 ANALYSE DU MARCHÉ EN FRANCE PAR CANAL DE DISTRIBUTION
    30. 6.27 ANALYSE DU MARCHÉ EN FRANCE PAR UTILISATEUR FINAL
    31. 6.28 ANALYSE DU MARCHÉ EN FRANCE PAR APPLICATION
    32. 6.29 ANALYSE DU MARCHÉ EN RUSSIE PAR TYPE
    33. 6.30 ANALYSE DU MARCHÉ EN RUSSIE PAR RÉSOLUTION
    34. 6.31 ANALYSE DU MARCHÉ EN RUSSIE PAR CANAL DE DISTRIBUTION
    35. 6.32 ANALYSE DU MARCHÉ EN RUSSIE PAR UTILISATEUR FINAL
    36. 6.33 ANALYSE DU MARCHÉ EN RUSSIE PAR APPLICATION
    37. 6.34 ANALYSE DU MARCHÉ EN ITALIE PAR TYPE
    38. 6.35 ANALYSE DU MARCHÉ EN ITALIE PAR RÉSOLUTION
    39. 6.36 ANALYSE DU MARCHÉ EN ITALIE PAR CANAL DE DISTRIBUTION
    40. 6.37 ANALYSE DU MARCHÉ EN ITALIE PAR UTILISATEUR FINAL
    41. 6.38 ANALYSE DU MARCHÉ EN ITALIE PAR APPLICATION
    42. 6.39 ANALYSE DU MARCHÉ EN ESPAGNE PAR TYPE
    43. 6.40 ANALYSE DU MARCHÉ EN ESPAGNE PAR RÉSOLUTION
    44. 6.41 ANALYSE DU MARCHÉ EN ESPAGNE PAR CANAL DE DISTRIBUTION
    45. 6.42 ANALYSE DU MARCHÉ EN ESPAGNE PAR UTILISATEUR FINAL
    46. 6.43 ANALYSE DU MARCHÉ EN ESPAGNE PAR APPLICATION
    47. 6.44 ANALYSE DU MARCHÉ DANS LE RESTE DE L'EUROPE PAR TYPE
    48. 6.45 ANALYSE DU MARCHÉ DANS LE RESTE DE L'EUROPE PAR RÉSOLUTION
    49. 6.46 ANALYSE DU MARCHÉ DANS LE RESTE DE L'EUROPE PAR CANAL DE DISTRIBUTION
    50. 6.47 ANALYSE DU MARCHÉ DANS LE RESTE DE L'EUROPE PAR UTILISATEUR FINAL
    51. 6.48 ANALYSE DU MARCHÉ DANS LE RESTE DE L'EUROPE PAR APPLICATION
    52. 6.49 ANALYSE DU MARCHÉ EN APAC
    53. 6.50 ANALYSE DU MARCHÉ EN CHINE PAR TYPE
    54. 6.51 ANALYSE DU MARCHÉ EN CHINE PAR RÉSOLUTION
    55. 6.52 ANALYSE DU MARCHÉ EN CHINE PAR CANAL DE DISTRIBUTION
    56. 6.53 ANALYSE DU MARCHÉ EN CHINE PAR UTILISATEUR FINAL
    57. 6.54 ANALYSE DU MARCHÉ EN CHINE PAR APPLICATION
    58. 6.55 ANALYSE DU MARCHÉ EN INDE PAR TYPE
    59. 6.56 ANALYSE DU MARCHÉ EN INDE PAR RÉSOLUTION
    60. 6.57 ANALYSE DU MARCHÉ EN INDE PAR CANAL DE DISTRIBUTION
    61. 6.58 ANALYSE DU MARCHÉ EN INDE PAR UTILISATEUR FINAL
    62. 6.59 ANALYSE DU MARCHÉ EN INDE PAR APPLICATION
    63. 6.60 ANALYSE DU MARCHÉ AU JAPON PAR TYPE
    64. 6.61 ANALYSE DU MARCHÉ AU JAPON PAR RÉSOLUTION
    65. 6.62 ANALYSE DU MARCHÉ AU JAPON PAR CANAL DE DISTRIBUTION
    66. 6.63 ANALYSE DU MARCHÉ AU JAPON PAR UTILISATEUR FINAL
    67. 6.64 ANALYSE DU MARCHÉ AU JAPON PAR APPLICATION
    68. 6.65 ANALYSE DU MARCHÉ EN CORÉE DU SUD PAR TYPE
    69. 6.66 ANALYSE DU MARCHÉ EN CORÉE DU SUD PAR RÉSOLUTION
    70. 6.67 ANALYSE DU MARCHÉ EN CORÉE DU SUD PAR CANAL DE DISTRIBUTION
    71. 6.68 ANALYSE DU MARCHÉ EN CORÉE DU SUD PAR UTILISATEUR FINAL
    72. 6.69 ANALYSE DU MARCHÉ EN CORÉE DU SUD PAR APPLICATION
    73. 6.70 ANALYSE DU MARCHÉ EN MALAYSIE PAR TYPE
    74. 6.71 ANALYSE DU MARCHÉ EN MALAYSIE PAR RÉSOLUTION
    75. 6.72 ANALYSE DU MARCHÉ EN MALAYSIE PAR CANAL DE DISTRIBUTION
    76. 6.73 ANALYSE DU MARCHÉ EN MALAYSIE PAR UTILISATEUR FINAL
    77. 6.74 ANALYSE DU MARCHÉ EN MALAYSIE PAR APPLICATION
    78. 6.75 ANALYSE DU MARCHÉ EN THAÏLANDE PAR TYPE
    79. 6.76 ANALYSE DU MARCHÉ EN THAÏLANDE PAR RÉSOLUTION
    80. 6.77 ANALYSE DU MARCHÉ EN THAÏLANDE PAR CANAL DE DISTRIBUTION
    81. 6.78 ANALYSE DU MARCHÉ EN THAÏLANDE PAR UTILISATEUR FINAL
    82. 6.79 ANALYSE DU MARCHÉ EN THAÏLANDE PAR APPLICATION
    83. 6.80 ANALYSE DU MARCHÉ EN INDONÉSIE PAR TYPE
    84. 6.81 ANALYSE DU MARCHÉ EN INDONÉSIE PAR RÉSOLUTION
    85. 6.82 ANALYSE DU MARCHÉ EN INDONÉSIE PAR CANAL DE DISTRIBUTION
    86. 6.83 ANALYSE DU MARCHÉ EN INDONÉSIE PAR UTILISATEUR FINAL
    87. 6.84 ANALYSE DU MARCHÉ EN INDONÉSIE PAR APPLICATION
    88. 6.85 ANALYSE DU MARCHÉ DANS LE RESTE DE L'APAC PAR TYPE
    89. 6.86 ANALYSE DU MARCHÉ DANS LE RESTE DE L'APAC PAR RÉSOLUTION
    90. 6.87 ANALYSE DU MARCHÉ DANS LE RESTE DE L'APAC PAR CANAL DE DISTRIBUTION
    91. 6.88 ANALYSE DU MARCHÉ DANS LE RESTE DE L'APAC PAR UTILISATEUR FINAL
    92. 6.89 ANALYSE DU MARCHÉ DANS LE RESTE DE L'APAC PAR APPLICATION
    93. 6.90 ANALYSE DU MARCHÉ EN AMÉRIQUE DU SUD
    94. 6.91 ANALYSE DU MARCHÉ AU BRÉSIL PAR TYPE
    95. 6.92 ANALYSE DU MARCHÉ AU BRÉSIL PAR RÉSOLUTION
    96. 6.93 ANALYSE DU MARCHÉ AU BRÉSIL PAR CANAL DE DISTRIBUTION
    97. 6.94 ANALYSE DU MARCHÉ AU BRÉSIL PAR UTILISATEUR FINAL
    98. 6.95 ANALYSE DU MARCHÉ AU BRÉSIL PAR APPLICATION
    99. 6.96 ANALYSE DU MARCHÉ AU MEXIQUE PAR TYPE
    100. 6.97 ANALYSE DU MARCHÉ AU MEXIQUE PAR RÉSOLUTION
    101. 6.98 ANALYSE DU MARCHÉ AU MEXIQUE PAR CANAL DE DISTRIBUTION
    102. 6.99 ANALYSE DU MARCHÉ AU MEXIQUE PAR UTILISATEUR FINAL
    103. 6.100 ANALYSE DU MARCHÉ AU MEXIQUE PAR APPLICATION
    104. 6.101 ANALYSE DU MARCHÉ EN ARGENTINE PAR TYPE
    105. 6.102 ANALYSE DU MARCHÉ EN ARGENTINE PAR RÉSOLUTION
    106. 6.103 ANALYSE DU MARCHÉ EN ARGENTINE PAR CANAL DE DISTRIBUTION
    107. 6.104 ANALYSE DU MARCHÉ EN ARGENTINE PAR UTILISATEUR FINAL
    108. 6.105 ANALYSE DU MARCHÉ EN ARGENTINE PAR APPLICATION
    109. 6.106 ANALYSE DU MARCHÉ DANS LE RESTE DE L'AMÉRIQUE DU SUD PAR TYPE
    110. 6.107 ANALYSE DU MARCHÉ DANS LE RESTE DE L'AMÉRIQUE DU SUD PAR RÉSOLUTION
    111. 6.108 ANALYSE DU MARCHÉ DANS LE RESTE DE L'AMÉRIQUE DU SUD PAR CANAL DE DISTRIBUTION
    112. 6.109 ANALYSE DU MARCHÉ DANS LE RESTE DE L'AMÉRIQUE DU SUD PAR UTILISATEUR FINAL
    113. 6.110 ANALYSE DU MARCHÉ DANS LE RESTE DE L'AMÉRIQUE DU SUD PAR APPLICATION
    114. 6.111 ANALYSE DU MARCHÉ EN MEA
    115. 6.112 ANALYSE DU MARCHÉ DANS LES PAYS DU CCG PAR TYPE
    116. 6.113 ANALYSE DU MARCHÉ DANS LES PAYS DU CCG PAR RÉSOLUTION
    117. 6.114 ANALYSE DU MARCHÉ DANS LES PAYS DU CCG PAR CANAL DE DISTRIBUTION
    118. 6.115 ANALYSE DU MARCHÉ DANS LES PAYS DU CCG PAR UTILISATEUR FINAL
    119. 6.116 ANALYSE DU MARCHÉ DANS LES PAYS DU CCG PAR APPLICATION
    120. 6.117 ANALYSE DU MARCHÉ EN AFRIQUE DU SUD PAR TYPE
    121. 6.118 ANALYSE DU MARCHÉ EN AFRIQUE DU SUD PAR RÉSOLUTION
    122. 6.119 ANALYSE DU MARCHÉ EN AFRIQUE DU SUD PAR CANAL DE DISTRIBUTION
    123. 6.120 ANALYSE DU MARCHÉ EN AFRIQUE DU SUD PAR UTILISATEUR FINAL
    124. 6.121 ANALYSE DU MARCHÉ EN AFRIQUE DU SUD PAR APPLICATION
    125. 6.122 ANALYSE DU MARCHÉ DANS LE RESTE DE LA MEA PAR TYPE
    126. 6.123 ANALYSE DU MARCHÉ DANS LE RESTE DE LA MEA PAR RÉSOLUTION
    127. 6.124 ANALYSE DU MARCHÉ DANS LE RESTE DE LA MEA PAR CANAL DE DISTRIBUTION
    128. 6.125 ANALYSE DU MARCHÉ DANS LE RESTE DE LA MEA PAR UTILISATEUR FINAL
    129. 6.126 ANALYSE DU MARCHÉ DANS LE RESTE DE LA MEA PAR APPLICATION
    130. 6.127 CRITÈRES D'ACHAT CLÉS DES SEMI-CONDUCTEURS ET ÉLECTRONIQUE
    131. 6.128 PROCESSUS DE RECHERCHE DE MRFR
    132. 6.129 ANALYSE DRO DES SEMI-CONDUCTEURS ET ÉLECTRONIQUE
    133. 6.130 ANALYSE D'IMPACT DES FACTEURS MOTRICES : SEMI-CONDUCTEURS ET ÉLECTRONIQUE
    134. 6.131 ANALYSE D'IMPACT DES CONTRAINTES : SEMI-CONDUCTEURS ET ÉLECTRONIQUE
    135. 6.132 CHAÎNE D'APPROVISIONNEMENT / VALEUR : SEMI-CONDUCTEURS ET ÉLECTRONIQUE
    136. 6.133 SEMI-CONDUCTEURS ET ÉLECTRONIQUE, PAR TYPE, 2024 (% PART)
    137. 6.134 SEMI-CONDUCTEURS ET ÉLECTRONIQUE, PAR TYPE, 2024 À 2035 (milliards USD)
    138. 6.135 SEMI-CONDUCTEURS ET ÉLECTRONIQUE, PAR RÉSOLUTION, 2024 (% PART)
    139. 6.136 SEMI-CONDUCTEURS ET ÉLECTRONIQUE, PAR RÉSOLUTION, 2024 À 2035 (milliards USD)
    140. 6.137 SEMI-CONDUCTEURS ET ÉLECTRONIQUE, PAR CANAL DE DISTRIBUTION, 2024 (% PART)
    141. 6.138 SEMI-CONDUCTEURS ET ÉLECTRONIQUE, PAR CANAL DE DISTRIBUTION, 2024 À 2035 (milliards USD)
    142. 6.139 SEMI-CONDUCTEURS ET ÉLECTRONIQUE, PAR UTILISATEUR FINAL, 2024 (% PART)
    143. 6.140 SEMI-CONDUCTEURS ET ÉLECTRONIQUE, PAR UTILISATEUR FINAL, 2024 À 2035 (milliards USD)
    144. 6.141 SEMI-CONDUCTEURS ET ÉLECTRONIQUE, PAR APPLICATION, 2024 (% PART)
    145. 6.142 SEMI-CONDUCTEURS ET ÉLECTRONIQUE, PAR APPLICATION, 2024 À 2035 (milliards USD)
    146. 6.143 ÉVALUATION DES PRINCIPAUX CONCURRENTS 7 LISTE DES TABLEAUX
    147. 7.1 LISTE DES HYPOTHÈSES
    148. 7.2 ESTIMATIONS DE TAILLE DU MARCHÉ EN AMÉRIQUE DU NORD ; PRÉVISIONS
      1. 7.2.1 PAR TYPE, 2025-2035 (milliards USD)
      2. 7.2.2 PAR RÉSOLUTION, 2025-2035 (milliards USD)
      3. 7.2.3 PAR CANAL DE DISTRIBUTION, 2025-2035 (milliards USD)
      4. 7.2.4 PAR UTILISATEUR FINAL, 2025-2035 (milliards USD)
      5. 7.2.5 PAR APPLICATION, 2025-2035 (milliards USD)
    149. 7.3 ESTIMATIONS DE TAILLE DU MARCHÉ AUX ÉTATS-UNIS ; PRÉVISIONS
      1. 7.3.1 PAR TYPE, 2025-2035 (milliards USD)
      2. 7.3.2 PAR RÉSOLUTION, 2025-2035 (milliards USD)
      3. 7.3.3 PAR CANAL DE DISTRIBUTION, 2025-2035 (milliards USD)
      4. 7.3.4 PAR UTILISATEUR FINAL, 2025-2035 (milliards USD)
      5. 7.3.5 PAR APPLICATION, 2025-2035 (milliards USD)
    150. 7.4 ESTIMATIONS DE TAILLE DU MARCHÉ AU CANADA ; PRÉVISIONS
      1. 7.4.1 PAR TYPE, 2025-2035 (milliards USD)
      2. 7.4.2 PAR RÉSOLUTION, 2025-2035 (milliards USD)
      3. 7.4.3 PAR CANAL DE DISTRIBUTION, 2025-2035 (milliards USD)
      4. 7.4.4 PAR UTILISATEUR FINAL, 2025-2035 (milliards USD)
      5. 7.4.5 PAR APPLICATION, 2025-2035 (milliards USD)
    151. 7.5 ESTIMATIONS DE TAILLE DU MARCHÉ EN EUROPE ; PRÉVISIONS
      1. 7.5.1 PAR TYPE, 2025-2035 (milliards USD)
      2. 7.5.2 PAR RÉSOLUTION, 2025-2035 (milliards USD)
      3. 7.5.3 PAR CANAL DE DISTRIBUTION, 2025-2035 (milliards USD)
      4. 7.5.4 PAR UTILISATEUR FINAL, 2025-2035 (milliards USD)
      5. 7.5.5 PAR APPLICATION, 2025-2035 (milliards USD)
    152. 7.6 ESTIMATIONS DE TAILLE DU MARCHÉ EN ALLEMAGNE ; PRÉVISIONS
      1. 7.6.1 PAR TYPE, 2025-2035 (milliards USD)
      2. 7.6.2 PAR RÉSOLUTION, 2025-2035 (milliards USD)
      3. 7.6.3 PAR CANAL DE DISTRIBUTION, 2025-2035 (milliards USD)
      4. 7.6.4 PAR UTILISATEUR FINAL, 2025-2035 (milliards USD)
      5. 7.6.5 PAR APPLICATION, 2025-2035 (milliards USD)
    153. 7.7 ESTIMATIONS DE TAILLE DU MARCHÉ AU ROYAUME-UNI ; PRÉVISIONS
      1. 7.7.1 PAR TYPE, 2025-2035 (milliards USD)
      2. 7.7.2 PAR RÉSOLUTION, 2025-2035 (milliards USD)
      3. 7.7.3 PAR CANAL DE DISTRIBUTION, 2025-2035 (milliards USD)
      4. 7.7.4 PAR UTILISATEUR FINAL, 2025-2035 (milliards USD)
      5. 7.7.5 PAR APPLICATION, 2025-2035 (milliards USD)
    154. 7.8 ESTIMATIONS DE TAILLE DU MARCHÉ EN FRANCE ; PRÉVISIONS
      1. 7.8.1 PAR TYPE, 2025-2035 (milliards USD)
      2. 7.8.2 PAR RÉSOLUTION, 2025-2035 (milliards USD)
      3. 7.8.3 PAR CANAL DE DISTRIBUTION, 2025-2035 (milliards USD)
      4. 7.8.4 PAR UTILISATEUR FINAL, 2025-2035 (milliards USD)
      5. 7.8.5 PAR APPLICATION, 2025-2035 (milliards USD)
    155. 7.9 ESTIMATIONS DE TAILLE DU MARCHÉ EN RUSSIE ; PRÉVISIONS
      1. 7.9.1 PAR TYPE, 2025-2035 (milliards USD)
      2. 7.9.2 PAR RÉSOLUTION, 2025-2035 (milliards USD)
      3. 7.9.3 PAR CANAL DE DISTRIBUTION, 2025-2035 (milliards USD)
      4. 7.9.4 PAR UTILISATEUR FINAL, 2025-2035 (milliards USD)
      5. 7.9.5 PAR APPLICATION, 2025-2035 (milliards USD)
    156. 7.10 ESTIMATIONS DE TAILLE DU MARCHÉ EN ITALIE ; PRÉVISIONS
      1. 7.10.1 PAR TYPE, 2025-2035 (milliards USD)
      2. 7.10.2 PAR RÉSOLUTION, 2025-2035 (milliards USD)
      3. 7.10.3 PAR CANAL DE DISTRIBUTION, 2025-2035 (milliards USD)
      4. 7.10.4 PAR UTILISATEUR FINAL, 2025-2035 (milliards USD)
      5. 7.10.5 PAR APPLICATION, 2025-2035 (milliards USD)
    157. 7.11 ESTIMATIONS DE TAILLE DU MARCHÉ EN ESPAGNE ; PRÉVISIONS
      1. 7.11.1 PAR TYPE, 2025-2035 (milliards USD)
      2. 7.11.2 PAR RÉSOLUTION, 2025-2035 (milliards USD)
      3. 7.11.3 PAR CANAL DE DISTRIBUTION, 2025-2035 (milliards USD)
      4. 7.11.4 PAR UTILISATEUR FINAL, 2025-2035 (milliards USD)
      5. 7.11.5 PAR APPLICATION, 2025-2035 (milliards USD)
    158. 7.12 ESTIMATIONS DE TAILLE DU MARCHÉ DANS LE RESTE DE L'EUROPE ; PRÉVISIONS
      1. 7.12.1 PAR TYPE, 2025-2035 (milliards USD)
      2. 7.12.2 PAR RÉSOLUTION, 2025-2035 (milliards USD)
      3. 7.12.3 PAR CANAL DE DISTRIBUTION, 2025-2035 (milliards USD)
      4. 7.12.4 PAR UTILISATEUR FINAL, 2025-2035 (milliards USD)
      5. 7.12.5 PAR APPLICATION, 2025-2035 (milliards USD)
    159. 7.13 ESTIMATIONS DE TAILLE DU MARCHÉ EN APAC ; PRÉVISIONS
      1. 7.13.1 PAR TYPE, 2025-2035 (milliards USD)
      2. 7.13.2 PAR RÉSOLUTION, 2025-2035 (milliards USD)
      3. 7.13.3 PAR CANAL DE DISTRIBUTION, 2025-2035 (milliards USD)
      4. 7.13.4 PAR UTILISATEUR FINAL, 2025-2035 (milliards USD)
      5. 7.13.5 PAR APPLICATION, 2025-2035 (milliards USD)
    160. 7.14 ESTIMATIONS DE TAILLE DU MARCHÉ EN CHINE ; PRÉVISIONS
      1. 7.14.1 PAR TYPE, 2025-2035 (milliards USD)
      2. 7.14.2 PAR RÉSOLUTION, 2025-2035 (milliards USD)
      3. 7.14.3 PAR CANAL DE DISTRIBUTION, 2025-2035 (milliards USD)
      4. 7.14.4 PAR UTILISATEUR FINAL, 2025-2035 (milliards USD)
      5. 7.14.5 PAR APPLICATION, 2025-2035 (milliards USD)
    161. 7.15 ESTIMATIONS DE TAILLE DU MARCHÉ EN INDE ; PRÉVISIONS
      1. 7.15.1 PAR TYPE, 2025-2035 (milliards USD)
      2. 7.15.2 PAR RÉSOLUTION, 2025-2035 (milliards USD)
      3. 7.15.3 PAR CANAL DE DISTRIBUTION, 2025-2035 (milliards USD)
      4. 7.15.4 PAR UTILISATEUR FINAL, 2025-2035 (milliards USD)
      5. 7.15.5 PAR APPLICATION, 2025-2035 (milliards USD)
    162. 7.16 ESTIMATIONS DE TAILLE DU MARCHÉ AU JAPON ; PRÉVISIONS
      1. 7.16.1 PAR TYPE, 2025-2035 (milliards USD)
      2. 7.16.2 PAR RÉSOLUTION, 2025-2035 (milliards USD)
      3. 7.16.3 PAR CANAL DE DISTRIBUTION, 2025-2035 (milliards USD)
      4. 7.16.4 PAR UTILISATEUR FINAL, 2025-2035 (milliards USD)
      5. 7.16.5 PAR APPLICATION, 2025-2035 (milliards USD)
    163. 7.17 ESTIMATIONS DE TAILLE DU MARCHÉ EN CORÉE DU SUD ; PRÉVISIONS
      1. 7.17.1 PAR TYPE, 2025-2035 (milliards USD)
      2. 7.17.2 PAR RÉSOLUTION, 2025-2035 (milliards USD)
      3. 7.17.3 PAR CANAL DE DISTRIBUTION, 2025-2035 (milliards USD)
      4. 7.17.4 PAR UTILISATEUR FINAL, 2025-2035 (milliards USD)
      5. 7.17.5 PAR APPLICATION, 2025-2035 (milliards USD)
    164. 7.18 ESTIMATIONS DE TAILLE DU MARCHÉ EN MALAYSIE ; PRÉVISIONS
      1. 7.18.1 PAR TYPE, 2025-2035 (milliards USD)
      2. 7.18.2 PAR RÉSOLUTION, 2025-2035 (milliards USD)
      3. 7.18.3 PAR CANAL DE DISTRIBUTION, 2025-2035 (milliards USD)
      4. 7.18.4 PAR UTILISATEUR FINAL, 2025-2035 (milliards USD)
      5. 7.18.5 PAR APPLICATION, 2025-2035 (milliards USD)
    165. 7.19 ESTIMATIONS DE TAILLE DU MARCHÉ EN THAÏLANDE ; PRÉVISIONS
      1. 7.19.1 PAR TYPE, 2025-2035 (milliards USD)
      2. 7.19.2 PAR RÉSOLUTION, 2025-2035 (milliards USD)
      3. 7.19.3 PAR CANAL DE DISTRIBUTION, 2025-2035 (milliards USD)
      4. 7.19.4 PAR UTILISATEUR FINAL, 2025-2035 (milliards USD)
      5. 7.19.5 PAR APPLICATION, 2025-2035 (milliards USD)
    166. 7.20 ESTIMATIONS DE TAILLE DU MARCHÉ EN INDONÉSIE ; PRÉVISIONS
      1. 7.20.1 PAR TYPE, 2025-2035 (milliards USD)
      2. 7.20.2 PAR RÉSOLUTION, 2025-2035 (milliards USD)
      3. 7.20.3 PAR CANAL DE DISTRIBUTION, 2025-2035 (milliards USD)
      4. 7.20.4 PAR UTILISATEUR FINAL, 2025-2035 (milliards USD)
      5. 7.20.5 PAR APPLICATION, 2025-2035 (milliards USD)
    167. 7.21 ESTIMATIONS DE TAILLE DU MARCHÉ DANS LE RESTE DE L'APAC ; PRÉVISIONS
      1. 7.21.1 PAR TYPE, 2025-2035 (milliards USD)
      2. 7.21.2 PAR RÉSOLUTION, 2025-2035 (milliards USD)
      3. 7.21.3 PAR CANAL DE DISTRIBUTION, 2025-2035 (milliards USD)
      4. 7.21.4 PAR UTILISATEUR FINAL, 2025-2035 (milliards USD)
      5. 7.21.5 PAR APPLICATION, 2025-2035 (milliards USD)
    168. 7.22 ESTIMATIONS DE TAILLE DU MARCHÉ EN AMÉRIQUE DU SUD ; PRÉVISIONS
      1. 7.22.1 PAR TYPE, 2025-2035 (milliards USD)
      2. 7.22.2 PAR RÉSOLUTION, 2025-2035 (milliards USD)
      3. 7.22.3 PAR CANAL DE DISTRIBUTION, 2025-2035 (milliards USD)
      4. 7.22.4 PAR UTILISATEUR FINAL, 2025-2035 (milliards USD)
      5. 7.22.5 PAR APPLICATION, 2025-2035 (milliards USD)
    169. 7.23 ESTIMATIONS DE TAILLE DU MARCHÉ AU BRÉSIL ; PRÉVISIONS
      1. 7.23.1 PAR TYPE, 2025-2035 (milliards USD)
      2. 7.23.2 PAR RÉSOLUTION, 2025-2035 (milliards USD)
      3. 7.23.3 PAR CANAL DE DISTRIBUTION, 2025-2035 (milliards USD)
      4. 7.23.4 PAR UTILISATEUR FINAL, 2025-2035 (milliards USD)
      5. 7.23.5 PAR APPLICATION, 2025-2035 (milliards USD)
    170. 7.24 ESTIMATIONS DE TAILLE DU MARCHÉ AU MEXIQUE ; PRÉVISIONS
      1. 7.24.1 PAR TYPE, 2025-2035 (milliards USD)
      2. 7.24.2 PAR RÉSOLUTION, 2025-2035 (milliards USD)
      3. 7.24.3 PAR CANAL DE DISTRIBUTION, 2025-2035 (milliards USD)
      4. 7.24.4 PAR UTILISATEUR FINAL, 2025-2035 (milliards USD)
      5. 7.24.5 PAR APPLICATION, 2025-2035 (milliards USD)
    171. 7.25 ESTIMATIONS DE TAILLE DU MARCHÉ EN ARGENTINE ; PRÉVISIONS
      1. 7.25.1 PAR TYPE, 2025-2035 (milliards USD)
      2. 7.25.2 PAR RÉSOLUTION, 2025-2035 (milliards USD)
      3. 7.25.3 PAR CANAL DE DISTRIBUTION, 2025-2035 (milliards USD)
      4. 7.25.4 PAR UTILISATEUR FINAL, 2025-2035 (milliards USD)
      5. 7.25.5 PAR APPLICATION, 2025-2035 (milliards USD)
    172. 7.26 ESTIMATIONS DE TAILLE DU MARCHÉ DANS LE RESTE DE L'AMÉRIQUE DU SUD ; PRÉVISIONS
      1. 7.26.1 PAR TYPE, 2025-2035 (milliards USD)
      2. 7.26.2 PAR RÉSOLUTION, 2025-2035 (milliards USD)
      3. 7.26.3 PAR CANAL DE DISTRIBUTION, 2025-2035 (milliards USD)
      4. 7.26.4 PAR UTILISATEUR FINAL, 2025-2035 (milliards USD)
      5. 7.26.5 PAR APPLICATION, 2025-2035 (milliards USD)
    173. 7.27 ESTIMATIONS DE TAILLE DU MARCHÉ EN MEA ; PRÉVISIONS
      1. 7.27.1 PAR TYPE, 2025-2035 (milliards USD)
      2. 7.27.2 PAR RÉSOLUTION, 2025-2035 (milliards USD)
      3. 7.27.3 PAR CANAL DE DISTRIBUTION, 2025-2035 (milliards USD)
      4. 7.27.4 PAR UTILISATEUR FINAL, 2025-2035 (milliards USD)
      5. 7.27.5 PAR APPLICATION, 2025-2035 (milliards USD)
    174. 7.28 ESTIMATIONS DE TAILLE DU MARCHÉ DANS LES PAYS DU CCG ; PRÉVISIONS
      1. 7.28.1 PAR TYPE, 2025-2035 (milliards USD)
      2. 7.28.2 PAR RÉSOLUTION, 2025-2035 (milliards USD)
      3. 7.28.3 PAR CANAL DE DISTRIBUTION, 2025-2035 (milliards USD)
      4. 7.28.4 PAR UTILISATEUR FINAL, 2025-2035 (milliards USD)
      5. 7.28.5 PAR APPLICATION, 2025-2035 (milliards USD)
    175. 7.29 ESTIMATIONS DE TAILLE DU MARCHÉ EN AFRIQUE DU SUD ; PRÉVISIONS
      1. 7.29.1 PAR TYPE, 2025-2035 (milliards USD)
      2. 7.29.2 PAR RÉSOLUTION, 2025-2035 (milliards USD)
      3. 7.29.3 PAR CANAL DE DISTRIBUTION, 2025-2035 (milliards USD)
      4. 7.29.4 PAR UTILISATEUR FINAL, 2025-2035 (milliards USD)
      5. 7.29.5 PAR APPLICATION, 2025-2035 (milliards USD)
    176. 7.30 ESTIMATIONS DE TAILLE DU MARCHÉ DANS LE RESTE DE LA MEA ; PRÉVISIONS
      1. 7.30.1 PAR TYPE, 2025-2035 (milliards USD)
      2. 7.30.2 PAR RÉSOLUTION, 2025-2035 (milliards USD)
      3. 7.30.3 PAR CANAL DE DISTRIBUTION, 2025-2035 (milliards USD)
      4. 7.30.4 PAR UTILISATEUR FINAL, 2025-2035 (milliards USD)
      5. 7.30.5 PAR APPLICATION, 2025-2035 (milliards USD)
    177. 7.31 LANCEMENT DE PRODUIT/DÉVELOPPEMENT/APPROBATION
    178. 7.32 ACQUISITION/PARTENARIAT

Segmentation du marché mondial des caméras d'action

Caméra d'action mondiale, par type de perspective (millions USD, 2018-2032)

Style boîte

Style cube

Style balle

Periscope & 360 degrés

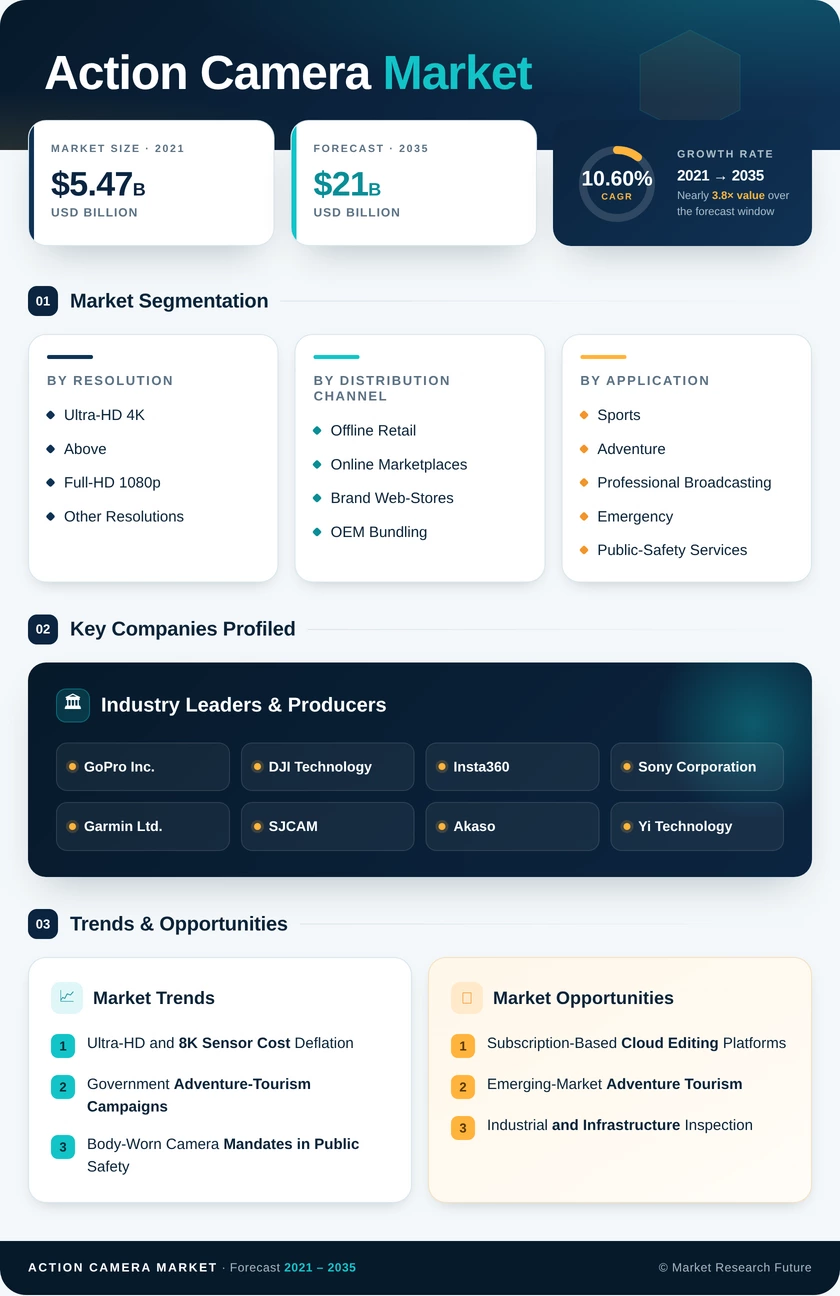
Caméra d'action mondiale, par résolution (millions USD, 2018-2032)

Full HD

Ultra HD

HD

SD

Caméra d'action mondiale, par perspective de canal de distribution (millions USD, 2018-2032)

En ligne

Magasins physiques

Caméra d'action mondiale, par perspective d'utilisateur final (millions USD, 2018-2032)

Professionnel

Personnel

Caméra d'action mondiale, par perspective d'application (millions USD, 2018-2032)

Sports

Activités récréatives

Services d'urgence

Autres

Perspectives régionales des caméras d'action mondiales (millions USD, 2018-2032)

Perspectives de l'Amérique du Nord (millions USD, 2018-2032)

Caméra d'action en Amérique du Nord, par type de perspective (millions USD, 2018-2032)

Style boîte

Style cube

Style balle

Periscope & 360 degrés

Caméra d'action en Amérique du Nord, par résolution (millions USD, 2018-2032)

Full HD

Ultra HD

HD

SD

Caméra d'action en Amérique du Nord, par perspective de canal de distribution (millions USD, 2018-2032)

En ligne

Magasins physiques

Caméra d'action en Amérique du Nord, par perspective d'utilisateur final (millions USD, 2018-2032)

Professionnel

Personnel

Caméra d'action en Amérique du Nord, par perspective d'application (millions USD, 2018-2032)

Sports

Activités récréatives

Services d'urgence

Autres

Perspectives des États-Unis (millions USD, 2018-2032)

Caméra d'action aux États-Unis, par type de perspective (millions USD, 2018-2032)

Style boîte

Style cube

Style balle

Periscope & 360 degrés

Caméra d'action aux États-Unis, par résolution (millions USD, 2018-2032)

Full HD

Ultra HD

HD

SD

Caméra d'action aux États-Unis, par perspective de canal de distribution (millions USD, 2018-2032)

En ligne

Magasins physiques

Caméra d'action aux États-Unis, par perspective d'utilisateur final (millions USD, 2018-2032)

Professionnel

Personnel

Caméra d'action aux États-Unis, par perspective d'application (millions USD, 2018-2032)

Sports

Activités récréatives

Services d'urgence

Autres

Perspectives du Canada (millions USD, 2018-2032)

Caméra d'action au Canada, par type de perspective (millions USD, 2018-2032)

Style boîte

Style cube

Style balle

Periscope & 360 degrés

Caméra d'action au Canada, par résolution (millions USD, 2018-2032)

Full HD

Ultra HD

HD

SD

Caméra d'action au Canada, par perspective de canal de distribution (millions USD, 2018-2032)

En ligne

Magasins physiques

Caméra d'action au Canada, par perspective d'utilisateur final (millions USD, 2018-2032)

Professionnel

Personnel

Caméra d'action au Canada, par perspective d'application (millions USD, 2018-2032)

Sports

Activités récréatives

Services d'urgence

Autres

Perspectives du Mexique (millions USD, 2018-2032)

Caméra d'action au Mexique, par type de perspective (millions USD, 2018-2032)

Style boîte

Style cube

Style balle

Periscope & 360 degrés

Caméra d'action au Mexique, par résolution (millions USD, 2018-2032)

Full HD

Ultra HD

HD

SD

Caméra d'action au Mexique, par perspective de canal de distribution (millions USD, 2018-2032)

En ligne

Magasins physiques

Caméra d'action au Mexique, par perspective d'utilisateur final (millions USD, 2018-2032)

Professionnel

Personnel

Caméra d'action au Mexique, par perspective d'application (millions USD, 2018-2032)

Sports

Activités récréatives

Services d'urgence

Autres

Perspectives de l'Europe (millions USD, 2018-2032)

Caméra d'action en Europe, par type de perspective (millions USD, 2018-2032)

Style boîte

Style cube

Style balle

Periscope & 360 degrés

Caméra d'action en Europe, par résolution (millions USD, 2018-2032)

Full HD

Ultra HD

HD

SD

Caméra d'action en Europe, par perspective de canal de distribution (millions USD, 2018-2032)

En ligne

Magasins physiques

Caméra d'action en Europe, par perspective d'utilisateur final (millions USD, 2018-2032)

Professionnel

Personnel

Caméra d'action en Europe, par perspective d'application (millions USD, 2018-2032)

Sports

Activités récréatives

Services d'urgence

Autres

Perspectives de l'Allemagne (millions USD, 2018-2032)

Caméra d'action en Allemagne, par type de perspective (millions USD, 2018-2032)

Style boîte

Style cube

Style balle

Periscope & 360 degrés

Caméra d'action en Allemagne, par résolution (millions USD, 2018-2032)

Full HD

Ultra HD

HD

SD

Caméra d'action en Allemagne, par perspective de canal de distribution (millions USD, 2018-2032)

En ligne

Magasins physiques

Caméra d'action en Allemagne, par perspective d'utilisateur final (millions USD, 2018-2032)

Professionnel

Personnel

Caméra d'action en Allemagne, par perspective d'application (millions USD, 2018-2032)

Sports

Activités récréatives

Services d'urgence

Autres

Perspectives de la France (millions USD, 2018-2032)

Caméra d'action en France, par type de perspective (millions USD, 2018-2032)

Style boîte

Style cube

Style balle

Periscope & 360 degrés

Caméra d'action en France, par résolution (millions USD, 2018-2032)

Full HD

Ultra HD

HD

SD

Caméra d'action en France, par perspective de canal de distribution (millions USD, 2018-2032)

En ligne

Magasins physiques

Caméra d'action en France, par perspective d'utilisateur final (millions USD, 2018-2032)

Professionnel

Personnel

Caméra d'action en France, par perspective d'application (millions USD, 2018-2032)

Sports

Activités récréatives

Services d'urgence

Autres

Perspectives du Royaume-Uni (millions USD, 2018-2032)

Caméra d'action au Royaume-Uni, par type de perspective (millions USD, 2018-2032)

Style boîte

Style cube

Style balle

Periscope & 360 degrés

Caméra d'action au Royaume-Uni, par résolution (millions USD, 2018-2032)

Full HD

Ultra HD

HD

SD

Caméra d'action au Royaume-Uni, par perspective de canal de distribution (millions USD, 2018-2032)

En ligne

Magasins physiques

Caméra d'action au Royaume-Uni, par perspective d'utilisateur final (millions USD, 2018-2032)

Professionnel

Personnel

Caméra d'action au Royaume-Uni, par perspective d'application (millions USD, 2018-2032)

Sports

Activités récréatives

Services d'urgence

Autres

Perspectives du reste de l'Europe (millions USD, 2018-2032)

Caméra d'action dans le reste de l'Europe, par type de perspective (millions USD, 2018-2032)

Style boîte

Style cube

Style balle

Periscope & 360 degrés

Caméra d'action dans le reste de l'Europe, par résolution (millions USD, 2018-2032)

Full HD

Ultra HD

HD

SD

Caméra d'action dans le reste de l'Europe, par perspective de canal de distribution (millions USD, 2018-2032)

En ligne

Magasins physiques

Caméra d'action dans le reste de l'Europe, par perspective d'utilisateur final (millions USD, 2018-2032)

Professionnel

Personnel

Caméra d'action dans le reste de l'Europe, par perspective d'application (millions USD, 2018-2032)

Sports

Activités récréatives

Services d'urgence

Autres

Perspectives de l'Asie-Pacifique (millions USD, 2018-2032)

Caméra d'action en Asie-Pacifique, par type de perspective (millions USD, 2018-2032)

Style boîte

Style cube

Style balle

Periscope & 360 degrés

Caméra d'action en Asie-Pacifique, par résolution (millions USD, 2018-2032)

Full HD

Ultra HD

HD

SD

Caméra d'action en Asie-Pacifique, par perspective de canal de distribution (millions USD, 2018-2032)

En ligne

Magasins physiques

Caméra d'action en Asie-Pacifique, par perspective d'utilisateur final (millions USD, 2018-2032)

Professionnel

Personnel

Caméra d'action en Asie-Pacifique, par perspective d'application (millions USD, 2018-2032)

Sports

Activités récréatives

Services d'urgence

Autres

Perspectives de la Chine (millions USD, 2018-2032)

Caméra d'action en Chine, par type de perspective (millions USD, 2018-2032)

Style boîte

Style cube

Style balle

Periscope & 360 degrés

Caméra d'action en Chine, par résolution (millions USD, 2018-2032)

Full HD

Ultra HD

HD

SD

Caméra d'action en Chine, par perspective de canal de distribution (millions USD, 2018-2032)

En ligne

Magasins physiques

Caméra d'action en Chine, par perspective d'utilisateur final (millions USD, 2018-2032)

Professionnel

Personnel

Caméra d'action en Chine, par perspective d'application (millions USD, 2018-2032)

Sports

Activités récréatives

Services d'urgence

Autres

Perspectives de l'Inde (millions USD, 2018-2032)

Caméra d'action en Inde, par type de perspective (millions USD, 2018-2032)

Style boîte

Style cube

Style balle

Periscope & 360 degrés

Caméra d'action en Inde, par résolution (millions USD, 2018-2032)

Full HD

Ultra HD

HD

SD

Caméra d'action en Inde, par perspective de canal de distribution (millions USD, 2018-2032)

En ligne

Magasins physiques

Caméra d'action en Inde, par perspective d'utilisateur final (millions USD, 2018-2032)

Professionnel

Personnel

Caméra d'action en Inde, par perspective d'application (millions USD, 2018-2032)

Sports

Activités récréatives

Services d'urgence

Autres

Perspectives du Japon (millions USD, 2018-2032)

Caméra d'action au Japon, par type de perspective (millions USD, 2018-2032)

Style boîte

Style cube

Style balle

Periscope & 360 degrés

Caméra d'action au Japon, par résolution (millions USD, 2018-2032)

Full HD

Ultra HD

HD

SD

Caméra d'action au Japon, par perspective de canal de distribution (millions USD, 2018-2032)

En ligne

Magasins physiques

Caméra d'action au Japon, par perspective d'utilisateur final (millions USD, 2018-2032)

Professionnel

Personnel

Caméra d'action au Japon, par perspective d'application (millions USD, 2018-2032)

Sports

Activités récréatives

Services d'urgence

Autres

Perspectives du reste de l'Asie-Pacifique (millions USD, 2018-2032)

Caméra d'action dans le reste de l'Asie-Pacifique, par type de perspective (millions USD, 2018-2032)

Style boîte

Style cube

Style balle

Periscope & 360 degrés

Caméra d'action dans le reste de l'Asie-Pacifique, par résolution (millions USD, 2018-2032)

Full HD

Ultra HD

HD

SD

Caméra d'action dans le reste de l'Asie-Pacifique, par perspective de canal de distribution (millions USD, 2018-2032)

En ligne

Magasins physiques

Caméra d'action dans le reste de l'Asie-Pacifique, par perspective d'utilisateur final (millions USD, 2018-2032)

Professionnel

Personnel

Caméra d'action dans le reste de l'Asie-Pacifique, par perspective d'application (millions USD, 2018-2032)

Sports

Activités récréatives

Services d'urgence

Autres

Perspectives du reste du monde (millions USD, 2018-2032)

Caméra d'action dans le reste du monde, par type de perspective (millions USD, 2018-2032)

Style boîte

Style cube

Style balle

Periscope & 360 degrés

Caméra d'action dans le reste du monde, par résolution (millions USD, 2018-2032)

Full HD

Ultra HD

HD

SD

Caméra d'action dans le reste du monde, par perspective de canal de distribution (millions USD, 2018-2032)

En ligne

Magasins physiques

Caméra d'action dans le reste du monde, par perspective d'utilisateur final (millions USD, 2018-2032)

Professionnel

Personnel

Caméra d'action dans le reste du monde, par perspective d'application (millions USD, 2018-2032)

Sports

Activités récréatives

Services d'urgence

Autres

Perspectives du Moyen-Orient et de l'Afrique (millions USD, 2018-2032)

Caméra d'action au Moyen-Orient et en Afrique, par type de perspective (millions USD, 2018-2032)

Style boîte

Style cube

Style balle

Periscope & 360 degrés

Caméra d'action au Moyen-Orient et en Afrique, par résolution (millions USD, 2018-2032)

Full HD

Ultra HD

HD

SD

Caméra d'action au Moyen-Orient et en Afrique, par perspective de canal de distribution (millions USD, 2018-2032)

En ligne

Magasins physiques

Caméra d'action au Moyen-Orient et en Afrique, par perspective d'utilisateur final (millions USD, 2018-2032)

Professionnel

Personnel

Caméra d'action au Moyen-Orient et en Afrique, par perspective d'application (millions USD, 2018-2032)

Sports

Activités récréatives

Services d'urgence

Autres

Perspectives de l'Amérique du Sud (millions USD, 2018-2032)

Caméra d'action en Amérique du Sud, par type de perspective (millions USD, 2018-2032)

Style boîte

Style cube

Style balle

Periscope & 360 degrés

Caméra d'action en Amérique du Sud, par résolution (millions USD, 2018-2032)

Full HD

Ultra HD

HD

SD

Caméra d'action en Amérique du Sud, par perspective de canal de distribution (millions USD, 2018-2032)

En ligne

Magasins physiques

Caméra d'action en Amérique du Sud, par perspective d'utilisateur final (millions USD, 2018-2032)

Professionnel

Personnel

Caméra d'action en Amérique du Sud, par perspective d'application (millions USD, 2018-2032)

Sports

Activités récréatives

Services d'urgence

Autres

Compare Licence

×
Features License Type
Single User Multiuser License Enterprise User
Price $4,950 $5,950 $7,250
Maximum User Access Limit 1 User Upto 10 Users Unrestricted Access Throughout the Organization
Free Customization
Direct Access to Analyst
Deliverable Format
Platform Access
Discount on Next Purchase 10% 15% 15%
Printable Versions