Request Free Sample ×

Kindly complete the form below to receive a free sample of this Report

* Please use a valid business email

Leading companies partner with us for data-driven Insights

clients tt-cursor
Hero Background

Washing Capsule Market

ID: MRFR/CG/34533-HCR
128 Pages
Pradeep Nandi
Last Updated: April 06, 2026

Informe de investigación de mercado de cápsulas de lavado por aplicación (lavandería, lavavajillas, eliminación de manchas), por tipo de formulación (ultraconcentrada, concentrada, estándar), por canal de distribución (supermercados, venta minorista en línea, tiendas de conveniencia), por segmento de uso final (residencial, comercial, industrial) y por región (América del Norte, Europa, América del Sur, Asia Pacífico, Medio Oriente y África): pronóstico para 2032.

Compartir
Download PDF ×

We do not share your information with anyone. However, we may send you emails based on your report interest from time to time. You may contact us at any time to opt-out.

 Washing Capsule Market  Infographic
Purchase Options
  1. 1 RESUMEN EJECUTIVO
    1. 1.1 Descripción general del mercado
    2. 1.2 Hallazgos clave
    3. 1.3 Segmentación del mercado
    4. 1.4 Panorama Competitivo
    5. 1.5 Retos y Oportunidades
    6. 1.6 Perspectivas futuras
  2. 2 INTRODUCCIÓN AL MERCADO
    1. 2.1 Definición
    2. 2.2 Alcance del estudio
      1. 2.2.1 Objetivo de la investigación
      2. 2.2.2 Supuesto
      3. 2.2.3 Limitaciones
  3. 3 METODOLOGÍA DE LA INVESTIGACIÓN
    1. 3.1 Descripción general
    2. 3.2 Minería de datos
    3. 3.3 Investigación Secundaria
    4. 3.4 Investigación Primaria
      1. 3.4.1 Entrevistas primarias y proceso de recopilación de información
      2. 3.4.2 Desglose de los encuestados principales
    5. 3.5 Modelo de previsión
    6. 3.6 Estimación del tamaño del mercado
      1. 3.6.1 Enfoque ascendente
      2. 3.6.2 Enfoque de arriba hacia abajo
    7. 3.7 Triangulación de datos
    8. 3.8 Validación
  4. 4 DINÁMICA DEL MERCADO
    1. 4.1 Descripción general
    2. 4.2 Conductores
    3. 4.3 Restricciones
    4. 4.4 Oportunidades
  5. 5 ANÁLISIS DE FACTORES DE MERCADO
    1. 5.1 Análisis de la cadena de valor
    2. 5.2 Análisis de las cinco fuerzas de Porter
      1. 5.2.1 Poder de negociación de los proveedores
      2. 5.2.2 Poder de negociación de los compradores
      3. 5.2.3 Amenaza de nuevos participantes
      4. 5.2.4 Amenaza de sustitutos
      5. 5.2.5 Intensidad de la rivalidad
    3. 5.3 Análisis de impacto de COVID-19
      1. 5.3.1 Análisis de Impacto en el Mercado
      2. 5.3.2 Impacto Regional
      3. 5.3.3 Análisis de oportunidades y amenazas
  6. 6 MERCADO DE CÁPSULAS DE LAVADO, POR APLICACIÓN (MILLONES DE USD)
    1. 6.1 Lavandería
    2. 6.2 Lavado de vajillas
    3. 6.3 Eliminación de manchas
  7. 7 MERCADO DE CÁPSULAS DE LAVADO, POR TIPO DE FORMULACIÓN (MILLONES DE USD)
    1. 7.1 Ultraconcentrado
    2. 7.2 Concentrado
    3. 7.3 Estándar
  8. 8 MERCADO DE CÁPSULAS DE LAVADO, POR CANAL DE DISTRIBUCIÓN (MILLONES DE USD)
    1. 8.1 Supermercados
    2. 8.2 Comercio minorista en línea
    3. 8.3 Tiendas de conveniencia
  9. 9 MERCADO DE CÁPSULAS DE LAVADO, POR SEGMENTO DE USO FINAL (MILLONES DE USD)
    1. 9.1 Residencial
    2. 9.2 Comercial
    3. 9.3 Industriales
  10. 10 MERCADO DE CÁPSULAS DE LAVADO, POR REGIONAL (MILLONES DE USD)
    1. 10.1 América del Norte
      1. 10.1.1 Estados Unidos
      2. 10.1.2 Canadá
    2. 10.2 Europa
      1. 10.2.1 Alemania
      2. 10.2.2 Reino Unido
      3. 10.2.3 Francia
      4. 10.2.4 Rusia
      5. 10.2.5 Italia
      6. 10.2.6 España
      7. 10.2.7 Resto de Europa
    3. 10.3 Asia Pacífico
      1. 10.3.1 China
      2. 10.3.2 India
      3. 10.3.3 Japón
      4. 10.3.4 Corea del Sur
      5. 10.3.5 Malasia
      6. 10.3.6 Tailandia
      7. 10.3.7 Indonesia
      8. 10.3.8 Resto de APAC
    4. 10.4 América del Sur
      1. 10.4.1 Brasil
      2. 10.4.2 México
      3. 10.4.3 Argentina
      4. 10.4.4 Resto de Sudamérica
    5. 10.5 AMUMA
      1. 10.5.1 Países del CCG
      2. 10.5.2 Sudáfrica
      3. 10.5.3 Resto de MEA
  11. 11 PANORAMA COMPETITIVO
    1. 11.1 Descripción general
    2. 11.2 Análisis competitivo
    3. 11.3 Análisis de cuota de mercado
    4. 11.4 Importante estrategia de crecimiento en el mercado de cápsulas de lavado
    5. 11.5 Benchmarking competitivo
    6. 11.6 Principales actores en términos de número de desarrollos en el mercado de cápsulas de lavado
    7. 11.7 Desarrollos clave y estrategias de crecimiento
      1. 11.7.1 Lanzamiento de nuevos productos/implementación de servicios
      2. 11.7.2 Fusión y Adquisiciones
      3. 11.7.3 Empresas conjuntas
    8. 11.8 Matriz financiera de los principales actores
      1. 11.8.1 Ventas e ingresos operativos
      2. 11.8.2 Gasto en I+D de los principales actores. 2023
  12. 12 PERFILES DE LA EMPRESA
    1. 12.1 Productos del método
      1. 12.1.1 Panorama financiero
      2. 12.1.2 Productos Ofrecidos
      3. 12.1.3 Desarrollos clave
      4. 12.1.4 Análisis FODA
      5. 12.1.5 Estrategias clave
    2. 12.2 Unilever
      1. 12.2.1 Panorama financiero
      2. 12.2.2 Productos Ofrecidos
      3. 12.2.3 Desarrollos clave
      4. 12.2.4 Análisis FODA
      5. 12.2.5 Estrategias clave
    3. 12.3 Reckitt Benckiser
      1. 12.3.1 Panorama financiero
      2. 12.3.2 Productos Ofrecidos
      3. 12.3.3 Desarrollos clave
      4. 12.3.4 Análisis FODA
      5. 12.3.5 Estrategias clave
    4. 12.4 SC Johnson
      1. 12.4.1 Panorama financiero
      2. 12.4.2 Productos Ofrecidos
      3. 12.4.3 Desarrollos clave
      4. 12.4.4 Análisis FODA
      5. 12.4.5 Estrategias clave
    5. 12.5 Henkel
      1. 12.5.1 Panorama financiero
      2. 12.5.2 Productos ofrecidos
      3. 12.5.3 Desarrollos clave
      4. 12.5.4 Análisis FODA
      5. 12.5.5 Estrategias clave
    6. 12.6 NielsenMassey Vainillas
      1. 12.6.1 Panorama financiero
      2. 12.6.2 Productos ofrecidos
      3. 12.6.3 Desarrollos clave
      4. 12.6.4 Análisis FODA
      5. 12.6.5 Estrategias clave
    7. 12.7 Ecover
      1. 12.7.1 Panorama financiero
      2. 12.7.2 Productos ofrecidos
      3. 12.7.3 Desarrollos clave
      4. 12.7.4 Análisis FODA
      5. 12.7.5 Estrategias clave
    8. 12.8 Brazo y Martillo
      1. 12.8.1 Panorama financiero
      2. 12.8.2 Productos ofrecidos
      3. 12.8.3 Desarrollos clave
      4. 12.8.4 Análisis FODA
      5. 12.8.5 Estrategias clave
    9. 12.9 Séptima Generación
      1. 12.9.1 Panorama financiero
      2. 12.9.2 Productos ofrecidos
      3. 12.9.3 Desarrollos clave
      4. 12.9.4 Análisis FODA
      5. 12.9.5 Estrategias clave
    10. 12.10 Persil
      1. 12.10.1 Panorama financiero
      2. 12.10.2 Productos Ofrecidos
      3. 12.10.3 Desarrollos clave
      4. 12.10.4 Análisis FODA
      5. 12.10.5 Estrategias clave
    11. 12.11 Productos NicePak
      1. 12.11.1 Panorama financiero
      2. 12.11.2 Productos Ofrecidos
      3. 12.11.3 Desarrollos clave
      4. 12.11.4 Análisis FODA
      5. 12.11.5 Estrategias clave
    12. 12.12 ColgatePalmolive
      1. 12.12.1 Panorama financiero
      2. 12.12.2 Productos Ofrecidos
      3. 12.12.3 Desarrollos clave
      4. 12.12.4 Análisis FODA
      5. 12.12.5 Estrategias clave
    13. 12.13 Procter y Gamble
      1. 12.13.1 Panorama financiero
      2. 12.13.2 Productos Ofrecidos
      3. 12.13.3 Desarrollos clave
      4. 12.13.4 Análisis FODA
      5. 12.13.5 Estrategias clave
    14. 12.14 Iglesia y Dwight
      1. 12.14.1 Panorama financiero
      2. 12.14.2 Productos Ofrecidos
      3. 12.14.3 Desarrollos clave
      4. 12.14.4 Análisis FODA
      5. 12.14.5 Estrategias clave
  13. 13 APÉNDICE
    1. 13.1 Referencias
    2. 13.2 Informes relacionados
    3. LISTA DE TABLAS
    4. TABLA 1. LISTA DE SUPUESTOS
    5. TABLA 2. ESTIMACIONES Y ESTIMACIONES DEL TAMAÑO DEL MERCADO DE CÁPSULAS DE LAVADO EN AMÉRICA DEL NORTE. PRONÓSTICO, POR APLICACIÓN, 2019-2032 (MILES DE MILLONES DE USD)
    6. TABLA 3. ESTIMACIONES Y ESTIMACIONES DEL TAMAÑO DEL MERCADO DE CÁPSULAS DE LAVADO DE AMÉRICA DEL NORTE. PRONÓSTICO, POR TIPO DE FORMULACIÓN, 2019-2032 (MILES DE MILLONES DE USD)
    7. TABLA 4. ESTIMACIONES Y ESTIMACIONES DEL TAMAÑO DEL MERCADO DE CÁPSULAS DE LAVADO DE AMÉRICA DEL NORTE. PRONÓSTICO, POR CANAL DE DISTRIBUCIÓN, 2019-2032 (MILES DE MILLONES DE USD)
    8. TABLA 5. ESTIMACIONES Y ESTIMACIONES DEL TAMAÑO DEL MERCADO DE CÁPSULAS DE LAVADO EN AMÉRICA DEL NORTE. PRONÓSTICO, POR SEGMENTO DE USO FINAL, 2019-2032 (MILES DE MILLONES DE USD)
    9. TABLA 6. ESTIMACIONES Y ESTIMACIONES DEL TAMAÑO DEL MERCADO DE CÁPSULAS DE LAVADO EN AMÉRICA DEL NORTE. PRONÓSTICO, POR REGIONAL, 2019-2032 (MILES DE MILLONES DE USD)
    10. TABLA 7. ESTIMACIONES DEL TAMAÑO DEL MERCADO DE CÁPSULAS DE LAVADO DE EE. UU. Y su volumen de ventas. PRONÓSTICO, POR APLICACIÓN, 2019-2032 (MILES DE MILLONES DE USD)
    11. TABLA 8. ESTIMACIONES Y PRESUPUESTOS DEL TAMAÑO DEL MERCADO DE CÁPSULAS DE LAVADO DE EE. UU. PRONÓSTICO, POR TIPO DE FORMULACIÓN, 2019-2032 (MILES DE MILLONES DE USD)
    12. TABLA 9. ESTIMACIONES Y PRESUPUESTOS DEL TAMAÑO DEL MERCADO DE CÁPSULAS DE LAVADO DE EE. UU. PRONÓSTICO, POR CANAL DE DISTRIBUCIÓN, 2019-2032 (MILES DE MILLONES DE USD)
    13. TABLA 10. ESTIMACIONES Y POTENCIA DEL TAMAÑO DEL MERCADO DE CÁPSULAS DE LAVADO DE EE. UU. PRONÓSTICO, POR SEGMENTO DE USO FINAL, 2019-2032 (MILES DE MILLONES DE USD)
    14. TABLA 11. ESTIMACIONES Y PRESUPUESTOS DEL TAMAÑO DEL MERCADO DE CÁPSULAS DE LAVADO DE EE. UU. PRONÓSTICO, POR REGIONAL, 2019-2032 (MILES DE MILLONES DE USD)
    15. TABLA 12. ESTIMACIONES DEL TAMAÑO DEL MERCADO DE CÁPSULAS DE LAVADO DE CANADÁ Y PREVISIÓN PRONÓSTICO, POR APLICACIÓN, 2019-2032 (MILES DE MILLONES DE USD)
    16. TABLA 13. ESTIMACIONES Y POTENCIA DEL TAMAÑO DEL MERCADO DE CÁPSULAS DE LAVADO DE CANADÁ. PRONÓSTICO, POR TIPO DE FORMULACIÓN, 2019-2032 (MILES DE MILLONES DE USD)
    17. TABLA 14. ESTIMACIONES DEL TAMAÑO DEL MERCADO DE CÁPSULAS DE LAVADO DE CANADÁ Y PREVISIÓN PRONÓSTICO, POR CANAL DE DISTRIBUCIÓN, 2019-2032 (MILES DE MILLONES DE USD)
    18. TABLA 15. ESTIMACIONES DEL TAMAÑO DEL MERCADO DE CÁPSULAS DE LAVADO DE CANADÁ Y PREVISIONES. PRONÓSTICO, POR SEGMENTO DE USO FINAL, 2019-2032 (MILES DE MILLONES DE USD)
    19. TABLA 16. ESTIMACIONES Y POTENCIA DEL TAMAÑO DEL MERCADO DE CÁPSULAS DE LAVADO DE CANADÁ. PRONÓSTICO, POR REGIONAL, 2019-2032 (MILES DE MILLONES DE USD)
    20. TABLA 17. ESTIMACIONES Y POTENCIA DEL TAMAÑO DEL MERCADO DE CÁPSULAS DE LAVADO EN EUROPA. PRONÓSTICO, POR APLICACIÓN, 2019-2032 (MILES DE MILLONES DE USD)
    21. TABLA 18. ESTIMACIONES Y TAMAÑO DEL MERCADO DE CÁPSULAS DE LAVADO EN EUROPA. PRONÓSTICO, POR TIPO DE FORMULACIÓN, 2019-2032 (MILES DE MILLONES DE USD)
    22. TABLA 19. ESTIMACIONES Y POTENCIA DEL TAMAÑO DEL MERCADO DE CÁPSULAS DE LAVADO EN EUROPA. PRONÓSTICO, POR CANAL DE DISTRIBUCIÓN, 2019-2032 (MILES DE MILLONES DE USD)
    23. TABLA 20. ESTIMACIONES Y POTENCIA DEL TAMAÑO DEL MERCADO DE CÁPSULAS DE LAVADO EN EUROPA. PRONÓSTICO, POR SEGMENTO DE USO FINAL, 2019-2032 (MILES DE MILLONES DE USD)
    24. TABLA 21. ESTIMACIONES Y POTENCIA DEL TAMAÑO DEL MERCADO DE CÁPSULAS DE LAVADO EN EUROPA. PRONÓSTICO, POR REGIONAL, 2019-2032 (MILES DE MILLONES DE USD)
    25. TABLA 22. ESTIMACIONES Y POTENCIA DEL TAMAÑO DEL MERCADO DE CÁPSULAS DE LAVADO EN ALEMANIA. PRONÓSTICO, POR APLICACIÓN, 2019-2032 (MILES DE MILLONES DE USD)
    26. TABLA 23. ESTIMACIONES Y PRESIONES DEL TAMAÑO DEL MERCADO DE CÁPSULAS DE LAVADO EN ALEMANIA. PRONÓSTICO, POR TIPO DE FORMULACIÓN, 2019-2032 (MILES DE MILLONES DE USD)
    27. TABLA 24. ESTIMACIONES Y POTENCIA DEL TAMAÑO DEL MERCADO DE CÁPSULAS DE LAVADO EN ALEMANIA. PRONÓSTICO, POR CANAL DE DISTRIBUCIÓN, 2019-2032 (MILES DE MILLONES DE USD)
    28. TABLA 25. ESTIMACIONES Y POTENCIA DEL TAMAÑO DEL MERCADO DE CÁPSULAS DE LAVADO EN ALEMANIA. PRONÓSTICO, POR SEGMENTO DE USO FINAL, 2019-2032 (MILES DE MILLONES DE USD)
    29. TABLA 26. ESTIMACIONES Y POTENCIA DEL TAMAÑO DEL MERCADO DE CÁPSULAS DE LAVADO EN ALEMANIA. PRONÓSTICO, POR REGIONAL, 2019-2032 (MILES DE MILLONES DE USD)
    30. TABLA 27. ESTIMACIONES DEL TAMAÑO DEL MERCADO DE CÁPSULAS DE LAVADO EN EL REINO UNIDO Y EFECTOS DE US$ PRONÓSTICO, POR APLICACIÓN, 2019-2032 (MILES DE MILLONES DE USD)
    31. TABLA 28. ESTIMACIONES DEL TAMAÑO DEL MERCADO DE CÁPSULAS DE LAVADO DEL REINO UNIDO Y PREVISIONES. PRONÓSTICO, POR TIPO DE FORMULACIÓN, 2019-2032 (MILES DE MILLONES DE USD)
    32. TABLA 29. ESTIMACIONES Y POTENCIA DEL TAMAÑO DEL MERCADO DE CÁPSULAS DE LAVADO DEL REINO UNIDO. PRONÓSTICO, POR CANAL DE DISTRIBUCIÓN, 2019-2032 (MILES DE MILLONES DE USD)
    33. TABLA 30. ESTIMACIONES DEL TAMAÑO DEL MERCADO DE CÁPSULAS DE LAVADO EN EL REINO UNIDO Y PREVISIÓN. PRONÓSTICO, POR SEGMENTO DE USO FINAL, 2019-2032 (MILES DE MILLONES DE USD)
    34. TABLA 31. ESTIMACIONES Y POTENCIA DEL TAMAÑO DEL MERCADO DE CÁPSULAS DE LAVADO DEL REINO UNIDO. PRONÓSTICO, POR REGIONAL, 2019-2032 (MILES DE MILLONES DE USD)
    35. TABLA 32. ESTIMACIONES Y POTENCIA DEL TAMAÑO DEL MERCADO DE CÁPSULAS DE LAVADO EN FRANCIA. PRONÓSTICO, POR APLICACIÓN, 2019-2032 (MILES DE MILLONES DE USD)
    36. TABLA 33. ESTIMACIONES Y POTENCIA DEL TAMAÑO DEL MERCADO DE CÁPSULAS DE LAVADO EN FRANCIA. PRONÓSTICO, POR TIPO DE FORMULACIÓN, 2019-2032 (MILES DE MILLONES DE USD)
    37. TABLA 34. ESTIMACIONES Y POTENCIA DEL TAMAÑO DEL MERCADO DE CÁPSULAS DE LAVADO EN FRANCIA. PRONÓSTICO, POR CANAL DE DISTRIBUCIÓN, 2019-2032 (MILES DE MILLONES DE USD)
    38. TABLA 35. ESTIMACIONES Y POTENCIA DEL TAMAÑO DEL MERCADO DE CÁPSULAS DE LAVADO EN FRANCIA. PRONÓSTICO, POR SEGMENTO DE USO FINAL, 2019-2032 (MILES DE MILLONES DE USD)
    39. TABLA 36. ESTIMACIONES Y POTENCIA DEL TAMAÑO DEL MERCADO DE CÁPSULAS DE LAVADO EN FRANCIA. PRONÓSTICO, POR REGIONAL, 2019-2032 (MILES DE MILLONES DE USD)
    40. TABLA 37. ESTIMACIONES Y PRESIONES DEL TAMAÑO DEL MERCADO DE CÁPSULAS DE LAVADO EN RUSIA. PRONÓSTICO, POR APLICACIÓN, 2019-2032 (MILES DE MILLONES DE USD)
    41. TABLA 38. ESTIMACIONES Y PRESUPUESTOS DEL TAMAÑO DEL MERCADO DE CÁPSULAS DE LAVADO EN RUSIA. PRONÓSTICO, POR TIPO DE FORMULACIÓN, 2019-2032 (MILES DE MILLONES DE USD)
    42. TABLA 39. ESTIMACIONES DEL TAMAÑO DEL MERCADO DE CÁPSULAS DE LAVADO EN RUSIA Y PREVISIÓN. PRONÓSTICO, POR CANAL DE DISTRIBUCIÓN, 2019-2032 (MILES DE MILLONES DE USD)
    43. TABLA 40. ESTIMACIONES DEL TAMAÑO DEL MERCADO DE CÁPSULAS DE LAVADO EN RUSIA Y PREVISIÓN. PRONÓSTICO, POR SEGMENTO DE USO FINAL, 2019-2032 (MILES DE MILLONES DE USD)
    44. TABLA 41. ESTIMACIONES Y PRESUPUESTOS DEL TAMAÑO DEL MERCADO DE CÁPSULAS DE LAVADO EN RUSIA. PRONÓSTICO, POR REGIONAL, 2019-2032 (MILES DE MILLONES DE USD)
    45. TABLA 42. ESTIMACIONES Y POTENCIA DEL TAMAÑO DEL MERCADO DE CÁPSULAS DE LAVADO EN ITALIA. PRONÓSTICO, POR APLICACIÓN, 2019-2032 (MILES DE MILLONES DE USD)
    46. TABLA 43. ESTIMACIONES Y POTENCIA DEL TAMAÑO DEL MERCADO DE CÁPSULAS DE LAVADO EN ITALIA. PRONÓSTICO, POR TIPO DE FORMULACIÓN, 2019-2032 (MILES DE MILLONES DE USD)
    47. TABLA 44. ESTIMACIONES Y POTENCIA DEL TAMAÑO DEL MERCADO DE CÁPSULAS DE LAVADO EN ITALIA. PRONÓSTICO, POR CANAL DE DISTRIBUCIÓN, 2019-2032 (MILES DE MILLONES DE USD)
    48. TABLA 45. ESTIMACIONES Y POTENCIA DEL TAMAÑO DEL MERCADO DE CÁPSULAS DE LAVADO EN ITALIA. PRONÓSTICO, POR SEGMENTO DE USO FINAL, 2019-2032 (MILES DE MILLONES DE USD)
    49. TABLA 46. ESTIMACIONES Y POTENCIA DEL TAMAÑO DEL MERCADO DE CÁPSULAS DE LAVADO EN ITALIA. PRONÓSTICO, POR REGIONAL, 2019-2032 (MILES DE MILLONES DE USD)
    50. TABLA 47. ESTIMACIONES DEL TAMAÑO DEL MERCADO DE CÁPSULAS DE LAVADO EN ESPAÑA & PRONÓSTICO, POR APLICACIÓN, 2019-2032 (MILES DE MILLONES DE USD)
    51. TABLA 48. ESTIMACIONES DEL TAMAÑO DEL MERCADO DE CÁPSULAS DE LAVADO EN ESPAÑA & PRONÓSTICO, POR TIPO DE FORMULACIÓN, 2019-2032 (MILES DE MILLONES DE USD)
    52. TABLA 49. ESTIMACIONES DEL TAMAÑO DEL MERCADO DE CÁPSULAS DE LAVADO EN ESPAÑA & PREVISIÓN, POR CANAL DE DISTRIBUCIÓN, 2019-2032 (MILES DE MILLONES DE USD)
    53. TABLA 50. ESTIMACIONES DEL TAMAÑO DEL MERCADO DE CÁPSULAS DE LAVADO EN ESPAÑA & PREVISIÓN POR SEGMENTO DE USO FINAL, 2019-2032 (MILLONES DE USD)
    54. TABLA 51. MERCADO DE CÁPSULAS DE LAVADO EN ESPAÑA SIESTIMACIONES ZE & PRONÓSTICO, POR REGIONAL, 2019-2032 (MILES DE MILLONES DE USD)
    55. TABLA 52. ESTIMACIONES Y PRESUPUESTOS DEL TAMAÑO DEL MERCADO DE CÁPSULAS DE LAVADO PARA EL RESTO DE EUROPA. PRONÓSTICO, POR APLICACIÓN, 2019-2032 (MILES DE MILLONES DE USD)
    56. TABLA 53. ESTIMACIONES Y POTENCIA DEL TAMAÑO DEL MERCADO DE CÁPSULAS DE LAVADO PARA EL RESTO DE EUROPA. PRONÓSTICO, POR TIPO DE FORMULACIÓN, 2019-2032 (MILES DE MILLONES DE USD)
    57. TABLA 54. ESTIMACIONES Y PREVISIÓN DEL TAMAÑO DEL MERCADO DE CÁPSULAS DE LAVADO PARA EL RESTO DE EUROPA. PRONÓSTICO, POR CANAL DE DISTRIBUCIÓN, 2019-2032 (MILES DE MILLONES DE USD)
    58. TABLA 55. ESTIMACIONES Y POTENCIA DEL TAMAÑO DEL MERCADO DE CÁPSULAS DE LAVADO PARA EL RESTO DE EUROPA. PRONÓSTICO, POR SEGMENTO DE USO FINAL, 2019-2032 (MILES DE MILLONES DE USD)
    59. TABLA 56. ESTIMACIONES Y POTENCIA DEL TAMAÑO DEL MERCADO DE CÁPSULAS DE LAVADO PARA EL RESTO DE EUROPA. PRONÓSTICO, POR REGIONAL, 2019-2032 (MILES DE MILLONES DE USD)
    60. TABLA 57. ESTIMACIONES Y PRESIONES DEL TAMAÑO DEL MERCADO DE CÁPSULAS DE LAVADO DE APAC. PRONÓSTICO, POR APLICACIÓN, 2019-2032 (MILES DE MILLONES DE USD)
    61. TABLA 58. ESTIMACIONES Y POTENCIA DEL TAMAÑO DEL MERCADO DE CÁPSULAS DE LAVADO DE APAC. PRONÓSTICO, POR TIPO DE FORMULACIÓN, 2019-2032 (MILES DE MILLONES DE USD)
    62. TABLA 59. ESTIMACIONES Y POTENCIA DEL TAMAÑO DEL MERCADO DE CÁPSULAS DE LAVADO DE APAC. PRONÓSTICO, POR CANAL DE DISTRIBUCIÓN, 2019-2032 (MILES DE MILLONES DE USD)
    63. TABLA 60. ESTIMACIONES Y POTENCIA DEL TAMAÑO DEL MERCADO DE CÁPSULAS DE LAVADO DE APAC. PRONÓSTICO, POR SEGMENTO DE USO FINAL, 2019-2032 (MILES DE MILLONES DE USD)
    64. TABLA 61. ESTIMACIONES Y POTENCIA DEL TAMAÑO DEL MERCADO DE CÁPSULAS DE LAVADO DE APAC. PRONÓSTICO, POR REGIONAL, 2019-2032 (MILES DE MILLONES DE USD)
    65. TABLA 62. ESTIMACIONES Y PRESUPUESTOS DEL TAMAÑO DEL MERCADO DE CÁPSULAS DE LAVADO DE CHINA. PRONÓSTICO, POR APLICACIÓN, 2019-2032 (MILES DE MILLONES DE USD)
    66. TABLA 63. ESTIMACIONES Y POTENCIA DEL TAMAÑO DEL MERCADO DE CÁPSULAS DE LAVADO DE CHINA. PRONÓSTICO, POR TIPO DE FORMULACIÓN, 2019-2032 (MILES DE MILLONES DE USD)
    67. TABLA 64. ESTIMACIONES Y PREVISIÓN DEL TAMAÑO DEL MERCADO DE CÁPSULAS DE LAVADO DE CHINA. PRONÓSTICO, POR CANAL DE DISTRIBUCIÓN, 2019-2032 (MILES DE MILLONES DE USD)
    68. TABLA 65. ESTIMACIONES DEL TAMAÑO DEL MERCADO DE CÁPSULAS DE LAVADO DE CHINA Y PREVISIONES. PRONÓSTICO, POR SEGMENTO DE USO FINAL, 2019-2032 (MILES DE MILLONES DE USD)
    69. TABLA 66. ESTIMACIONES DEL TAMAÑO DEL MERCADO DE CÁPSULAS DE LAVADO EN CHINA Y PREVISIONES. PRONÓSTICO, POR REGIONAL, 2019-2032 (MILES DE MILLONES DE USD)
    70. TABLA 67. ESTIMACIONES Y PRESUPUESTOS DEL TAMAÑO DEL MERCADO DE CÁPSULAS DE LAVADO DE LA INDIA. PRONÓSTICO, POR APLICACIÓN, 2019-2032 (MILES DE MILLONES DE USD)
    71. TABLA 68. ESTIMACIONES Y POTENCIA DEL TAMAÑO DEL MERCADO DE CÁPSULAS DE LAVADO DE LA INDIA. PRONÓSTICO, POR TIPO DE FORMULACIÓN, 2019-2032 (MILES DE MILLONES DE USD)
    72. TABLA 69. ESTIMACIONES Y POTENCIA DEL TAMAÑO DEL MERCADO DE CÁPSULAS DE LAVADO DE LA INDIA. PRONÓSTICO, POR CANAL DE DISTRIBUCIÓN, 2019-2032 (MILES DE MILLONES DE USD)
    73. TABLA 70. ESTIMACIONES Y POTENCIA DEL TAMAÑO DEL MERCADO DE CÁPSULAS DE LAVADO DE LA INDIA. PRONÓSTICO, POR SEGMENTO DE USO FINAL, 2019-2032 (MILES DE MILLONES DE USD)
    74. TABLA 71. ESTIMACIONES Y POTENCIA DEL TAMAÑO DEL MERCADO DE CÁPSULAS DE LAVADO DE LA INDIA. PRONÓSTICO, POR REGIONAL, 2019-2032 (MILES DE MILLONES DE USD)
    75. TABLA 72. ESTIMACIONES Y POTENCIA DEL TAMAÑO DEL MERCADO DE CÁPSULAS DE LAVADO EN JAPÓN. PRONÓSTICO, POR APLICACIÓN, 2019-2032 (MILES DE MILLONES DE USD)
    76. TABLA 73. ESTIMACIONES Y POTENCIA DEL TAMAÑO DEL MERCADO DE CÁPSULAS DE LAVADO EN JAPÓN. PRONÓSTICO, POR TIPO DE FORMULACIÓN, 2019-2032 (MILES DE MILLONES DE USD)
    77. TABLA 74. ESTIMACIONES Y POTENCIA DEL TAMAÑO DEL MERCADO DE CÁPSULAS DE LAVADO EN JAPÓN. PRONÓSTICO, POR CANAL DE DISTRIBUCIÓN, 2019-2032 (MILES DE MILLONES DE USD)
    78. TABLA 75. ESTIMACIONES Y POTENCIA DEL TAMAÑO DEL MERCADO DE CÁPSULAS DE LAVADO EN JAPÓN. PRONÓSTICO, POR SEGMENTO DE USO FINAL, 2019-2032 (MILES DE MILLONES DE USD)
    79. TABLA 76. ESTIMACIONES Y POTENCIA DEL TAMAÑO DEL MERCADO DE CÁPSULAS DE LAVADO EN JAPÓN. PRONÓSTICO, POR REGIONAL, 2019-2032 (MILES DE MILLONES DE USD)
    80. TABLA 77. ESTIMACIONES Y POTENCIA DEL TAMAÑO DEL MERCADO DE CÁPSULAS DE LAVADO DE COREA DEL SUR. PRONÓSTICO, POR APLICACIÓN, 2019-2032 (MILES DE MILLONES DE USD)
    81. TABLA 78. ESTIMACIONES Y ESTIMACIONES DEL TAMAÑO DEL MERCADO DE CÁPSULAS DE LAVADO DE COREA DEL SUR. PRONÓSTICO, POR TIPO DE FORMULACIÓN, 2019-2032 (MILES DE MILLONES DE USD)
    82. TABLA 79. ESTIMACIONES Y POTENCIA DEL TAMAÑO DEL MERCADO DE CÁPSULAS DE LAVADO DE COREA DEL SUR. PRONÓSTICO, POR CANAL DE DISTRIBUCIÓN, 2019-2032 (MILES DE MILLONES DE USD)
    83. TABLA 80. ESTIMACIONES Y POTENCIA DEL TAMAÑO DEL MERCADO DE CÁPSULAS DE LAVADO DE COREA DEL SUR. PRONÓSTICO, POR SEGMENTO DE USO FINAL, 2019-2032 (MILES DE MILLONES DE USD)
    84. TABLA 81. ESTIMACIONES Y POTENCIA DEL TAMAÑO DEL MERCADO DE CÁPSULAS DE LAVADO DE COREA DEL SUR. PRONÓSTICO, POR REGIONAL, 2019-2032 (MILES DE MILLONES DE USD)
    85. TABLA 82. ESTIMACIONES Y POTENCIA DEL TAMAÑO DEL MERCADO DE CÁPSULAS DE LAVADO DE MALASIA. PRONÓSTICO, POR APLICACIÓN, 2019-2032 (MILES DE MILLONES DE USD)
    86. TABLA 83. ESTIMACIONES Y POTENCIA DEL TAMAÑO DEL MERCADO DE CÁPSULAS DE LAVADO DE MALASIA. PRONÓSTICO, POR TIPO DE FORMULACIÓN, 2019-2032 (MILES DE MILLONES DE USD)
    87. TABLA 84. ESTIMACIONES Y PREVISIÓN DEL TAMAÑO DEL MERCADO DE CÁPSULAS DE LAVADO DE MALASIA. PRONÓSTICO, POR CANAL DE DISTRIBUCIÓN, 2019-2032 (MILES DE MILLONES DE USD)
    88. TABLA 85. ESTIMACIONES DEL TAMAÑO DEL MERCADO DE CÁPSULAS DE LAVADO EN MALASIA Y PREVISIONES. PRONÓSTICO, POR SEGMENTO DE USO FINAL, 2019-2032 (MILES DE MILLONES DE USD)
    89. TABLA 86. ESTIMACIONES Y ESTIMACIONES DEL TAMAÑO DEL MERCADO DE CÁPSULAS DE LAVADO EN MALASIA. PRONÓSTICO, POR REGIONAL, 2019-2032 (MILES DE MILLONES DE USD)
    90. TABLA 87. ESTIMACIONES Y POTENCIA DEL TAMAÑO DEL MERCADO DE CÁPSULAS DE LAVADO DE TAILANDIA. PRONÓSTICO, POR APLICACIÓN, 2019-2032 (MILES DE MILLONES DE USD)
    91. TABLA 88. ESTIMACIONES DEL TAMAÑO DEL MERCADO DE CÁPSULAS DE LAVADO DE TAILANDIA Y PREVISIONES. PRONÓSTICO, POR TIPO DE FORMULACIÓN, 2019-2032 (MILES DE MILLONES DE USD)
    92. TABLA 89. ESTIMACIONES Y POTENCIA DEL TAMAÑO DEL MERCADO DE CÁPSULAS DE LAVADO DE TAILANDIA PRONÓSTICO, POR CANAL DE DISTRIBUCIÓN, 2019-2032 (MILES DE MILLONES DE USD)
    93. TABLA 90. ESTIMACIONES DEL TAMAÑO DEL MERCADO DE CÁPSULAS DE LAVADO EN TAILANDIA Y PREVISIONES. PRONÓSTICO, POR SEGMENTO DE USO FINAL, 2019-2032 (MILES DE MILLONES DE USD)
    94. TABLA 91. ESTIMACIONES Y POTENCIA DEL TAMAÑO DEL MERCADO DE CÁPSULAS DE LAVADO DE TAILANDIA. PRONÓSTICO, POR REGIONAL, 2019-2032 (MILES DE MILLONES DE USD)
    95. TABLA 92. ESTIMACIONES Y POTENCIA DEL TAMAÑO DEL MERCADO DE CÁPSULAS DE LAVADO DE INDONESIA. PRONÓSTICO, POR APLICACIÓN, 2019-2032 (MILES DE MILLONES DE USD)
    96. TABLA 93. ESTIMACIONES Y POTENCIA DEL TAMAÑO DEL MERCADO DE CÁPSULAS DE LAVADO DE INDONESIA. PRONÓSTICO, POR TIPO DE FORMULACIÓN, 2019-2032 (MILES DE MILLONES DE USD)
    97. TABLA 94. ESTIMACIONES Y POTENCIA DEL TAMAÑO DEL MERCADO DE CÁPSULAS DE LAVADO DE INDONESIA. PRONÓSTICO, POR CANAL DE DISTRIBUCIÓN, 2019-2032 (MILES DE MILLONES DE USD)
    98. TABLA 95. ESTIMACIONES Y POTENCIA DEL TAMAÑO DEL MERCADO DE CÁPSULAS DE LAVADO DE INDONESIA. PRONÓSTICO, POR SEGMENTO DE USO FINAL, 2019-2032 (MILES DE MILLONES DE USD)
    99. TABLA 96. ESTIMACIONES Y POTENCIA DEL TAMAÑO DEL MERCADO DE CÁPSULAS DE LAVADO DE INDONESIA. PRONÓSTICO, POR REGIONAL, 2019-2032 (MILES DE MILLONES DE USD)
    100. TABLA 97. ESTIMACIONES Y PRESIONES DEL TAMAÑO DEL MERCADO DE CÁPSULAS DE LAVADO DEL RESTO DE APAC. PRONÓSTICO, POR APLICACIÓN, 2019-2032 (MILES DE MILLONES DE USD)
    101. TABLA 98. ESTIMACIONES Y PRESIONES DEL TAMAÑO DEL MERCADO DE CÁPSULAS DE LAVADO DEL RESTO DE APAC. PRONÓSTICO, POR TIPO DE FORMULACIÓN, 2019-2032 (MILES DE MILLONES DE USD)
    102. TABLA 99. ESTIMACIONES Y PRESIONES DEL TAMAÑO DEL MERCADO DE CÁPSULAS DE LAVADO DEL RESTO DE APAC. PRONÓSTICO, POR CANAL DE DISTRIBUCIÓN, 2019-2032 (MILES DE MILLONES DE USD)
    103. TABLA 100. ESTIMACIONES Y PRESIONES DEL TAMAÑO DEL MERCADO DE CÁPSULAS DE LAVADO DEL RESTO DE APAC. PRONÓSTICO, POR SEGMENTO DE USO FINAL, 2019-2032 (MILES DE MILLONES DE USD)
    104. TABLA 101. ESTIMACIONES Y PREVISIÓN DEL TAMAÑO DEL MERCADO DE CÁPSULAS DE LAVADO DEL RESTO DE APAC. PRONÓSTICO, POR REGIONAL, 2019-2032 (MILES DE MILLONES DE USD)
    105. TABLA 102. ESTIMACIONES Y PRESIONES DEL TAMAÑO DEL MERCADO DE CÁPSULAS DE LAVADO EN AMÉRICA DEL SUR. PRONÓSTICO, POR APLICACIÓN, 2019-2032 (MILES DE MILLONES DE USD)
    106. TABLA 103. ESTIMACIONES Y ESTIMACIONES DEL TAMAÑO DEL MERCADO DE CÁPSULAS DE LAVADO EN AMÉRICA DEL SUR. PRONÓSTICO, POR TIPO DE FORMULACIÓN, 2019-2032 (MILES DE MILLONES DE USD)
    107. TABLA 104. ESTIMACIONES Y POTENCIA DEL TAMAÑO DEL MERCADO DE CÁPSULAS DE LAVADO EN AMÉRICA DEL SUR. PRONÓSTICO, POR CANAL DE DISTRIBUCIÓN, 2019-2032 (MILES DE MILLONES DE USD)
    108. TABLA 105. ESTIMACIONES Y POTENCIA DEL TAMAÑO DEL MERCADO DE CÁPSULAS DE LAVADO EN AMÉRICA DEL SUR. PRONÓSTICO, POR SEGMENTO DE USO FINAL, 2019-2032 (MILES DE MILLONES DE USD)
    109. TABLA 106. ESTIMACIONES Y POTENCIA DEL TAMAÑO DEL MERCADO DE CÁPSULAS DE LAVADO EN AMÉRICA DEL SUR. PRONÓSTICO, POR REGIONAL, 2019-2032 (MILES DE MILLONES DE USD)
    110. TABLA 107. ESTIMACIONES Y POTENCIAS DEL TAMAÑO DEL MERCADO DE CÁPSULAS DE LAVADO EN BRASIL. PRONÓSTICO, POR APLICACIÓN, 2019-2032 (MILES DE MILLONES DE USD)
    111. TABLA 108. ESTIMACIONES Y POTENCIA DEL TAMAÑO DEL MERCADO DE CÁPSULAS DE LAVADO DE BRASIL. PRONÓSTICO, POR TIPO DE FORMULACIÓN, 2019-2032 (MILES DE MILLONES DE USD)
    112. TABLA 109. ESTIMACIONES Y POTENCIA DEL TAMAÑO DEL MERCADO DE CÁPSULAS DE LAVADO EN BRASIL. PRONÓSTICO, POR CANAL DE DISTRIBUCIÓN, 2019-2032 (MILES DE MILLONES DE USD)
    113. TABLA 110. ESTIMACIONES DEL TAMAÑO DEL MERCADO DE CÁPSULAS DE LAVADO EN BRASIL Y EMPRESAS. PRONÓSTICO, POR SEGMENTO DE USO FINAL, 2019-2032 (MILES DE MILLONES DE USD)
    114. TABLA 111. ESTIMACIONES Y POTENCIA DEL TAMAÑO DEL MERCADO DE CÁPSULAS DE LAVADO EN BRASIL. PRONÓSTICO, POR REGIONAL, 2019-2032 (MILES DE MILLONES DE USD)
    115. TABLA 112. ESTIMACIONES Y PRESIONES DEL TAMAÑO DEL MERCADO DE CÁPSULAS DE LAVADO EN MÉXICO. PRONÓSTICO, POR APLICACIÓN, 2019-2032 (MILES DE MILLONES DE USD)
    116. TABLA 113. ESTIMACIONES Y PRESENTACIÓN DEL TAMAÑO DEL MERCADO DE CÁPSULAS DE LAVADO EN MÉXICO. PRONÓSTICO, POR TIPO DE FORMULACIÓN, 2019-2032 (MILES DE MILLONES DE USD)
    117. TABLA 114. ESTIMACIONES Y POTENCIA DEL TAMAÑO DEL MERCADO DE CÁPSULAS DE LAVADO EN MÉXICO. PRONÓSTICO, POR CANAL DE DISTRIBUCIÓN, 2019-2032 (MILES DE MILLONES DE USD)
    118. TABLA 115. ESTIMACIONES Y POTENCIA DEL TAMAÑO DEL MERCADO DE CÁPSULAS DE LAVADO EN MÉXICO. PRONÓSTICO, POR SEGMENTO DE USO FINAL, 2019-2032 (MILES DE MILLONES DE USD)
    119. TABLA 116. ESTIMACIONES Y POTENCIA DEL TAMAÑO DEL MERCADO DE CÁPSULAS DE LAVADO EN MÉXICO. PRONÓSTICO, POR REGIONAL, 2019-2032 (MILES DE MILLONES DE USD)
    120. TABLA 117. ESTIMACIONES Y PRESUPUESTOS DEL TAMAÑO DEL MERCADO DE CÁPSULAS DE LAVADO EN ARGENTINA. PRONÓSTICO, POR APLICACIÓN, 2019-2032 (MILES DE MILLONES DE USD)
    121. TABLA 118. ESTIMACIONES Y POTENCIA DEL TAMAÑO DEL MERCADO DE CÁPSULAS DE LAVADO EN ARGENTINA. PRONÓSTICO, POR TIPO DE FORMULACIÓN, 2019-2032 (MILES DE MILLONES DE USD)
    122. TABLA 119. ESTIMACIONES Y POTENCIA DEL TAMAÑO DEL MERCADO DE CÁPSULAS DE LAVADO EN ARGENTINA. PRONÓSTICO, POR CANAL DE DISTRIBUCIÓN, 2019-2032 (MILES DE MILLONES DE USD)
    123. TABLA 120. ESTIMACIONES Y POTENCIA DEL TAMAÑO DEL MERCADO DE CÁPSULAS DE LAVADO EN ARGENTINA. PRONÓSTICO, POR SEGMENTO DE USO FINAL, 2019-2032 (MILES DE MILLONES DE USD)
    124. TABLA 121. ESTIMACIONES Y POTENCIA DEL TAMAÑO DEL MERCADO DE CÁPSULAS DE LAVADO EN ARGENTINA. PRONÓSTICO, POR REGIONAL, 2019-2032 (MILES DE MILLONES DE USD)
    125. TABLA 122. ESTIMACIONES Y PRESIONES DEL TAMAÑO DEL MERCADO DE CÁPSULAS DE LAVADO PARA EL RESTO DE SUDAMÉRICA. PRONÓSTICO, POR APLICACIÓN, 2019-2032 (MILES DE MILLONES DE USD)
    126. TABLA 123. ESTIMACIONES Y ESTIMACIONES DEL TAMAÑO DEL MERCADO DE CÁPSULAS DE LAVADO PARA EL RESTO DE SUDAMÉRICA. PRONÓSTICO, POR TIPO DE FORMULACIÓN, 2019-2032 (MILES DE MILLONES DE USD)
    127. TABLA 124. ESTIMACIONES Y ESTIMACIONES DEL TAMAÑO DEL MERCADO DE CÁPSULAS DE LAVADO PARA EL RESTO DE SUDAMÉRICA. PRONÓSTICO, POR CANAL DE DISTRIBUCIÓN, 2019-2032 (MILES DE MILLONES DE USD)
    128. TABLA 125. ESTIMACIONES Y ESTIMACIONES DEL TAMAÑO DEL MERCADO DE CÁPSULAS DE LAVADO PARA EL RESTO DE SUDAMÉRICA. PRONÓSTICO, POR SEGMENTO DE USO FINAL, 2019-2032 (MILES DE MILLONES DE USD)
    129. TABLA 126. ESTIMACIONES Y ESTIMACIONES DEL TAMAÑO DEL MERCADO DE CÁPSULAS DE LAVADO PARA EL RESTO DE SUDAMÉRICA. PRONÓSTICO, POR REGIONAL, 2019-2032 (MILES DE MILLONES DE USD)
    130. TABLA 127. ESTIMACIONES Y POTENCIA DEL TAMAÑO DEL MERCADO DE CÁPSULAS DE LAVADO DE MEA. PRONÓSTICO, POR APLICACIÓN, 2019-2032 (MILES DE MILLONES DE USD)
    131. TABLA 128. ESTIMACIONES Y PRECIO DEL TAMAÑO DEL MERCADO DE CÁPSULAS DE LAVADO DE MEA. PRONÓSTICO, POR TIPO DE FORMULACIÓN, 2019-2032 (MILES DE MILLONES DE USD)
    132. TABLA 129. ESTIMACIONES Y POTENCIA DEL TAMAÑO DEL MERCADO DE CÁPSULAS DE LAVADO DE MEA. PRONÓSTICO, POR CANAL DE DISTRIBUCIÓN, 2019-2032 (MILES DE MILLONES DE USD)
    133. TABLA 130. ESTIMACIONES Y POTENCIA DEL TAMAÑO DEL MERCADO DE CÁPSULAS DE LAVADO DE MEA. PRONÓSTICO, POR SEGMENTO DE USO FINAL, 2019-2032 (MILES DE MILLONES DE USD)
    134. TABLA 131. ESTIMACIONES Y POTENCIA DEL TAMAÑO DEL MERCADO DE CÁPSULAS DE LAVADO DE MEA. PRONÓSTICO, POR REGIONAL, 2019-2032 (MILES DE MILLONES DE USD)
    135. TABLA 132. ESTIMACIONES Y POTENCIAS DEL TAMAÑO DEL MERCADO DE CÁPSULAS DE LAVADO DE LOS PAÍSES DEL CCG. PRONÓSTICO, POR APLICACIÓN, 2019-2032 (MILES DE MILLONES DE USD)
    136. TABLA 133. ESTIMACIONES Y PRESIONES DEL TAMAÑO DEL MERCADO DE CÁPSULAS DE LAVADO DE LOS PAÍSES DEL CCG. PRONÓSTICO, POR TIPO DE FORMULACIÓN, 2019-2032 (MILES DE MILLONES DE USD)
    137. TABLA 134. ESTIMACIONES Y PREVISIÓN DEL TAMAÑO DEL MERCADO DE CÁPSULAS DE LAVADO DE LOS PAÍSES DEL CCG. PRONÓSTICO, POR CANAL DE DISTRIBUCIÓN, 2019-2032 (MILES DE MILLONES DE USD)
    138. TABLA 135. ESTIMACIONES Y POTENCIAS DEL TAMAÑO DEL MERCADO DE CÁPSULAS DE LAVADO DE LOS PAÍSES DEL CCG. PRONÓSTICO, POR SEGMENTO DE USO FINAL, 2019-2032 (MILES DE MILLONES DE USD)
    139. TABLA 136. ESTIMACIONES Y POTENCIAS DEL TAMAÑO DEL MERCADO DE CÁPSULAS DE LAVADO DE LOS PAÍSES DEL CCG. PRONÓSTICO, POR REGIONAL, 2019-2032 (MILES DE MILLONES DE USD)
    140. TABLA 137. ESTIMACIONES Y PRESIONES DEL TAMAÑO DEL MERCADO DE CÁPSULAS DE LAVADO EN SUDÁFRICA. PRONÓSTICO, POR APLICACIÓN, 2019-2032 (MILES DE MILLONES DE USD)
    141. TABLA 138. ESTIMACIONES Y POTENCIA DEL TAMAÑO DEL MERCADO DE CÁPSULAS DE LAVADO EN SUDÁFRICA. PRONÓSTICO, POR TIPO DE FORMULACIÓN, 2019-2032 (MILES DE MILLONES DE USD)
    142. TABLA 139. ESTIMACIONES Y PREVISIÓN DEL TAMAÑO DEL MERCADO DE CÁPSULAS DE LAVADO EN SUDÁFRICA. PRONÓSTICO, POR CANAL DE DISTRIBUCIÓN, 2019-2032 (MILES DE MILLONES DE USD)
    143. TABLA 140. ESTIMACIONES Y POTENCIA DEL TAMAÑO DEL MERCADO DE CÁPSULAS DE LAVADO EN SUDÁFRICA. PRONÓSTICO, POR SEGMENTO DE USO FINAL, 2019-2032 (MILES DE MILLONES DE USD)
    144. TABLA 141. ESTIMACIONES Y PRESENTACIÓN DEL TAMAÑO DEL MERCADO DE CÁPSULAS DE LAVADO EN SUDÁFRICA. PRONÓSTICO, POR REGIONAL, 2019-2032 (MILES DE MILLONES DE USD)
    145. TABLA 142. ESTIMACIONES Y PRESIONES DEL TAMAÑO DEL MERCADO DEL RESTO DE LAS CÁPSULAS DE LAVADO DE MEA. PRONÓSTICO, POR APLICACIÓN, 2019-2032 (MILES DE MILLONES DE USD)
    146. TABLA 143. ESTIMACIONES Y PRESIONES DEL TAMAÑO DEL MERCADO DEL RESTO DE CÁPSULAS DE LAVADO DE MEA. PRONÓSTICO, POR TIPO DE FORMULACIÓN, 2019-2032 (MILES DE MILLONES DE USD)
    147. TABLA 144. ESTIMACIONES Y PRONÓSTICOS DEL TAMAÑO DEL MERCADO DEL RESTO DE CÁPSULAS DE LAVADO DE MEA. PRONÓSTICO, POR CANAL DE DISTRIBUCIÓN, 2019-2032 (MILES DE MILLONES DE USD)
    148. TABLA 145. ESTIMACIONES Y PRESIONES DEL TAMAÑO DEL MERCADO DEL RESTO DE CÁPSULAS DE LAVADO DE MEA. PRONÓSTICO, POR SEGMENTO DE USO FINAL, 2019-2032 (MILES DE MILLONES DE USD)
    149. TABLA 146. ESTIMACIONES Y PRESIONES DEL TAMAÑO DEL MERCADO DEL RESTO DE CÁPSULAS DE LAVADO DE MEA. PRONÓSTICO, POR REGIONAL, 2019-2032 (MILES DE MILLONES DE USD)
    150. TABLA 147. LANZAMIENTO/DESARROLLO/APROBACIÓN DE PRODUCTOS
    151. TABLA 148. ADQUISICIÓNION/ASOCIACIÓN
    152. LISTA DE FIGURAS
    153. FIGURA 1. SINOPSIS DEL MERCADO
    154. FIGURA 2. ANÁLISIS DEL MERCADO DE CÁPSULAS DE LAVADO EN AMÉRICA DEL NORTE
    155. FIGURA 3. ANÁLISIS DEL MERCADO DE CÁPSULAS DE LAVADO EN EE.UU. POR APLICACIÓN
    156. FIGURA 4. ANÁLISIS DEL MERCADO DE CÁPSULAS DE LAVADO EN EE.UU. POR TIPO DE FORMULACIÓN
    157. FIGURA 5 MERCADO DE CÁPSULAS DE LAVADO DE EE. UU. ANÁLISIS POR CANAL DE DISTRIBUCIÓN
    158. FIGURA 6. ANÁLISIS DEL MERCADO DE CÁPSULAS DE LAVADO DE EE. UU. POR SEGMENTO DE USO FINAL
    159. FIGURA 7. ANÁLISIS DEL MERCADO DE CÁPSULAS DE LAVADO DE EE. UU. POR REGIONAL
    160. FIGURA 8. ANÁLISIS DEL MERCADO DE CÁPSULAS DE LAVADO DE CANADÁ POR APLICACIÓN
    161. FIGURA 9. LAVADO EN CANADÁ ANÁLISIS DEL MERCADO DE CÁPSULAS POR TIPO DE FORMULACIÓN
    162. FIGURA 10. ANÁLISIS DEL MERCADO DE CÁPSULAS DE LAVADO EN CANADÁ POR CANAL DE DISTRIBUCIÓN
    163. FIGURA 11. ANÁLISIS DEL MERCADO DE CÁPSULAS DE LAVADO EN CANADÁ POR SEGMENTO DE USO FINAL
    164. FIGURA 12. ANÁLISIS DEL MERCADO DE CÁPSULAS DE LAVADO EN CANADÁ POR REGIONALES
    165. />FIGURA 13. ANÁLISIS DEL MERCADO DE CÁPSULAS DE LAVADO EN EUROPA
    166. FIGURA 14. ANÁLISIS DEL MERCADO DE CÁPSULAS DE LAVADO EN ALEMANIA POR APLICACIÓN
    167. FIGURA 15. ANÁLISIS DEL MERCADO DE CÁPSULAS DE LAVADO EN ALEMANIA POR TIPO DE FORMULACIÓN
    168. FIGURA 16. MERCADO DE CÁPSULAS DE LAVADO EN ALEMANIA ANÁLISIS POR CANAL DE DISTRIBUCIÓN
    169. FIGURA 17. ANÁLISIS DEL MERCADO DE CÁPSULAS DE LAVADO EN ALEMANIA POR SEGMENTO DE USO FINAL
    170. FIGURA 18. ANÁLISIS DEL MERCADO DE CÁPSULAS DE LAVADO EN ALEMANIA POR REGIONAL
    171. FIGURA 19. ANÁLISIS DEL MERCADO DE CÁPSULAS DE LAVADO EN REINO UNIDO POR APLICACIÓN
    172. FIGURA 20. LAVADO EN EL REINO UNIDO ANÁLISIS DEL MERCADO DE CÁPSULAS POR TIPO DE FORMULACIÓN
    173. FIGURA 21. ANÁLISIS DEL MERCADO DE CÁPSULAS DE LAVADO DEL REINO UNIDO POR CANAL DE DISTRIBUCIÓN
    174. FIGURA 22. ANÁLISIS DEL MERCADO DE CÁPSULAS DE LAVADO DEL REINO UNIDO POR SEGMENTO DE USO FINAL
    175. FIGURA 23. ANÁLISIS DEL MERCADO DE CÁPSULAS DE LAVADO DEL REINO UNIDO POR REGIONALES
    176. />FIGURA 24. ANÁLISIS DEL MERCADO DE CÁPSULAS DE LAVADO EN FRANCIA POR APLICACIÓN
    177. FIGURA 25. ANÁLISIS DEL MERCADO DE CÁPSULAS DE LAVADO EN FRANCIA POR TIPO DE FORMULACIÓN
    178. FIGURA 26. ANÁLISIS DEL MERCADO DE CÁPSULAS DE LAVADO EN FRANCIA POR CANAL DE DISTRIBUCIÓN
    179. FIGURA 27. FRANCIA MERCADO DE CÁPSULAS DE LAVADO ANÁLISIS POR SEGMENTO DE USO FINAL
    180. FIGURA 28. ANÁLISIS DEL MERCADO DE CÁPSULAS DE LAVADO EN FRANCIA POR REGIONAL
    181. FIGURA 29. ANÁLISIS DEL MERCADO DE CÁPSULAS DE LAVADO EN RUSIA POR APLICACIÓN
    182. FIGURA 30. ANÁLISIS DEL MERCADO DE CÁPSULAS DE LAVADO EN RUSIA POR TIPO DE FORMULACIÓN
    183. FIGURA 31. ANÁLISIS DEL MERCADO DE CÁPSULAS DE LAVADO EN RUSIA POR CANAL DE DISTRIBUCIÓN
    184. FIGURA 32. ANÁLISIS DEL MERCADO DE CÁPSULAS DE LAVADO EN RUSIA POR SEGMENTO DE USO FINAL
    185. FIGURA 33. ANÁLISIS DEL MERCADO DE CÁPSULAS DE LAVADO EN RUSIA POR REGIONAL
    186. FIGURA 34. CÁPSULAS DE LAVADO EN ITALIA ANÁLISIS DE MERCADO POR APLICACIÓN
    187. FIGURA 35. ANÁLISIS DEL MERCADO DE CÁPSULAS DE LAVADO EN ITALIA POR TIPO DE FORMULACIÓN
    188. FIGURA 36. ANÁLISIS DEL MERCADO DE CÁPSULAS DE LAVADO EN ITALIA POR CANAL DE DISTRIBUCIÓN
    189. FIGURA 37. ANÁLISIS DEL MERCADO DE CÁPSULAS DE LAVADO EN ITALIA POR SEGMENTO DE USO FINAL
    190. />FIGURA 38. ANÁLISIS DEL MERCADO DE CÁPSULAS DE LAVADO EN ITALIA POR REGIONAL
    191. FIGURA 39. ANÁLISIS DEL MERCADO DE CÁPSULAS DE LAVADO EN ESPAÑA POR APLICACIÓN
    192. FIGURA 40. ANÁLISIS DEL MERCADO DE CÁPSULAS DE LAVADO EN ESPAÑA POR TIPO DE FORMULACIÓN
    193. FIGURA 41. LAVADO EN ESPAÑA MERCADO DE CÁPSULAS ANÁLISIS POR CANAL DE DISTRIBUCIÓN
    194. GRÁFICO 42. ANÁLISIS DEL MERCADO DE CÁPSULAS DE LAVADO EN ESPAÑA POR SEGMENTO DE USO FINAL
    195. GRÁFICO 43. ANÁLISIS DEL MERCADO DE CÁPSULAS DE LAVADO EN ESPAÑA POR REGIONAL
    196. GRÁFICO 44. ANÁLISIS DEL MERCADO DE CÁPSULAS DE LAVADO EN ESPAÑA POR APLICACIÓN
    197. FIGURA 45. ANÁLISIS DEL MERCADO DE CÁPSULAS DE LAVADO DEL RESTO DE EUROPA POR TIPO DE FORMULACIÓN
    198. FIGURA 46. ANÁLISIS DEL MERCADO DE CÁPSULAS DE LAVADO DEL RESTO DE EUROPA POR CANAL DE DISTRIBUCIÓN
    199. FIGURA 47. ANÁLISIS DEL MERCADO DE CÁPSULAS DE LAVADO DEL RESTO DE EUROPA POR SEGMENTO DE USO FINAL
    200. FIGURA 48. RESTO DE ANÁLISIS DEL MERCADO DE CÁPSULAS DE LAVADO EN EUROPA POR REGIONAL
    201. FIGURA 49. ANÁLISIS DEL MERCADO DE CÁPSULAS DE LAVADO EN APAC
    202. FIGURA 50. ANÁLISIS DEL MERCADO DE CÁPSULAS DE LAVADO EN CHINA POR APLICACIÓN
    203. FIGURA 51. ANÁLISIS DEL MERCADO DE CÁPSULAS DE LAVADO EN CHINA POR TIPO DE FORMULACIÓN
    204. FIGURA 52. ANÁLISIS DEL MERCADO DE CÁPSULAS DE LAVADO DE CHINA POR CANAL DE DISTRIBUCIÓN
    205. FIGURA 53. ANÁLISIS DEL MERCADO DE CÁPSULAS DE LAVADO DE CHINA POR SEGMENTO DE USO FINAL
    206. FIGURA 54. ANÁLISIS DEL MERCADO DE CÁPSULAS DE LAVADO DE CHINA POR REGIONAL
    207. FIGURA 55. CÁPSULAS DE LAVADO DE INDIA ANÁLISIS DE MERCADO POR APLICACIÓN
    208. FIGURA 56. ANÁLISIS DEL MERCADO DE CÁPSULAS DE LAVADO DE LA INDIA POR TIPO DE FORMULACIÓN
    209. FIGURA 57. ANÁLISIS DEL MERCADO DE CÁPSULAS DE LAVADO DE LA INDIA POR CANAL DE DISTRIBUCIÓN
    210. FIGURA 58. ANÁLISIS DEL MERCADO DE CÁPSULAS DE LAVADO DE LA INDIA POR SEGMENTO DE USO FINAL
    211. GRÁFICO 59. INDIA ANÁLISIS DEL MERCADO DE CÁPSULAS DE LAVADO POR REGIONAL
    212. FIGURA 60. ANÁLISIS DEL MERCADO DE CÁPSULAS DE LAVADO EN JAPÓN POR APLICACIÓN
    213. FIGURA 61. ANÁLISIS DEL MERCADO DE CÁPSULAS DE LAVADO EN JAPÓN POR TIPO DE FORMULACIÓN
    214. FIGURA 62. ANÁLISIS DEL MERCADO DE CÁPSULAS DE LAVADO EN JAPÓN POR CANAL DE DISTRIBUCIÓN
    215. />FIGURA 63. ANÁLISIS DEL MERCADO DE CÁPSULAS DE LAVADO EN JAPÓN POR SEGMENTO DE USO FINAL
    216. FIGURA 64. ANÁLISIS DEL MERCADO DE CÁPSULAS DE LAVADO EN JAPÓN POR REGIONAL
    217. FIGURA 65. ANÁLISIS DEL MERCADO DE CÁPSULAS DE LAVADO EN COREA DEL SUR POR APLICACIÓN
    218. FIGURA 66. CÁPSULA DE LAVADO DE COREA DEL SUR ANÁLISIS DE MERCADO POR TIPO DE FORMULACIÓN
    219. FIGURA 67. ANÁLISIS DEL MERCADO DE CÁPSULAS DE LAVADO DE COREA DEL SUR POR CANAL DE DISTRIBUCIÓN
    220. FIGURA 68. ANÁLISIS DEL MERCADO DE CÁPSULAS DE LAVADO DE COREA DEL SUR POR SEGMENTO DE USO FINAL
    221. FIGURA 69. MERCADO DE CÁPSULAS DE LAVADO DE COREA DEL SUR ANÁLISIS POR REGIONAL
    222. FIGURA 70. ANÁLISIS DEL MERCADO DE CÁPSULAS DE LAVADO DE MALASIA POR APLICACIÓN
    223. FIGURA 71. ANÁLISIS DEL MERCADO DE CÁPSULAS DE LAVADO DE MALASIA POR TIPO DE FORMULACIÓN
    224. FIGURA 72. ANÁLISIS DEL MERCADO DE CÁPSULAS DE LAVADO DE MALASIA POR CANAL DE DISTRIBUCIÓN
    225. CIFRA 73. ANÁLISIS DEL MERCADO DE CÁPSULAS DE LAVADO DE MALASIA POR SEGMENTO DE USO FINAL
    226. FIGURA 74. ANÁLISIS DEL MERCADO DE CÁPSULAS DE LAVADO DE MALASIA POR REGIONAL
    227. FIGURA 75. ANÁLISIS DEL MERCADO DE CÁPSULAS DE LAVADO DE TAILANDIA POR APLICACIÓN
    228. FIGURA 76. MERCADO DE CÁPSULAS DE LAVADO DE TAILANDIA ANÁLISIS POR TIPO DE FORMULACIÓN
    229. FIGURA 77. ANÁLISIS DEL MERCADO DE CÁPSULAS DE LAVADO DE TAILANDIA POR CANAL DE DISTRIBUCIÓN
    230. FIGURA 78. ANÁLISIS DEL MERCADO DE CÁPSULAS DE LAVADO DE TAILANDIA POR SEGMENTO DE USO FINAL
    231. FIGURA 79. ANÁLISIS DEL MERCADO DE CÁPSULAS DE LAVADO DE TAILANDIA POR REGIONAL FIGURA 80. ANÁLISIS DEL MERCADO DE CÁPSULAS DE LAVADO EN INDONESIA POR APLICACIÓN
    232. FIGURA 81. ANÁLISIS DEL MERCADO DE CÁPSULAS DE LAVADO EN INDONESIA POR TIPO DE FORMULACIÓN
    233. FIGURA 82. ANÁLISIS DEL MERCADO DE CÁPSULAS DE LAVADO EN INDONESIA POR CANAL DE DISTRIBUCIÓN
    234. FIGURA 83. INDONESIA ANÁLISIS DEL MERCADO DE CÁPSULAS DE LAVADO POR SEGMENTO DE USO FINAL
    235. FIGURA 84. ANÁLISIS DEL MERCADO DE CÁPSULAS DE LAVADO EN INDONESIA POR REGIONAL
    236. FIGURA 85. ANÁLISIS DEL MERCADO DE CÁPSULAS DE LAVADO DEL RESTO DE APAC POR APLICACIÓN
    237. FIGURA 86. RESTO DE CÁPSULAS DE LAVADO DE APAC ANÁLISIS DE MERCADO POR TIPO DE FORMULACIÓN
    238. FIGURA 87. ANÁLISIS DEL MERCADO DEL RESTO DE CÁPSULAS DE LAVADO DE APAC POR CANAL DE DISTRIBUCIÓN
    239. FIGURA 88. ANÁLISIS DEL MERCADO DE CÁPSULAS DE LAVADO DEL RESTO DE APAC POR SEGMENTO DE USO FINAL
    240. FIGURA 89. MERCADO DEL RESTO DE CÁPSULAS DE LAVADO DE APAC ANÁLISIS POR REGIONALES
    241. />FIGURA 90. ANÁLISIS DEL MERCADO DE CÁPSULAS DE LAVADO EN AMÉRICA DEL SUR
    242. FIGURA 91. ANÁLISIS DEL MERCADO DE CÁPSULAS DE LAVADO EN BRASIL POR APLICACIÓN
    243. FIGURA 92. ANÁLISIS DEL MERCADO DE CÁPSULAS DE LAVADO EN BRASIL POR TIPO DE FORMULACIÓN
    244. FIGURA 93. CÁPSULAS DE LAVADO EN BRASIL MERCADO ANÁLISIS POR CANAL DE DISTRIBUCIÓN
    245. GRÁFICO 94. ANÁLISIS DEL MERCADO DE CÁPSULAS DE LAVADO EN BRASIL POR SEGMENTO DE USO FINAL
    246. GRÁFICO 95. ANÁLISIS DEL MERCADO DE CÁPSULAS DE LAVADO EN BRASIL POR REGIONAL
    247. GRÁFICO 96. ANÁLISIS DEL MERCADO DE CÁPSULAS DE LAVADO EN MÉXICO POR APLICACIÓN
    248. FIGURA 97. ANÁLISIS DEL MERCADO DE CÁPSULAS DE LAVADO EN MÉXICO POR TIPO DE FORMULACIÓN
    249. FIGURA 98. ANÁLISIS DEL MERCADO DE CÁPSULAS DE LAVADO EN MÉXICO POR CANAL DE DISTRIBUCIÓN
    250. FIGURA 99. ANÁLISIS DEL MERCADO DE CÁPSULAS DE LAVADO EN MÉXICO POR SEGMENTO DE USO FINAL
    251. FIGURA 100. LAVADO EN MÉXICO ANÁLISIS DEL MERCADO DE CÁPSULAS POR REGIONAL
    252. GRÁFICO 101. ANÁLISIS DEL MERCADO DE CÁPSULAS DE LAVADO EN ARGENTINA POR APLICACIÓN
    253. FIGURA 102. ANÁLISIS DEL MERCADO DE CÁPSULAS DE LAVADO EN ARGENTINA POR TIPO DE FORMULACIÓN
    254. FIGURA 103. ANÁLISIS DEL MERCADO DE CÁPSULAS DE LAVADO EN ARGENTINA POR DISTRIBUCIÓN CANAL
    255. FIGURA 104. ANÁLISIS DEL MERCADO DE CÁPSULAS DE LAVADO EN ARGENTINA POR SEGMENTO DE USO FINAL
    256. FIGURA 105. ANÁLISIS DEL MERCADO DE CÁPSULAS DE LAVADO EN ARGENTINA POR REGIONAL
    257. FIGURA 106. ANÁLISIS DEL MERCADO DE CÁPSULAS DE LAVADO EN ARGENTINA POR APLICACIÓN
    258. />FIGURA 107. ANÁLISIS DEL MERCADO DE CÁPSULAS DE LAVADO DEL RESTO DE SUDAMÉRICA POR TIPO DE FORMULACIÓN
    259. FIGURA 108. ANÁLISIS DEL MERCADO DE CÁPSULAS DE LAVADO DEL RESTO DE AMÉRICA DEL SUR POR CANAL DE DISTRIBUCIÓN
    260. FIGURA 109. ANÁLISIS DEL MERCADO DE CÁPSULAS DE LAVADO DEL RESTO DE AMÉRICA DEL SUR POR USO FINAL SEGMENTO
    261. FIGURA 110. ANÁLISIS DEL MERCADO DE CÁPSULAS DE LAVADO DEL RESTO DE SUDAMÉRICA POR REGIONAL
    262. FIGURA 111. ANÁLISIS DEL MERCADO DE CÁPSULAS DE LAVADO DE MEA
    263. FIGURA 112. ANÁLISIS DEL MERCADO DE CÁPSULAS DE LAVADO DE LOS PAÍSES DEL CCG POR APLICACIÓN
    264. FIGURA 113. CCG PAÍSES ANÁLISIS DEL MERCADO DE CÁPSULAS DE LAVADO POR TIPO DE FORMULACIÓN
    265. FIGURA 114. PAÍSES DEL CCG ANÁLISIS DEL MERCADO DE CÁPSULAS DE LAVADO POR CANAL DE DISTRIBUCIÓN
    266. FIGURA 115. PAÍSES DEL CCG ANÁLISIS DEL MERCADO DE CÁPSULAS DE LAVADO POR SEGMENTO DE USO FINAL
    267. FIGURA 116. PAÍSES DEL CCG ANÁLISIS DEL MERCADO DE CÁPSULAS DE LAVADO POR REGIONAL
    268. FIGURA 117. ANÁLISIS DEL MERCADO DE CÁPSULAS DE LAVADO EN SUDÁFRICA POR APLICACIÓN
    269. FIGURA 118. ANÁLISIS DEL MERCADO DE CÁPSULAS DE LAVADO EN SUDÁFRICA POR TIPO DE FORMULACIÓN
    270. FIGURA 119. MERCADO DE CÁPSULAS DE LAVADO EN SUDÁFRICA ANÁLISIS POR CANAL DE DISTRIBUCIÓN
    271. FIGURA 120. ANÁLISIS DEL MERCADO DE CÁPSULAS DE LAVADO EN SUDÁFRICA POR SEGMENTO DE USO FINAL
    272. FIGURA 121. ANÁLISIS DEL MERCADO DE CÁPSULAS DE LAVADO EN SUDÁFRICA POR REGIONAL
    273. FIGURA 122. ANÁLISIS DEL MERCADO DEL RESTO DE CÁPSULAS DE LAVADO DE MEA POR APLICACIÓN
    274. FIGURA 123. ANÁLISIS DEL MERCADO RESTO DE CÁPSULAS DE LAVADO DE MEA POR TIPO DE FORMULACIÓN
    275. FIGURA 124. ANÁLISIS DEL MERCADO DE RESTO DE CÁPSULAS DE LAVADO DE MEA POR CANAL DE DISTRIBUCIÓN
    276. FIGURA 125. ANÁLISIS DEL MERCADO DEL RESTO DE CÁPSULAS DE LAVADO DE MEA POR FINAL USO DE SEGMENTO
    277. FIGURA 126. ANÁLISIS DEL MERCADO DEL RESTO DE CÁPSULAS DE LAVADO DE MEA POR REGIONAL
    278. FIGURA 127. CRITERIOS CLAVE DE COMPRA DEL MERCADO DE CÁPSULAS DE LAVADO
    279. FIGURA 128. PROCESO DE INVESTIGACIÓN DE MRFR
    280. FIGURA 129. ANÁLISIS DRO DE LAVADO MERCADO DE CÁPSULAS
    281. FIGURA 130. ANÁLISIS DE IMPACTO DE LOS IMPULSORES: MERCADO DE CÁPSULAS DE LAVADO
    282. FIGURA 131. ANÁLISIS DE IMPACTO DE LAS RETENCIONES: MERCADO DE CÁPSULAS DE LAVADO
    283. FIGURA 132. CADENA DE SUMINISTRO / VALOR: MERCADO DE CÁPSULAS DE LAVADO
    284. FIGURA 133. CÁPSULA DE LAVADO MERCADO, POR APLICACIÓN, 2024 (% DE PARTICIPACIÓN)
    285. FIGURA 134. MERCADO DE CÁPSULAS DE LAVADO, POR APLICACIÓN, 2019 A 2032 (Miles de millones de USD)
    286. FIGURA 135. MERCADO DE CÁPSULAS DE LAVADO, POR TIPO DE FORMULACIÓN, 2024 (% DE PARTICIPACIÓN)
    287. GRÁFICO 136. MERCADO DE CÁPSULAS DE LAVADO, POR TIPO DE FORMULACIÓN, 2019 A 2032 (Miles de millones de USD)
    288. FIGURA 137. MERCADO DE CÁPSULAS DE LAVADO, POR CANAL DE DISTRIBUCIÓN, 2024 (% DE PARTICIPACIÓN)
    289. FIGURA 138. MERCADO DE CÁPSULAS DE LAVADO, POR CANAL DE DISTRIBUCIÓN, 2019 A 2032 (USD Miles de millones)
    290. FIGURA 139. MERCADO DE CÁPSULAS DE LAVADO, POR SEGMENTO DE USO FINAL, 2024 (% DE PARTICIPACIÓN)
    291. FIGURA 140. MERCADO DE CÁPSULAS DE LAVADO, POR SEGMENTO DE USO FINAL, 2019 A 2032 (Miles de millones de USD)
    292. FIGURA 141. LAVADO MERCADO DE CÁPSULAS, POR REGIONALES, 2024 (% DE PARTICIPACIÓN)
    293. GRÁFICO 142. MERCADO DE CÁPSULAS DE LAVADO, POR REGIONAL, 2019 A 2032 (Miles de millones de USD)
    294. GRÁFICO 143. EVALUACIÓN COMPARATIVA DE LOS PRINCIPALES COMPETIDORES

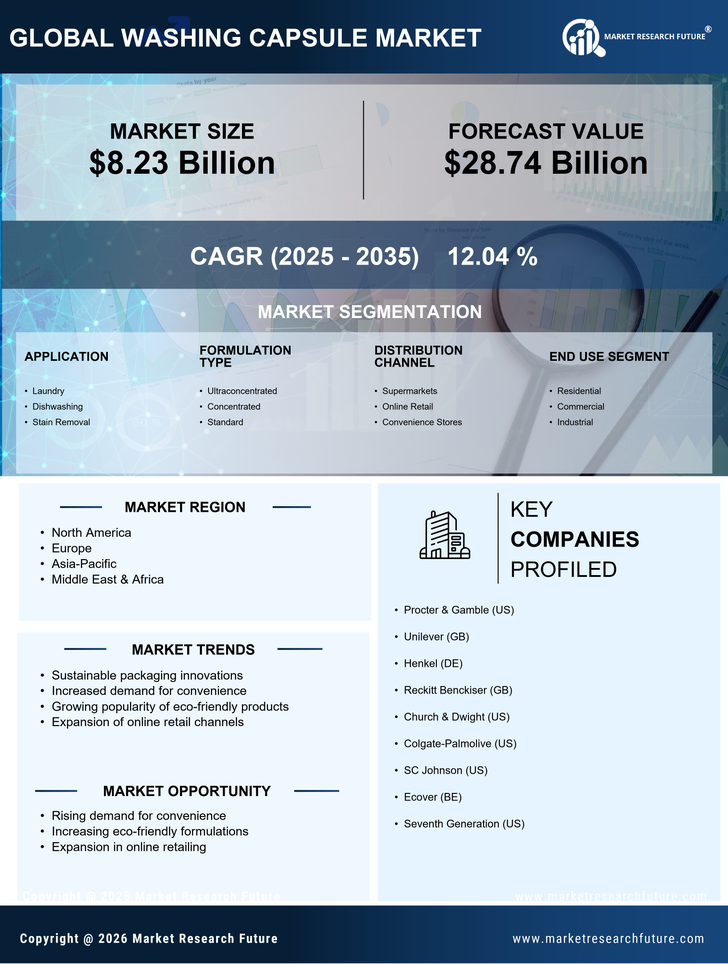
Segmentación del mercado del mercado de cápsulas de lavado

  • Mercado de cápsulas de lavado por aplicación (miles de millones de dólares, 2019-2032)
    • Lavandería
    • Lavavajillas
    • Eliminación de manchas


  • Mercado de cápsulas de lavado por tipo de formulación (miles de millones de dólares, 2019-2032)
    • Ultraconcentrado
    • Concentrado
    • Estándar


  • Mercado de cápsulas de lavado por canal de distribución (miles de millones de dólares, 2019-2032)
    • Supermercados
    • Venta al por menor en línea
    • Tiendas de conveniencia


  • Mercado de cápsulas de lavado por segmento de uso final (miles de millones de dólares, 2019-2032)
    • Residencial
    • Comercial
    • Industrial


  • Mercado de cápsulas de lavado por región (miles de millones de dólares, 2019-2032)
    • América del Norte
    • Europa
    • América del Sur
    • Asia Pacífico
    • Medio Oriente y África


Perspectivas regionales del mercado de cápsulas de lavado (miles de millones de dólares, 2019-2032)


  • Perspectivas de América del Norte (miles de millones de dólares, 2019-2032)
    • Mercado de cápsulas de lavado de América del Norte por tipo de aplicación
      • Lavandería
      • Lavavajillas
      • Eliminación de manchas
    • Mercado de cápsulas de lavado de América del Norte por tipo de formulación
      • Ultraconcentrado
      • Concentrado
      • Estándar
    • Mercado de cápsulas de lavado de América del Norte por tipo de canal de distribución
      • Supermercados
      • Venta al por menor en línea
      • Tiendas de conveniencia
    • Mercado de cápsulas de lavado de América del Norte por tipo de segmento de uso final
      • Residencial
      • Comercial
      • Industrial
    • Mercado de cápsulas de lavado de América del Norte por tipo regional
      • EE.UU.
      • Canadá
    • Perspectivas de EE. UU. (miles de millones de dólares, 2019-2032)
    • Mercado de cápsulas de lavado de EE. UU. por tipo de aplicación
      • Lavandería
      • Lavavajillas
      • Eliminación de manchas
    • Mercado de cápsulas de lavado de EE. UU. por tipo de formulación
      • Ultraconcentrado
      • Concentrado
      • Estándar
    • Mercado de cápsulas de lavado de EE. UU. por tipo de canal de distribución
      • Supermercados
      • Venta al por menor en línea
      • Tiendas de conveniencia
    • Mercado de cápsulas de lavado de EE. UU. por tipo de segmento de uso final
      • Residencial
      • Comercial
      • Industrial
    • Perspectivas de CANADÁ (miles de millones de dólares, 2019-2032)
    • Mercado de cápsulas de lavado de CANADÁ por tipo de aplicación
      • Lavandería
      • Lavavajillas
      • Eliminación de manchas
    • Mercado de cápsulas de lavado de CANADÁ por tipo de formulación
      • Ultraconcentrado
      • Concentrado
      • Estándar
    • Mercado de cápsulas de lavado de CANADÁ por tipo de canal de distribución
      • Supermercados
      • Venta al por menor en línea
      • Tiendas de conveniencia
    • Mercado de cápsulas de lavado de CANADÁ por tipo de segmento de uso final
      • Residencial
      • Comercial
      • Industrial
    • Perspectivas de Europa (miles de millones de dólares, 2019-2032)
      • Mercado europeo de cápsulas de lavado por tipo de aplicación
        • Lavandería
        • Lavavajillas
        • Eliminación de manchas
      • Mercado europeo de cápsulas de lavado por tipo de formulación
        • Ultraconcentrado
        • Concentrado
        • Estándar
      • Mercado europeo de cápsulas de lavado por tipo de canal de distribución
        • Supermercados
        • Venta al por menor en línea
        • Tiendas de conveniencia
      • Mercado europeo de cápsulas de lavado por tipo de segmento de uso final
        • Residencial
        • Comercial
        • Industrial
      • Mercado europeo de cápsulas de lavado por tipo regional
        • Alemania
        • Reino Unido
        • Francia
        • Rusia
        • Italia
        • España
        • Resto de Europa
      • Perspectivas de ALEMANIA (miles de millones de dólares, 2019-2032)
      • Mercado de cápsulas de lavado en ALEMANIA por tipo de aplicación
        • Lavandería
        • Lavavajillas
        • Eliminación de manchas
      • Mercado de cápsulas de lavado en ALEMANIA por tipo de formulación
        • Ultraconcentrado
        • Concentrado
        • Estándar
      • Mercado de cápsulas de lavado en ALEMANIA por tipo de canal de distribución
        • Supermercados
        • Venta al por menor en línea
        • Tiendas de conveniencia
      • Mercado de cápsulas de lavado de ALEMANIA por tipo de segmento de uso final
        • Residencial
        • Comercial
        • Industrial
      • Perspectivas del Reino Unido (miles de millones de dólares, 2019-2032)
      • Mercado de cápsulas de lavado del Reino Unido por tipo de aplicación
        • Lavandería
        • Lavavajillas
        • Eliminación de manchas
      • Mercado de cápsulas de lavado del Reino Unido por tipo de formulación
        • Ultraconcentrado
        • Concentrado
        • Estándar
      • Mercado de cápsulas de lavado del Reino Unido por tipo de canal de distribución
        • Supermercados
        • Venta al por menor en línea
        • Tiendas de conveniencia
      • Mercado de cápsulas de lavado del Reino Unido por tipo de segmento de uso final
        • Residencial
        • Comercial
        • Industrial
      • Perspectivas de FRANCIA (miles de millones de dólares, 2019-2032)
      • Mercado de cápsulas de lavado de FRANCIA por tipo de aplicación
        • Lavandería
        • Lavavajillas
        • Eliminación de manchas
      • Mercado de cápsulas de lavado de FRANCIA por tipo de formulación
        • Ultraconcentrado
        • Concentrado
        • Estándar
      • Mercado de cápsulas de lavado de FRANCIA por tipo de canal de distribución
        • Supermercados
        • Venta al por menor en línea
        • Tiendas de conveniencia
      • Mercado de cápsulas de lavado de FRANCIA por tipo de segmento de uso final
        • Residencial
        • Comercial
        • Industrial
      • Perspectivas de RUSIA (miles de millones de dólares, 2019-2032)
      • Mercado de cápsulas de lavado de RUSIA por tipo de aplicación
        • Lavandería
        • Lavavajillas
        • Eliminación de manchas
      • Mercado de cápsulas de lavado de RUSIA por tipo de formulación
        • Ultraconcentrado
        • Concentrado
        • Estándar
      • Mercado de cápsulas de lavado de RUSIA por tipo de canal de distribución
        • Supermercados
        • Venta al por menor en línea
        • Tiendas de conveniencia
      • Mercado de cápsulas de lavado de Rusia por tipo de segmento de uso final
        • Residencial
        • Comercial
        • Industrial
      • Perspectivas de ITALIA (miles de millones de dólares, 2019-2032)
      • Mercado de cápsulas de lavado de ITALIA por tipo de aplicación
        • Lavandería
        • Lavavajillas
        • Eliminación de manchas
      • Mercado de cápsulas de lavado de ITALIA por tipo de formulación
        • Ultraconcentrado
        • Concentrado
        • Estándar
      • Mercado de cápsulas de lavado de ITALIA por tipo de canal de distribución
        • Supermercados
        • Venta al por menor en línea
        • Tiendas de conveniencia
      • Mercado de cápsulas de lavado de ITALIA por tipo de segmento de uso final
        • Residencial
        • Comercial
        • Industrial
      • Perspectivas de ESPAÑA (miles de millones de dólares, 2019-2032)
      • Mercado de cápsulas de lavado en ESPAÑA por tipo de aplicación
        • Lavandería
        • Lavavajillas
        • Eliminación de manchas
      • Mercado de cápsulas de lavado en ESPAÑA por tipo de formulación
        • Ultraconcentrado
        • Concentrado
        • Estándar
      • Mercado de cápsulas de lavado en ESPAÑA por tipo de canal de distribución
        • Supermercados
        • Venta al por menor en línea
        • Tiendas de conveniencia
      • Mercado de cápsulas de lavado en ESPAÑA por tipo de segmento de uso final
        • Residencial
        • Comercial
        • Industrial
      • Perspectivas DEL RESTO DE EUROPA (Miles de millones de dólares, 2019-2032)
      • RESTO DE EUROPA Mercado de cápsulas de lavado por tipo de aplicación
        • Lavandería
        • Lavavajillas
        • Eliminación de manchas
      • RESTO DE EUROPA Mercado de cápsulas de lavado por tipo de formulación
        • Ultraconcentrado
        • Concentrado
        • Estándar
      • RESTO DE EUROPA Mercado de cápsulas de lavado por tipo de canal de distribución
        • Supermercados
        • Venta al por menor en línea
        • Tiendas de conveniencia
      • RESTO DE EUROPA Mercado de cápsulas de lavado por tipo de segmento de uso final
        • Residencial
        • Comercial
        • Industrial
      • Perspectivas de Asia Pacífico (miles de millones de dólares, 2019-2032)
        • Mercado de cápsulas de lavado de APAC por tipo de aplicación
          • Lavandería
          • Lavavajillas
          • Eliminación de manchas
        • Mercado de cápsulas de lavado de APAC por tipo de formulación
          • Ultraconcentrado
          • Concentrado
          • Estándar
        • Mercado de cápsulas de lavado de APAC por tipo de canal de distribución
          • Supermercados
          • Venta al por menor en línea
          • Tiendas de conveniencia
        • Mercado de cápsulas de lavado de APAC por tipo de segmento de uso final
          • Residencial
          • Comercial
          • Industrial
        • Mercado de cápsulas de lavado APAC por tipo regional
          • China
          • India
          • Japón
          • Corea del Sur
          • Malasia
          • Tailandia
          • Indonesia
          • Resto de APAC
        • Perspectivas de CHINA (miles de millones de dólares, 2019-2032)
        • Mercado CHINA de cápsulas de lavado por tipo de aplicación
          • Lavandería
          • Lavavajillas
          • Eliminación de manchas
        • Mercado de cápsulas de lavado de CHINA por tipo de formulación
          • Ultraconcentrado
          • Concentrado
          • Estándar
        • Mercado de cápsulas de lavado de CHINA por tipo de canal de distribución
          • Supermercados
          • Venta al por menor en línea
          • Tiendas de conveniencia
        • Mercado de cápsulas de lavado de CHINA por tipo de segmento de uso final
          • Residencial
          • Comercial
          • Industrial
        • Perspectivas de la INDIA (miles de millones de dólares, 2019-2032)
        • Mercado de cápsulas de lavado INDIA por tipo de aplicación
          • Lavandería
          • Lavavajillas
          • Eliminación de manchas
        • Mercado de cápsulas de lavado INDIA por tipo de formulación
          • Ultraconcentrado
          • Concentrado
          • Estándar
        • Mercado de cápsulas de lavado de INDIA por tipo de canal de distribución
          • Supermercados
          • Venta al por menor en línea
          • Tiendas de conveniencia
        • Mercado de cápsulas de lavado de INDIA por tipo de segmento de uso final
          • Residencial
          • Comercial
          • Industrial
        • Perspectivas de JAPÓN (miles de millones de dólares, 2019-2032)
        • Mercado de cápsulas de lavado en Japón por tipo de aplicación
          • Lavandería
          • Lavavajillas
          • Eliminación de manchas
        • Mercado de cápsulas de lavado en Japón por tipo de formulación
          • Ultraconcentrado
          • Concentrado
          • Estándar
        • Mercado de cápsulas de lavado en Japón por tipo de canal de distribución
          • Supermercados
          • Venta al por menor en línea
          • Tiendas de conveniencia
        • Mercado de cápsulas de lavado de Japón por tipo de segmento de uso final
          • Residencial
          • Comercial
          • Industrial
        • Perspectivas de COREA DEL SUR (miles de millones de dólares, 2019-2032)
        • Mercado de cápsulas de lavado de COREA DEL SUR por tipo de aplicación
          • Lavandería
          • Lavavajillas
          • Eliminación de manchas
        • Mercado de cápsulas de lavado de COREA DEL SUR por tipo de formulación
          • Ultraconcentrado
          • Concentrado
          • Estándar
        • Mercado de cápsulas de lavado de COREA DEL SUR por tipo de canal de distribución
          • Supermercados
          • Venta al por menor en línea
          • Tiendas de conveniencia
        • Mercado de cápsulas de lavado de COREA del SUR por tipo de segmento de uso final
          • Residencial
          • Comercial
          • Industrial
        • MALPerspectivas de AYSIA (miles de millones de dólares, 2019-2032)
        • Mercado de cápsulas de lavado de MALASIA por tipo de aplicación
          • Lavandería
          • Lavavajillas
          • Eliminación de manchas
        • Mercado de cápsulas de lavado de MALASIA por tipo de formulación
          • Ultraconcentrado
          • Concentrado
          • Estándar
        • Mercado de cápsulas de lavado de MALASIA por tipo de canal de distribución
          • Supermercados
          • Venta al por menor en línea
          • Tiendas de conveniencia
        • Mercado de cápsulas de lavado de MALASIA por tipo de segmento de uso final
          • Residencial
          • Comercial
          • Industrial
        • Perspectivas de TAILANDIA (miles de millones de dólares, 2019-2032)
        • Mercado de cápsulas de lavado de TAILANDIA por tipo de aplicación
          • Lavandería
          • Lavavajillas
          • Eliminación de manchas
        • Mercado de cápsulas de lavado de TAILANDIA por tipo de formulación
          • Ultraconcentrado
          • Concentrado
          • Estándar
        • Mercado de cápsulas de lavado de TAILANDIA por tipo de canal de distribución
          • Supermercados
          • Venta al por menor en línea
          • Tiendas de conveniencia
        • Mercado de cápsulas de lavado de TAILANDIA por tipo de segmento de uso final
          • Residencial
          • Comercial
          • Industrial
        • Perspectivas de INDONESIA (miles de millones de dólares, 2019-2032)
        • Mercado de cápsulas de lavado de INDONESIA por tipo de aplicación
          • Lavandería
          • Lavavajillas
          • Eliminación de manchas
        • Mercado de cápsulas de lavado de INDONESIA por tipo de formulación
          • Ultraconcentrado
          • Concentrado
          • Estándar
        • Mercado de cápsulas de lavado de INDONESIA por tipo de canal de distribución
          • Supermercados
          • Venta al por menor en línea
          • Tiendas de conveniencia
        • Mercado de cápsulas de lavado de INDONESIA por tipo de segmento de uso final
          • Residencial
          • Comercial
          • Industrial
        • Perspectivas del RESTO DE APAC (miles de millones de dólares, 2019-2032)
        • RESTO DEL Mercado de cápsulas de lavado de APAC por tipo de aplicación
          • Lavandería
          • Lavavajillas
          • Eliminación de manchas
        • RESTO DEL Mercado de cápsulas de lavado de APAC por tipo de formulación
          • Ultraconcentrado
          • Concentrado
          • Estándar
        • RESTO DEL Mercado de cápsulas de lavado de APAC por tipo de canal de distribución
          • Supermercados
          • Venta al por menor en línea
          • Tiendas de conveniencia
        • RESTO DEL Mercado de cápsulas de lavado de APAC por tipo de segmento de uso final
          • Residencial
          • Comercial
          • Industrial
        • Perspectivas de América del Sur (miles de millones de dólares, 2019-2032)
          • Mercado de cápsulas de lavado en América del Sur por tipo de aplicación
            • Lavandería
            • Lavavajillas
            • Eliminación de manchas
          • Mercado de cápsulas de lavado en América del Sur por tipo de formulación
            • Ultraconcentrado
            • Concentrado
            • Estándar
          • Mercado de cápsulas de lavado en América del Sur por tipo de canal de distribución
            • Supermercados
            • Venta al por menor en línea
            • Tiendas de conveniencia
          • Mercado de cápsulas de lavado de América del Sur por tipo de segmento de uso final
            • Residencial
            • Comercial
            • Industrial
          • Mercado de cápsulas de lavado de América del Sur por tipo regional
            • Brasil
            • México
            • Argentina
            • Resto de Sudamérica
          • Perspectivas de BRASIL (miles de millones de dólares, 2019-2032)
          • Mercado de cápsulas de lavado en BRASIL por tipo de aplicación
            • Lavandería
            • Lavavajillas
            • Eliminación de manchas
          • Mercado de cápsulas de lavado de BRASIL por tipo de formulación
            • Ultraconcentrado
            • Concentrado
            • Estándar
          • Mercado de cápsulas de lavado de BRASIL por tipo de canal de distribución
            • Supermercados
            • Venta al por menor en línea
            • Tiendas de conveniencia
          • Mercado de cápsulas de lavado en BRASIL por tipo de segmento de uso final
            • Residencial
            • Comercial
            • Industrial
          • Perspectivas de MÉXICO (Miles de millones de dólares, 2019-2032)
          • Mercado de cápsulas de lavado en MÉXICO por tipo de aplicación
            • Lavandería
            • Lavavajillas
            • Eliminación de manchas
          • Mercado de cápsulas de lavado en MÉXICO por tipo de formulación
            • Ultraconcentrado
            • Concentrado
            • Estándar
          • Mercado de cápsulas de lavado en MÉXICO por tipo de canal de distribución
            • Supermercados
            • Venta al por menor en línea
            • Tiendas de conveniencia
          • Mercado de cápsulas de lavado en MÉXICO por tipo de segmento de uso final
            • Residencial
            • Comercial
            • Industrial
          • Perspectivas de ARGENTINA (miles de millones de dólares, 2019-2032)
          • Mercado de cápsulas de lavado ARGENTINA por tipo de aplicación
            • Lavandería
            • Lavavajillas
            • Eliminación de manchas
          • Mercado de cápsulas de lavado ARGENTINA por tipo de formulación
            • Ultraconcentrado
            • Concentrado
            • Estándar
          • Mercado ARGENTINA de cápsulas de lavado por tipo de canal de distribución
            • Supermercados
            • Venta al por menor en línea
            • Tiendas de conveniencia
          • Mercado de cápsulas de lavado ARGENTINA por tipo de segmento de uso final
            • Residencial
            • Comercial
            • Industrial
          • Perspectivas DEL RESTO DE AMÉRICA DEL SUR (Miles de millones de dólares, 2019-2032)
          • RESTO DE AMÉRICA DEL SUR Mercado de cápsulas de lavado por tipo de aplicación
            • Lavandería
            • Lavavajillas
            • Eliminación de manchas
          • RESTO DE AMÉRICA DEL SUR Mercado de cápsulas de lavado por tipo de formulación
            • Ultraconcentrado
            • Concentrado
            • Estándar
          • RESTO DE AMÉRICA DEL SUR Mercado de cápsulas de lavado por tipo de canal de distribución
            • Supermercados
            • Venta al por menor en línea
            • Tiendas de conveniencia
          • RESTO DE AMÉRICA DEL SUR Mercado de cápsulas de lavado por tipo de segmento de uso final
            • Residencial
            • Comercial
            • Industrial
          • Perspectivas de los MEA (miles de millones de dólares, 2019-2032)
            • Mercado de cápsulas de lavado MEA por tipo de aplicación
              • Lavandería
              • Lavavajillas
              • Eliminación de manchas
            • Mercado de cápsulas de lavado MEA por tipo de formulación
              • Ultraconcentrado
              • Concentrado
              • Estándar
            • Mercado de cápsulas de lavado MEA por tipo de canal de distribución
              • Supermercados
              • Venta al por menor en línea
              • Tiendas de conveniencia
            • Mercado de cápsulas de lavado MEA por tipo de segmento de uso final
              • Residencial
              • Comercial
              • Industrial
            • Mercado de cápsulas de lavado MEA por tipo regional
              • Países del CCG
              • Sudáfrica
              • Resto de MEA
            • Perspectivas de los PAÍSES del CCG (miles de millones de dólares, 2019-2032)
            • Países del CCG Mercado de cápsulas de lavado por tipo de aplicación
              • Lavandería
              • Lavavajillas
              • Eliminación de manchas
            • Países del CCG Mercado de cápsulas de lavado por tipo de formulación
              • Ultraconcentrado
              • Concentrado
              • Estándar
            • Países del CCG Mercado de cápsulas de lavado por tipo de canal de distribución
              • Supermercados
              • Venta al por menor en línea
              • Tiendas de conveniencia
            • Países del CCG Mercado de cápsulas de lavado por tipo de segmento de uso final
              • Residencial
              • Comercial
              • Industrial
            • Perspectivas de SUDÁFRICA (miles de millones de dólares, 2019-2032)
            • Mercado de cápsulas de lavado de SUDÁFRICA por tipo de aplicación
              • Lavandería
              • Lavavajillas
              • Eliminación de manchas
            • Mercado de cápsulas de lavado de SUDÁFRICA por tipo de formulación
              • Ultraconcentrado
              • Concentrado
              • Estándar
            • Mercado de cápsulas de lavado de SUDÁFRICA por tipo de canal de distribución
              • Supermercados
              • Venta al por menor en línea
              • Tiendas de conveniencia
            • Mercado de cápsulas de lavado de SUDÁFRICA por tipo de segmento de uso final
              • Residencial
              • Comercial
              • Industrial
            • Perspectivas del RESTO DE MEA (miles de millones de dólares, 2019-2032)
            • RESTO DEL Mercado de cápsulas de lavado MEA por tipo de aplicación
              • Lavandería
              • Lavavajillas
              • Eliminación de manchas
            • RESTO DEL Mercado de cápsulas de lavado de MEA por tipo de formulación
              • Ultraconcentrado
              • Concentrado
              • Estándar
            • RESTO DEL Mercado de cápsulas de lavado de MEA por tipo de canal de distribución
              • Supermercados
              • Venta al por menor en línea
              • Tiendas de conveniencia
            • RESTO DEL Mercado de cápsulas de lavado MEA por tipo de segmento de uso final
              • Residencial
              • Comercial
              • Industrial


Compare Licence

×
Features License Type
Single User Multiuser License Enterprise User
Price $4,950 $5,950 $7,250
Maximum User Access Limit 1 User Upto 10 Users Unrestricted Access Throughout the Organization
Free Customization
Direct Access to Analyst
Deliverable Format
Platform Access
Discount on Next Purchase 10% 15% 15%
Printable Versions