Request Free Sample ×

Kindly complete the form below to receive a free sample of this Report

* Please use a valid business email

Leading companies partner with us for data-driven Insights

clients tt-cursor
Hero Background

VOC Concentrator Market

ID: MRFR/EnP/6750-CR
155 Pages
Chitranshi Jaiswal
Last Updated: April 22, 2026

Informe de investigación de mercado de concentradores de COV por aplicación (industrial, comercial, residencial, automotriz), tecnología (oxidación térmica, adsorción, tratamiento biológico, separación por membranas), industria de uso final (fabricación de productos químicos, farmacéutica, alimentos y bebidas, impresión y recubrimientos), tipo de sistema (sistemas portátiles, estacionarios, modulares) y región (Norteamérica, Europa, Sudamérica, Asia Pacífico, Oriente Medio y África): pronóstico hasta 2032.

Compartir
Download PDF ×

We do not share your information with anyone. However, we may send you emails based on your report interest from time to time. You may contact us at any time to opt-out.

VOC Concentrator Market Infographic
Purchase Options
  1. 1 RESUMEN EJECUTIVO
    1. 1.1 Panorama del mercado
    2. 1.2 Hallazgos clave
    3. 1.3 Segmentación del mercado
    4. 1.4 Panorama competitivo
    5. 1.5 Desafíos y oportunidades
    6. 1.6 Perspectivas futuras
  2. 2 INTRODUCCIÓN AL MERCADO
    1. 2.1 Definición
    2. 2.2 Alcance del estudio
      1. 2.2.1 Objetivo de la investigación
      2. 2.2.2 Supuestos
      3. 2.2.3 Limitaciones
  3. 3 METODOLOGÍA DE LA INVESTIGACIÓN
    1. 3.1 Panorama general
    2. 3.2 Minería de datos
    3. 3.3 Investigación secundaria
    4. 3.4 Investigación primaria
      1. 3.4.1 Entrevistas primarias y proceso de recopilación de información
      2. 3.4.2 Desglose de los encuestados principales
    5. 3.5 Modelo de pronóstico
    6. 3.6 Estimación del tamaño del mercado
      1. 3.6.1 Enfoque ascendente
      2. 3.6.2 Enfoque descendente
    7. 3.7 Triangulación de datos
    8. 3.8 Validación
  4. 4 DINÁMICA DEL MERCADO
    1. 4.1 Visión general
    2. 4.2 Factores impulsores
    3. 4.3 Limitaciones
    4. 4.4 Oportunidades
  5. 5 ANÁLISIS DE FACTORES DE MERCADO
    1. 5.1 Análisis de la cadena de valor
    2. 5.2 Análisis de las cinco fuerzas de Porter
      1. 5.2.1 Poder de negociación de los proveedores
      2. 5.2.2 Poder de negociación de los compradores
      3. 5.2.3 Amenaza de nuevos participantes
      4. 5.2.4 Amenaza de sustitutos
      5. 5.2.5 Intensidad de la rivalidad
    3. 5.3 Análisis del impacto de la COVID-19
      1. 5.3.1 Análisis del impacto del mercado
      2. 5.3.2 Impacto regional
      3. 5.3.3 Análisis de oportunidades y amenazas
  6. 6 MERCADO DE CONCENTRADORES DE COV, POR APLICACIÓN (MILES DE MILLONES DE USD)
    1. 6.1 Industrial
    2. 6.2 Comercial
    3. 6.3 Residencial
    4. 6.4 Automotriz
  7. 7 MERCADO DE CONCENTRADORES DE COV, POR TECNOLOGÍA (MILES DE MILLONES DE USD)
    1. 7.1 Oxidación térmica
    2. 7.2 Adsorción
    3. 7.3 Tratamiento biológico
    4. 7.4 Separación por membranas
  8. 8 MERCADO DE CONCENTRADORES DE COV, POR INDUSTRIA DE USO FINAL (MILES DE MILLONES DE USD)
    1. 8.1 Fabricación de productos químicos
    2. 8.2 Productos farmacéuticos
    3. 8.3 Alimentos y bebidas
    4. 8.4 Impresión y recubrimientos
  9. 9 MERCADO DE CONCENTRADORES DE COV, POR TIPO DE SISTEMA (MILES DE MILLONES DE USD)
    1. 9.1 Sistemas portátiles
    2. 9.2 Sistemas estacionarios
    3. 9.3 Sistemas modulares
  10. 10 MERCADO DE CONCENTRADORES DE COV, POR REGION (MILES DE MILLONES DE USD)
    1. 10.1 Norteamérica
      1. 10.1.1 EE. UU.
      2. 10.1.2 Canadá
    2. 10.2 Europa
      1. 10.2.1 Alemania
      2. 10.2.2 Reino Unido
      3. 10.2.3 Francia
      4. 10.2.4 Rusia
      5. 10.2.5 Italia
      6. 10.2.6 España
      7. 10.2.7 Resto de Europa
    3. 10.3 Asia Pacífico
      1. 10.3.1 China
      2. 10.3.2 India
      3. 10.3.3 Japón
      4. 10.3.4 Corea del Sur
      5. 10.3.5 Malasia
      6. 10.3.6 Tailandia
      7. 10.3.7 Indonesia
      8. 10.3.8 Resto de Asia Pacífico
    4. 10.4 Sudamérica
      1. 10.4.1 Brasil
      2. 10.4.2 México
      3. 10.4.3 Argentina
      4. 10.4.4 Resto de Sudamérica
    5. 10.5 Oriente Medio y África
      1. 10.5.1 Países del CCG
      2. 10.5.2 Sudáfrica
      3. 10.5.3 Resto de Oriente Medio y África
  11. 11 Panorama competitivo
    1. 11.1 Panorama general
    2. 11.2 Análisis competitivo
    3. 11.3 Análisis de cuota de mercado
    4. 11.4 Estrategia de crecimiento principal en el mercado de concentradores de COV
    5. 11.5 Benchmarking competitivo
    6. 11.6 Principales actores en términos de número de desarrollos en el mercado de concentradores de COV
    7. 11.7 Desarrollos clave y estrategias de crecimiento
      1. 11.7.1 Lanzamiento de nuevos productos/implementación de servicios
      2. 11.7.2 Fusiones y adquisiciones
      3. 11.7.3 Empresas conjuntas
    8. 11.8 Matriz financiera de los principales actores
      1. 11.8.1 Ventas e ingresos operativos
      2. 11.8.2 Gasto en I+D de los principales actores. 2023
  12. 12 PERFILES DE EMPRESAS
    1. 12.1 Evoqua Water Technologies
      1. 12.1.1 Resumen financiero
      2. 12.1.2 Productos ofrecidos
      3. 12.1.3 Desarrollos clave
      4. 12.1.4 Análisis FODA
      5. 12.1.5 Estrategias clave
    2. 12.2 Perceptive Engineering
      1. 12.2.1 Panorama financiero
      2. 12.2.2 Productos ofrecidos
      3. 12.2.3 Desarrollos clave
      4. 12.2.4 Análisis FODA
      5. 12.2.5 Estrategias clave
    3. 12.3 Koch Industries
      1. 12.3.1 Panorama financiero
      2. 12.3.2 Productos ofrecidos
      3. 12.3.3 Desarrollos clave
      4. 12.3.4 Análisis FODA
      5. 12.3.5 Estrategias clave
    4. 12.4 Aereon
      1. 12.4.1 Panorama financiero
      2. 12.4.2 Productos ofrecidos
      3. 12.4.3 Desarrollos Clave
      4. 12.4.4 Análisis FODA
      5. 12.4.5 Estrategias Clave
    5. 12.5 Vogt Power International
      1. 12.5.1 Panorama Financiero
      2. 12.5.2 Productos Ofrecidos
      3. 12.5.3 Desarrollos Clave
      4. 12.5.4 Análisis FODA
      5. 12.5.5 Estrategias Clave
    6. 12.6 Process Systems Enterprise
      1. 12.6.1 Panorama Financiero
      2. 12.6.2 Productos Ofrecidos
      3. 12.6.3 Desarrollos Clave
      4. 12.6.4 Análisis FODA
      5. 12.6.5 Estrategias Clave
    7. 12.7 Methode Electronics
      1. 12.7.1 Panorama Financiero
      2. 12.7.2 Productos Ofrecidos
      3. 12.7.3 Desarrollos Clave
      4. 12.7.4 Análisis FODA
      5. 12.7.5 Estrategias clave
    8. 12.8 Honeywell International
      1. 12.8.1 Panorama financiero
      2. 12.8.2 Productos ofrecidos
      3. 12.8.3 Desarrollos clave
      4. 12.8.4 Análisis FODA
      5. 12.8.5 Estrategias clave
    9. 12.9 TriMer Corporation
      1. 12.9.1 Panorama financiero
      2. 12.9.2 Productos ofrecidos
      3. 12.9.3 Desarrollos clave
      4. 12.9.4 Análisis FODA
      5. 12.9.5 Estrategias clave
    10. 12.10 Veolia Environnement
      1. 12.10.1 Panorama financiero
      2. 12.10.2 Productos ofrecidos
      3. 12.10.3 Desarrollos clave
      4. 12.10.4 Análisis FODA
      5. 12.10.5 Estrategias clave
    11. 12.11 Bloom Energy
      1. 12.11.1 Panorama financiero
      2. 12.11.2 Productos ofrecidos
      3. 12.11.3 Desarrollos clave
      4. 12.11.4 Análisis FODA
      5. 12.11.5 Estrategias clave
    12. 12.12 Emerson Electric
      1. 12.12.1 Panorama financiero
      2. 12.12.2 Productos ofrecidos
      3. 12.12.3 Desarrollos clave
      4. 12.12.4 Análisis FODA
      5. 12.12.5 Estrategias clave
    13. 12.13 Linde plc
      1. 12.13.1 Panorama financiero
      2. 12.13.2 Productos ofrecidos
      3. 12.13.3 Desarrollos Clave
      4. 12.13.4 Análisis FODA
      5. 12.13.5 Estrategias Clave
    14. 12.14 Air Products and Chemicals
      1. 12.14.1 Panorama Financiero
      2. 12.14.2 Productos Ofrecidos
      3. 12.14.3 Desarrollos Clave
      4. 12.14.4 Análisis FODA
      5. 12.14.5 Estrategias Clave
    15. 12.15 Atlas Copco
      1. 12.15.1 Panorama Financiero
      2. 12.15.2 Productos Ofrecidos
      3. 12.15.3 Desarrollos Clave
      4. 12.15.4 Análisis FODA
      5. 12.15.5 Estrategias Clave
  13. 13 APÉNDICE
    1. 13.1 Referencias
    2. 13.2 Informes relacionados
    3. LISTA DE TABLAS
    4. TABLA 1. LISTA DE SUPUESTOS
    5. TABLA 2. ESTIMACIONES Y PRONÓSTICOS DEL TAMAÑO DEL MERCADO DE CONCENTRADORES DE COV DE AMÉRICA DEL NORTE, POR APLICACIÓN, 2019-2032 (MILES DE MILLONES DE USD)
    6. TABLA 3. ESTIMACIONES Y PRONÓSTICOS DEL TAMAÑO DEL MERCADO DE CONCENTRADORES DE COV DE AMÉRICA DEL NORTE, POR TECNOLOGÍA, 2019-2032 (MILES DE MILLONES DE USD)
    7. TABLA 4. ESTIMACIONES Y PRONÓSTICOS DEL TAMAÑO DEL MERCADO DE CONCENTRADORES DE COV DE AMÉRICA DEL NORTE, POR INDUSTRIA DE USO FINAL, 2019-2032 (MILES DE MILLONES DE USD)
    8. TABLA 5. ESTIMACIONES Y PRONÓSTICOS DEL TAMAÑO DEL MERCADO DE CONCENTRADORES DE COV DE AMÉRICA DEL NORTE PRONÓSTICO, POR TIPO DE SISTEMA, 2019-2032 (MILES DE MILLONES DE USD)
    9. TABLA 6. ESTIMACIONES Y PRONÓSTICOS DEL TAMAÑO DEL MERCADO DE CONCENTRADORES DE COV DE AMÉRICA DEL NORTE, POR REGION, 2019-2032 (MILES DE MILLONES DE USD)
    10. TABLA 7. ESTIMACIONES Y PRONÓSTICOS DEL TAMAÑO DEL MERCADO DE CONCENTRADORES DE COV DE EE. UU., POR APLICACIÓN, 2019-2032 (MILES DE MILLONES DE USD)
    11. TABLA 8. ESTIMACIONES Y PRONÓSTICOS DEL TAMAÑO DEL MERCADO DE CONCENTRADORES DE COV DE EE. UU., POR TECNOLOGÍA, 2019-2032 (MILES DE MILLONES DE USD)
    12. TABLA 9. ESTIMACIONES Y PRONÓSTICOS DEL TAMAÑO DEL MERCADO DE CONCENTRADORES DE COV DE EE. UU. PRONÓSTICO, POR INDUSTRIA DE USO FINAL, 2019-2032 (MILES DE MILLONES DE USD)
    13. TABLA 10. ESTIMACIONES Y PRONÓSTICOS DEL TAMAÑO DEL MERCADO DE CONCENTRADORES DE COV DE EE. UU., POR TIPO DE SISTEMA, 2019-2032 (MILES DE MILLONES DE USD)
    14. TABLA 11. ESTIMACIONES Y PRONÓSTICOS DEL TAMAÑO DEL MERCADO DE CONCENTRADORES DE COV DE EE. UU., POR REGION, 2019-2032 (MILES DE MILLONES DE USD)
    15. TABLA 12. ESTIMACIONES Y PRONÓSTICOS DEL TAMAÑO DEL MERCADO DE CONCENTRADORES DE COV DE CANADÁ, POR APLICACIÓN, 2019-2032 (MILES DE MILLONES DE USD)
    16. TABLA 13. ESTIMACIONES Y PRONÓSTICOS DEL TAMAÑO DEL MERCADO DE CONCENTRADORES DE COV DE CANADÁ PRONÓSTICO, POR TECNOLOGÍA, 2019-2032 (MILES DE MILLONES DE USD)
    17. TABLA 14. ESTIMACIONES Y PRONÓSTICOS DEL TAMAÑO DEL MERCADO DE CONCENTRADORES DE COV DE CANADÁ, POR INDUSTRIA DE USO FINAL, 2019-2032 (MILES DE MILLONES DE USD)
    18. TABLA 15. ESTIMACIONES Y PRONÓSTICOS DEL TAMAÑO DEL MERCADO DE CONCENTRADORES DE COV DE CANADÁ, POR TIPO DE SISTEMA, 2019-2032 (MILES DE MILLONES DE USD)
    19. TABLA 16. ESTIMACIONES Y PRONÓSTICOS DEL TAMAÑO DEL MERCADO DE CONCENTRADORES DE COV DE CANADÁ, POR REGION, 2019-2032 (MILES DE MILLONES DE USD)
    20. TABLA 17. ESTIMACIONES Y PRONÓSTICOS DEL TAMAÑO DEL MERCADO DE CONCENTRADORES DE COV DE EUROPA PRONÓSTICO, POR APLICACIÓN, 2019-2032 (MILES DE MILLONES DE USD)
    21. TABLA 18. ESTIMACIONES Y PRONÓSTICOS DEL TAMAÑO DEL MERCADO DE CONCENTRADORES DE COV EN EUROPA, POR TECNOLOGÍA, 2019-2032 (MILES DE MILLONES DE USD)
    22. TABLA 19. ESTIMACIONES Y PRONÓSTICOS DEL TAMAÑO DEL MERCADO DE CONCENTRADORES DE COV EN EUROPA, POR INDUSTRIA DE USO FINAL, 2019-2032 (MILES DE MILLONES DE USD)
    23. TABLA 20. ESTIMACIONES Y PRONÓSTICOS DEL TAMAÑO DEL MERCADO DE CONCENTRADORES DE COV EN EUROPA, POR TIPO DE SISTEMA, 2019-2032 (MILES DE MILLONES DE USD)
    24. TABLA 21. ESTIMACIONES Y PRONÓSTICOS DEL TAMAÑO DEL MERCADO DE CONCENTRADORES DE COV EN EUROPA PRONÓSTICO, POR REGION, 2019-2032 (MILES DE MILLONES DE USD)
    25. TABLA 22. ESTIMACIONES Y PRONÓSTICOS DEL TAMAÑO DEL MERCADO DE CONCENTRADORES DE COV DE ALEMANIA, POR APLICACIÓN, 2019-2032 (MILES DE MILLONES DE USD)
    26. TABLA 23. ESTIMACIONES Y PRONÓSTICOS DEL TAMAÑO DEL MERCADO DE CONCENTRADORES DE COV DE ALEMANIA, POR TECNOLOGÍA, 2019-2032 (MILES DE MILLONES DE USD)
    27. TABLA 24. ESTIMACIONES Y PRONÓSTICOS DEL TAMAÑO DEL MERCADO DE CONCENTRADORES DE COV DE ALEMANIA, POR INDUSTRIA DE USO FINAL, 2019-2032 (MILES DE MILLONES DE USD)
    28. TABLA 25. ESTIMACIONES Y PRONÓSTICOS DEL TAMAÑO DEL MERCADO DE CONCENTRADORES DE COV DE ALEMANIA PRONÓSTICO, POR TIPO DE SISTEMA, 2019-2032 (MILES DE MILLONES DE USD)
    29. TABLA 26. ESTIMACIONES Y PRONÓSTICOS DEL TAMAÑO DEL MERCADO DE CONCENTRADORES DE COV DE ALEMANIA, POR REGION, 2019-2032 (MILES DE MILLONES DE USD)
    30. TABLA 27. ESTIMACIONES Y PRONÓSTICOS DEL TAMAÑO DEL MERCADO DE CONCENTRADORES DE COV DEL REINO UNIDO, POR APLICACIÓN, 2019-2032 (MILES DE MILLONES DE USD)
    31. TABLA 28. ESTIMACIONES Y PRONÓSTICOS DEL TAMAÑO DEL MERCADO DE CONCENTRADORES DE COV DEL REINO UNIDO, POR TECNOLOGÍA, 2019-2032 (MILES DE MILLONES DE USD)
    32. TABLA 29. ESTIMACIONES Y PRONÓSTICOS DEL TAMAÑO DEL MERCADO DE CONCENTRADORES DE COV DEL REINO UNIDO PRONÓSTICO, POR INDUSTRIA DE USO FINAL, 2019-2032 (MILES DE MILLONES DE USD)
    33. TABLA 30. ESTIMACIONES Y PRONÓSTICOS DEL TAMAÑO DEL MERCADO DE CONCENTRADORES DE COV DEL REINO UNIDO, POR TIPO DE SISTEMA, 2019-2032 (MILES DE MILLONES DE USD)
    34. TABLA 31. ESTIMACIONES Y PRONÓSTICOS DEL TAMAÑO DEL MERCADO DE CONCENTRADORES DE COV DEL REINO UNIDO, POR REGION, 2019-2032 (MILES DE MILLONES DE USD)
    35. TABLA 32. ESTIMACIONES Y PRONÓSTICOS DEL TAMAÑO DEL MERCADO DE CONCENTRADORES DE COV DE FRANCIA, POR APLICACIÓN, 2019-2032 (MILES DE MILLONES DE USD)
    36. TABLA 33. ESTIMACIONES Y PRONÓSTICOS DEL TAMAÑO DEL MERCADO DE CONCENTRADORES DE COV DE FRANCIA PRONÓSTICO, POR TECNOLOGÍA, 2019-2032 (MILES DE MILLONES DE USD)
    37. TABLA 34. ESTIMACIONES Y PRONÓSTICOS DEL TAMAÑO DEL MERCADO DE CONCENTRADORES DE COV DE FRANCIA, POR INDUSTRIA DE USO FINAL, 2019-2032 (MILES DE MILLONES DE USD)
    38. TABLA 35. ESTIMACIONES Y PRONÓSTICOS DEL TAMAÑO DEL MERCADO DE CONCENTRADORES DE COV DE FRANCIA, POR TIPO DE SISTEMA, 2019-2032 (MILES DE MILLONES DE USD)
    39. TABLA 36. ESTIMACIONES Y PRONÓSTICOS DEL TAMAÑO DEL MERCADO DE CONCENTRADORES DE COV DE FRANCIA, POR REGION, 2019-2032 (MILES DE MILLONES DE USD)
    40. TABLA 37. ESTIMACIONES Y PRONÓSTICOS DEL TAMAÑO DEL MERCADO DE CONCENTRADORES DE COV DE RUSIA PRONÓSTICO, POR APLICACIÓN, 2019-2032 (MILES DE MILLONES DE USD)
    41. TABLA 38. ESTIMACIONES Y PRONÓSTICOS DEL TAMAÑO DEL MERCADO DE CONCENTRADORES DE COV DE RUSIA, POR TECNOLOGÍA, 2019-2032 (MILES DE MILLONES DE USD)
    42. TABLA 39. ESTIMACIONES Y PRONÓSTICOS DEL TAMAÑO DEL MERCADO DE CONCENTRADORES DE COV DE RUSIA, POR INDUSTRIA DE USO FINAL, 2019-2032 (MILES DE MILLONES DE USD)
    43. TABLA 40. ESTIMACIONES Y PRONÓSTICOS DEL TAMAÑO DEL MERCADO DE CONCENTRADORES DE COV DE RUSIA, POR TIPO DE SISTEMA, 2019-2032 (MILES DE MILLONES DE USD)
    44. TABLA 41. ESTIMACIONES Y PRONÓSTICOS DEL TAMAÑO DEL MERCADO DE CONCENTRADORES DE COV DE RUSIA PRONÓSTICO, POR REGION, 2019-2032 (MILES DE MILLONES DE USD)
    45. TABLA 42. ESTIMACIONES Y PRONÓSTICOS DEL TAMAÑO DEL MERCADO DE CONCENTRADORES DE COV DE ITALIA, POR APLICACIÓN, 2019-2032 (MILES DE MILLONES DE USD)
    46. TABLA 43. ESTIMACIONES Y PRONÓSTICOS DEL TAMAÑO DEL MERCADO DE CONCENTRADORES DE COV DE ITALIA, POR TECNOLOGÍA, 2019-2032 (MILES DE MILLONES DE USD)
    47. TABLA 44. ESTIMACIONES Y PRONÓSTICOS DEL TAMAÑO DEL MERCADO DE CONCENTRADORES DE COV DE ITALIA, POR INDUSTRIA DE USO FINAL, 2019-2032 (MILES DE MILLONES DE USD)
    48. TABLA 45. ESTIMACIONES Y PRONÓSTICOS DEL TAMAÑO DEL MERCADO DE CONCENTRADORES DE COV DE ITALIA PRONÓSTICO, POR TIPO DE SISTEMA, 2019-2032 (MILES DE MILLONES DE USD)
    49. TABLA 46. ESTIMACIONES Y PRONÓSTICOS DEL TAMAÑO DEL MERCADO DE CONCENTRADORES DE COV DE ITALIA, POR REGION, 2019-2032 (MILES DE MILLONES DE USD)
    50. TABLA 47. ESTIMACIONES Y PRONÓSTICOS DEL TAMAÑO DEL MERCADO DE CONCENTRADORES DE COV DE ESPAÑA, POR APLICACIÓN, 2019-2032 (MILES DE MILLONES DE USD)
    51. TABLA 48. ESTIMACIONES Y PRONÓSTICOS DEL TAMAÑO DEL MERCADO DE CONCENTRADORES DE COV DE ESPAÑA, POR TECNOLOGÍA, 2019-2032 (MILES DE MILLONES DE USD)
    52. TABLA 49. ESTIMACIONES Y PRONÓSTICOS DEL TAMAÑO DEL MERCADO DE CONCENTRADORES DE COV DE ESPAÑA PRONÓSTICO POR INDUSTRIA DE USO FINAL, 2019-2032 (MILES DE MILLONES DE USD)
    53. TABLA 50. ESTIMACIONES Y PRONÓSTICOS DEL TAMAÑO DEL MERCADO DE CONCENTRADORES DE COV EN ESPAÑA, POR TIPO DE SISTEMA, 2019-2032 (MILES DE MILLONES DE USD)
    54. TABLA 51. ESTIMACIONES Y PRONÓSTICOS DEL TAMAÑO DEL MERCADO DE CONCENTRADORES DE COV EN ESPAÑA, POR REGION, 2019-2032 (MILES DE MILLONES DE USD)
    55. TABLA 52. ESTIMACIONES Y PRONÓSTICOS DEL TAMAÑO DEL MERCADO DE CONCENTRADORES DE COV EN EL RESTO DE EUROPA, POR APLICACIÓN, 2019-2032 (MILES DE MILLONES DE USD)
    56. TABLA 53. ESTIMACIONES Y PRONÓSTICOS DEL TAMAÑO DEL MERCADO DE CONCENTRADORES DE COV DEL RESTO DE EUROPA, POR TECNOLOGÍA, 2019-2032 (MILES DE MILLONES DE USD)
    57. TABLA 54. ESTIMACIONES Y PRONÓSTICOS DEL TAMAÑO DEL MERCADO DE CONCENTRADORES DE COV DEL RESTO DE EUROPA, POR INDUSTRIA DE USO FINAL, 2019-2032 (MILES DE MILLONES DE USD)
    58. TABLA 55. ESTIMACIONES Y PRONÓSTICOS DEL TAMAÑO DEL MERCADO DE CONCENTRADORES DE COV DEL RESTO DE EUROPA, POR TIPO DE SISTEMA, 2019-2032 (MILES DE MILLONES DE USD)
    59. TABLA 56. ESTIMACIONES Y PRONÓSTICOS DEL TAMAÑO DEL MERCADO DE CONCENTRADORES DE COV DEL RESTO DE EUROPA, PRONÓSTICO, POR REGION, 2019-2032 (MILES DE MILLONES DE USD)
    60. TABLA 57. ESTIMACIONES Y PRONÓSTICOS DEL TAMAÑO DEL MERCADO DE CONCENTRADORES DE COV DE APAC, POR APLICACIÓN, 2019-2032 (MILES DE MILLONES DE USD)
    61. TABLA 58. ESTIMACIONES Y PRONÓSTICOS DEL TAMAÑO DEL MERCADO DE CONCENTRADORES DE COV DE APAC, POR TECNOLOGÍA, 2019-2032 (MILES DE MILLONES DE USD)
    62. TABLA 59. ESTIMACIONES Y PRONÓSTICOS DEL TAMAÑO DEL MERCADO DE CONCENTRADORES DE COV DE APAC, POR INDUSTRIA DE USO FINAL, 2019-2032 (MILES DE MILLONES DE USD)
    63. TABLA 60. ESTIMACIONES Y PRONÓSTICOS DEL TAMAÑO DEL MERCADO DE CONCENTRADORES DE COV DE APAC PRONÓSTICO, POR TIPO DE SISTEMA, 2019-2032 (MILES DE MILLONES DE USD)
    64. TABLA 61. ESTIMACIONES Y PRONÓSTICOS DEL TAMAÑO DEL MERCADO DE CONCENTRADORES DE COV DE APAC, POR REGION, 2019-2032 (MILES DE MILLONES DE USD)
    65. TABLA 62. ESTIMACIONES Y PRONÓSTICOS DEL TAMAÑO DEL MERCADO DE CONCENTRADORES DE COV DE CHINA, POR APLICACIÓN, 2019-2032 (MILES DE MILLONES DE USD)
    66. TABLA 63. ESTIMACIONES Y PRONÓSTICOS DEL TAMAÑO DEL MERCADO DE CONCENTRADORES DE COV DE CHINA, POR TECNOLOGÍA, 2019-2032 (MILES DE MILLONES DE USD)
    67. TABLA 64. ESTIMACIONES Y PRONÓSTICOS DEL TAMAÑO DEL MERCADO DE CONCENTRADORES DE COV DE CHINA PRONÓSTICO, POR INDUSTRIA DE USO FINAL, 2019-2032 (MILES DE MILLONES DE USD)
    68. TABLA 65. ESTIMACIONES Y PRONÓSTICOS DEL TAMAÑO DEL MERCADO DE CONCENTRADORES DE COV DE CHINA, POR TIPO DE SISTEMA, 2019-2032 (MILES DE MILLONES DE USD)
    69. TABLA 66. ESTIMACIONES Y PRONÓSTICOS DEL TAMAÑO DEL MERCADO DE CONCENTRADORES DE COV DE CHINA, POR REGION, 2019-2032 (MILES DE MILLONES DE USD)
    70. TABLA 67. ESTIMACIONES Y PRONÓSTICOS DEL TAMAÑO DEL MERCADO DE CONCENTRADORES DE COV DE INDIA, POR APLICACIÓN, 2019-2032 (MILES DE MILLONES DE USD)
    71. TABLA 68. ESTIMACIONES Y PRONÓSTICOS DEL TAMAÑO DEL MERCADO DE CONCENTRADORES DE COV DE INDIA PRONÓSTICO, POR TECNOLOGÍA, 2019-2032 (MILES DE MILLONES DE USD)
    72. TABLA 69. ESTIMACIONES Y PRONÓSTICOS DEL TAMAÑO DEL MERCADO DE CONCENTRADORES DE COV DE LA INDIA, POR INDUSTRIA DE USO FINAL, 2019-2032 (MILES DE MILLONES DE USD)
    73. TABLA 70. ESTIMACIONES Y PRONÓSTICOS DEL TAMAÑO DEL MERCADO DE CONCENTRADORES DE COV DE LA INDIA, POR TIPO DE SISTEMA, 2019-2032 (MILES DE MILLONES DE USD)
    74. TABLA 71. ESTIMACIONES Y PRONÓSTICOS DEL TAMAÑO DEL MERCADO DE CONCENTRADORES DE COV DE LA INDIA, POR REGION, 2019-2032 (MILES DE MILLONES DE USD)
    75. TABLA 72. ESTIMACIONES Y PRONÓSTICOS DEL TAMAÑO DEL MERCADO DE CONCENTRADORES DE COV DE JAPÓN PRONÓSTICO, POR APLICACIÓN, 2019-2032 (MILES DE MILLONES DE USD)
    76. TABLA 73. ESTIMACIONES Y PRONÓSTICOS DEL TAMAÑO DEL MERCADO DE CONCENTRADORES DE COV DE JAPÓN, POR TECNOLOGÍA, 2019-2032 (MILES DE MILLONES DE USD)
    77. TABLA 74. ESTIMACIONES Y PRONÓSTICOS DEL TAMAÑO DEL MERCADO DE CONCENTRADORES DE COV DE JAPÓN, POR INDUSTRIA DE USO FINAL, 2019-2032 (MILES DE MILLONES DE USD)
    78. TABLA 75. ESTIMACIONES Y PRONÓSTICOS DEL TAMAÑO DEL MERCADO DE CONCENTRADORES DE COV DE JAPÓN, POR TIPO DE SISTEMA, 2019-2032 (MILES DE MILLONES DE USD)
    79. TABLA 76. ESTIMACIONES Y PRONÓSTICOS DEL TAMAÑO DEL MERCADO DE CONCENTRADORES DE COV DE JAPÓN PRONÓSTICO, POR REGION, 2019-2032 (MILES DE MILLONES DE USD)
    80. TABLA 77. ESTIMACIONES Y PRONÓSTICOS DEL TAMAÑO DEL MERCADO DE CONCENTRADORES DE COV DE COREA DEL SUR, POR APLICACIÓN, 2019-2032 (MILES DE MILLONES DE USD)
    81. TABLA 78. ESTIMACIONES Y PRONÓSTICOS DEL TAMAÑO DEL MERCADO DE CONCENTRADORES DE COV DE COREA DEL SUR, POR TECNOLOGÍA, 2019-2032 (MILES DE MILLONES DE USD)
    82. TABLA 79. ESTIMACIONES Y PRONÓSTICOS DEL TAMAÑO DEL MERCADO DE CONCENTRADORES DE COV DE COREA DEL SUR, POR INDUSTRIA DE USO FINAL, 2019-2032 (MILES DE MILLONES DE USD)
    83. TABLA 80. ESTIMACIONES Y PRONÓSTICOS DEL TAMAÑO DEL MERCADO DE CONCENTRADORES DE COV DE COREA DEL SUR PRONÓSTICO, POR TIPO DE SISTEMA, 2019-2032 (MILES DE MILLONES DE USD)
    84. TABLA 81. ESTIMACIONES Y PRONÓSTICOS DEL TAMAÑO DEL MERCADO DE CONCENTRADORES DE COV DE COREA DEL SUR, POR REGION, 2019-2032 (MILES DE MILLONES DE USD)
    85. TABLA 82. ESTIMACIONES Y PRONÓSTICOS DEL TAMAÑO DEL MERCADO DE CONCENTRADORES DE COV DE MALASIA, POR APLICACIÓN, 2019-2032 (MILES DE MILLONES DE USD)
    86. TABLA 83. ESTIMACIONES Y PRONÓSTICOS DEL TAMAÑO DEL MERCADO DE CONCENTRADORES DE COV DE MALASIA, POR TECNOLOGÍA, 2019-2032 (MILES DE MILLONES DE USD)
    87. TABLA 84. ESTIMACIONES Y PRONÓSTICOS DEL TAMAÑO DEL MERCADO DE CONCENTRADORES DE COV DE MALASIA PRONÓSTICO, POR INDUSTRIA DE USO FINAL, 2019-2032 (MILES DE MILLONES DE USD)
    88. TABLA 85. ESTIMACIONES Y PRONÓSTICOS DEL TAMAÑO DEL MERCADO DE CONCENTRADORES DE COV DE MALASIA, POR TIPO DE SISTEMA, 2019-2032 (MILES DE MILLONES DE USD)
    89. TABLA 86. ESTIMACIONES Y PRONÓSTICOS DEL TAMAÑO DEL MERCADO DE CONCENTRADORES DE COV DE MALASIA, POR REGION, 2019-2032 (MILES DE MILLONES DE USD)
    90. TABLA 87. ESTIMACIONES Y PRONÓSTICOS DEL TAMAÑO DEL MERCADO DE CONCENTRADORES DE COV DE TAILANDIA, POR APLICACIÓN, 2019-2032 (MILES DE MILLONES DE USD)
    91. TABLA 88. ESTIMACIONES Y PRONÓSTICOS DEL TAMAÑO DEL MERCADO DE CONCENTRADORES DE COV DE TAILANDIA PRONÓSTICO, POR TECNOLOGÍA, 2019-2032 (MILES DE MILLONES DE USD)
    92. TABLA 89. ESTIMACIONES Y PRONÓSTICOS DEL TAMAÑO DEL MERCADO DE CONCENTRADORES DE COV DE TAILANDIA, POR INDUSTRIA DE USO FINAL, 2019-2032 (MILES DE MILLONES DE USD)
    93. TABLA 90. ESTIMACIONES Y PRONÓSTICOS DEL TAMAÑO DEL MERCADO DE CONCENTRADORES DE COV DE TAILANDIA, POR TIPO DE SISTEMA, 2019-2032 (MILES DE MILLONES DE USD)
    94. TABLA 91. ESTIMACIONES Y PRONÓSTICOS DEL TAMAÑO DEL MERCADO DE CONCENTRADORES DE COV DE TAILANDIA, POR REGION, 2019-2032 (MILES DE MILLONES DE USD)
    95. TABLA 92. ESTIMACIONES Y PRONÓSTICOS DEL TAMAÑO DEL MERCADO DE CONCENTRADORES DE COV DE INDONESIA PRONÓSTICO, POR APLICACIÓN, 2019-2032 (MILES DE MILLONES DE USD)
    96. TABLA 93. ESTIMACIONES Y PRONÓSTICOS DEL TAMAÑO DEL MERCADO DE CONCENTRADORES DE COV DE INDONESIA, POR TECNOLOGÍA, 2019-2032 (MILES DE MILLONES DE USD)
    97. TABLA 94. ESTIMACIONES Y PRONÓSTICOS DEL TAMAÑO DEL MERCADO DE CONCENTRADORES DE COV DE INDONESIA, POR INDUSTRIA DE USO FINAL, 2019-2032 (MILES DE MILLONES DE USD)
    98. TABLA 95. ESTIMACIONES Y PRONÓSTICOS DEL TAMAÑO DEL MERCADO DE CONCENTRADORES DE COV DE INDONESIA, POR TIPO DE SISTEMA, 2019-2032 (MILES DE MILLONES DE USD)
    99. TABLA 96. ESTIMACIONES Y PRONÓSTICOS DEL TAMAÑO DEL MERCADO DE CONCENTRADORES DE COV DE INDONESIA PRONÓSTICO, POR REGION, 2019-2032 (MILES DE MILLONES DE USD)
    100. TABLA 97. RESTO DE LAS ESTIMACIONES Y PRONÓSTICOS DEL TAMAÑO DEL MERCADO DE CONCENTRADORES DE COV DEL APAC, POR APLICACIÓN, 2019-2032 (MILES DE MILLONES DE USD)
    101. TABLA 98. RESTO DE LAS ESTIMACIONES Y PRONÓSTICOS DEL TAMAÑO DEL MERCADO DE CONCENTRADORES DE COV DEL APAC, POR TECNOLOGÍA, 2019-2032 (MILES DE MILLONES DE USD)
    102. TABLA 99. RESTO DE LAS ESTIMACIONES Y PRONÓSTICOS DEL TAMAÑO DEL MERCADO DE CONCENTRADORES DE COV DEL APAC, POR INDUSTRIA DE USO FINAL, 2019-2032 (MILES DE MILLONES DE USD)
    103. TABLA 100. RESTO DE LAS ESTIMACIONES Y PRONÓSTICOS DEL TAMAÑO DEL MERCADO DE CONCENTRADORES DE COV DEL APAC PRONÓSTICO, POR TIPO DE SISTEMA, 2019-2032 (MILES DE MILLONES DE USD)
    104. TABLA 101. RESTO DE LAS ESTIMACIONES Y PRONÓSTICOS DEL TAMAÑO DEL MERCADO DE CONCENTRADORES DE COV DE APAC, POR REGION, 2019-2032 (MILES DE MILLONES DE USD)
    105. TABLA 102. ESTIMACIONES Y PRONÓSTICOS DEL TAMAÑO DEL MERCADO DE CONCENTRADORES DE COV DE AMÉRICA DEL SUR, POR APLICACIÓN, 2019-2032 (MILES DE MILLONES DE USD)
    106. TABLA 103. ESTIMACIONES Y PRONÓSTICOS DEL TAMAÑO DEL MERCADO DE CONCENTRADORES DE COV DE AMÉRICA DEL SUR, POR TECNOLOGÍA, 2019-2032 (MILES DE MILLONES DE USD)
    107. TABLA 104. ESTIMACIONES Y PRONÓSTICOS DEL TAMAÑO DEL MERCADO DE CONCENTRADORES DE COV DE AMÉRICA DEL SUR PRONÓSTICO, POR INDUSTRIA DE USO FINAL, 2019-2032 (MILES DE MILLONES DE USD)
    108. TABLA 105. ESTIMACIONES Y PRONÓSTICOS DEL TAMAÑO DEL MERCADO DE CONCENTRADORES DE COV DE SUDAMÉRICA, POR TIPO DE SISTEMA, 2019-2032 (MILES DE MILLONES DE USD)
    109. TABLA 106. ESTIMACIONES Y PRONÓSTICOS DEL TAMAÑO DEL MERCADO DE CONCENTRADORES DE COV DE SUDAMÉRICA, POR REGION, 2019-2032 (MILES DE MILLONES DE USD)
    110. TABLA 107. ESTIMACIONES Y PRONÓSTICOS DEL TAMAÑO DEL MERCADO DE CONCENTRADORES DE COV DE BRASIL, POR APLICACIÓN, 2019-2032 (MILES DE MILLONES DE USD)
    111. TABLA 108. ESTIMACIONES Y PRONÓSTICOS DEL TAMAÑO DEL MERCADO DE CONCENTRADORES DE COV DE BRASIL PRONÓSTICO, POR TECNOLOGÍA, 2019-2032 (MILES DE MILLONES DE USD)
    112. TABLA 109. ESTIMACIONES Y PRONÓSTICOS DEL TAMAÑO DEL MERCADO DE CONCENTRADORES DE COV DE BRASIL, POR INDUSTRIA DE USO FINAL, 2019-2032 (MILES DE MILLONES DE USD)
    113. TABLA 110. ESTIMACIONES Y PRONÓSTICOS DEL TAMAÑO DEL MERCADO DE CONCENTRADORES DE COV DE BRASIL, POR TIPO DE SISTEMA, 2019-2032 (MILES DE MILLONES DE USD)
    114. TABLA 111. ESTIMACIONES Y PRONÓSTICOS DEL TAMAÑO DEL MERCADO DE CONCENTRADORES DE COV DE BRASIL, POR REGION, 2019-2032 (MILES DE MILLONES DE USD)
    115. TABLA 112. ESTIMACIONES Y PRONÓSTICOS DEL TAMAÑO DEL MERCADO DE CONCENTRADORES DE COV DE MÉXICO PRONÓSTICO, POR APLICACIÓN, 2019-2032 (MILES DE MILLONES DE USD)
    116. TABLA 113. ESTIMACIONES Y PRONÓSTICOS DEL TAMAÑO DEL MERCADO DE CONCENTRADORES DE COV DE MÉXICO, POR TECNOLOGÍA, 2019-2032 (MILES DE MILLONES DE USD)
    117. TABLA 114. ESTIMACIONES Y PRONÓSTICOS DEL TAMAÑO DEL MERCADO DE CONCENTRADORES DE COV DE MÉXICO, POR INDUSTRIA DE USO FINAL, 2019-2032 (MILES DE MILLONES DE USD)
    118. TABLA 115. ESTIMACIONES Y PRONÓSTICOS DEL TAMAÑO DEL MERCADO DE CONCENTRADORES DE COV DE MÉXICO, POR TIPO DE SISTEMA, 2019-2032 (MILES DE MILLONES DE USD)
    119. TABLA 116. ESTIMACIONES Y PRONÓSTICOS DEL TAMAÑO DEL MERCADO DE CONCENTRADORES DE COV DE MÉXICO PRONÓSTICO, POR REGION, 2019-2032 (MILES DE MILLONES DE USD)
    120. TABLA 117. ESTIMACIONES Y PRONÓSTICOS DEL TAMAÑO DEL MERCADO DE CONCENTRADORES DE COV DE ARGENTINA, POR APLICACIÓN, 2019-2032 (MILES DE MILLONES DE USD)
    121. TABLA 118. ESTIMACIONES Y PRONÓSTICOS DEL TAMAÑO DEL MERCADO DE CONCENTRADORES DE COV DE ARGENTINA, POR TECNOLOGÍA, 2019-2032 (MILES DE MILLONES DE USD)
    122. TABLA 119. ESTIMACIONES Y PRONÓSTICOS DEL TAMAÑO DEL MERCADO DE CONCENTRADORES DE COV DE ARGENTINA, POR INDUSTRIA DE USO FINAL, 2019-2032 (MILES DE MILLONES DE USD)
    123. TABLA 120. ESTIMACIONES Y PRONÓSTICOS DEL TAMAÑO DEL MERCADO DE CONCENTRADORES DE COV DE ARGENTINA PRONÓSTICO, POR TIPO DE SISTEMA, 2019-2032 (MILES DE MILLONES DE USD)
    124. TABLA 121. ESTIMACIONES Y PRONÓSTICOS DEL TAMAÑO DEL MERCADO DE CONCENTRADORES DE COV DE ARGENTINA, POR REGION, 2019-2032 (MILES DE MILLONES DE USD)
    125. TABLA 122. ESTIMACIONES Y PRONÓSTICOS DEL TAMAÑO DEL MERCADO DE CONCENTRADORES DE COV DEL RESTO DE SUDAMÉRICA, POR APLICACIÓN, 2019-2032 (MILES DE MILLONES DE USD)
    126. TABLA 123. ESTIMACIONES Y PRONÓSTICOS DEL TAMAÑO DEL MERCADO DE CONCENTRADORES DE COV DEL RESTO DE SUDAMÉRICA, POR TECNOLOGÍA, 2019-2032 (MILES DE MILLONES DE USD)
    127. TABLA 124. ESTIMACIONES Y PRONÓSTICOS DEL TAMAÑO DEL MERCADO DE CONCENTRADORES DE COV DEL RESTO DE SUDAMÉRICA PRONÓSTICO, POR INDUSTRIA DE USO FINAL, 2019-2032 (MILES DE MILLONES DE USD)
    128. TABLA 125. ESTIMACIONES Y PRONÓSTICOS DEL TAMAÑO DEL MERCADO DE CONCENTRADORES DE COV DEL RESTO DE SUDAMÉRICA, POR TIPO DE SISTEMA, 2019-2032 (MILES DE MILLONES DE USD)
    129. TABLA 126. ESTIMACIONES Y PRONÓSTICOS DEL TAMAÑO DEL MERCADO DE CONCENTRADORES DE COV DEL RESTO DE SUDAMÉRICA, POR REGION, 2019-2032 (MILES DE MILLONES DE USD)
    130. TABLA 127. ESTIMACIONES Y PRONÓSTICOS DEL TAMAÑO DEL MERCADO DE CONCENTRADORES DE COV DE MEA, POR APLICACIÓN, 2019-2032 (MILES DE MILLONES DE USD)
    131. TABLA 128. ESTIMACIONES Y PRONÓSTICOS DEL TAMAÑO DEL MERCADO DE CONCENTRADORES DE COV DE MEA PRONÓSTICO, POR TECNOLOGÍA, 2019-2032 (MILES DE MILLONES DE USD)
    132. TABLA 129. ESTIMACIONES Y PRONÓSTICOS DEL TAMAÑO DEL MERCADO DE CONCENTRADORES DE COV DE MEA, POR INDUSTRIA DE USO FINAL, 2019-2032 (MILES DE MILLONES DE USD)
    133. TABLA 130. ESTIMACIONES Y PRONÓSTICOS DEL TAMAÑO DEL MERCADO DE CONCENTRADORES DE COV DE MEA, POR TIPO DE SISTEMA, 2019-2032 (MILES DE MILLONES DE USD)
    134. TABLA 131. ESTIMACIONES Y PRONÓSTICOS DEL TAMAÑO DEL MERCADO DE CONCENTRADORES DE COV DE MEA, POR REGION, 2019-2032 (MILES DE MILLONES DE USD)
    135. TABLA 132. ESTIMACIONES Y PRONÓSTICOS DEL TAMAÑO DEL MERCADO DE CONCENTRADORES DE COV DE PAÍSES DEL CCG PRONÓSTICO, POR APLICACIÓN, 2019-2032 (MILES DE MILLONES DE USD)
    136. TABLA 133. ESTIMACIONES Y PRONÓSTICOS DEL TAMAÑO DEL MERCADO DE CONCENTRADORES DE COV DE LOS PAÍSES DEL CCG, POR TECNOLOGÍA, 2019-2032 (MILES DE MILLONES DE USD)
    137. TABLA 134. ESTIMACIONES Y PRONÓSTICOS DEL TAMAÑO DEL MERCADO DE CONCENTRADORES DE COV DE LOS PAÍSES DEL CCG, POR INDUSTRIA DE USO FINAL, 2019-2032 (MILES DE MILLONES DE USD)
    138. TABLA 135. ESTIMACIONES Y PRONÓSTICOS DEL TAMAÑO DEL MERCADO DE CONCENTRADORES DE COV DE LOS PAÍSES DEL CCG, POR TIPO DE SISTEMA, 2019-2032 (MILES DE MILLONES DE USD)
    139. TABLA 136. ESTIMACIONES Y PRONÓSTICOS DEL TAMAÑO DEL MERCADO DE CONCENTRADORES DE COV DE LOS PAÍSES DEL CCG PRONÓSTICO, POR REGION, 2019-2032 (MILES DE MILLONES DE USD)
    140. TABLA 137. ESTIMACIONES Y PRONÓSTICOS DEL TAMAÑO DEL MERCADO DE CONCENTRADORES DE COV DE SUDÁFRICA, POR APLICACIÓN, 2019-2032 (MILES DE MILLONES DE USD)
    141. TABLA 138. ESTIMACIONES Y PRONÓSTICOS DEL TAMAÑO DEL MERCADO DE CONCENTRADORES DE COV DE SUDÁFRICA, POR TECNOLOGÍA, 2019-2032 (MILES DE MILLONES DE USD)
    142. TABLA 139. ESTIMACIONES Y PRONÓSTICOS DEL TAMAÑO DEL MERCADO DE CONCENTRADORES DE COV DE SUDÁFRICA, POR INDUSTRIA DE USO FINAL, 2019-2032 (MILES DE MILLONES DE USD)
    143. TABLA 140. ESTIMACIONES Y PRONÓSTICOS DEL TAMAÑO DEL MERCADO DE CONCENTRADORES DE COV DE SUDÁFRICA PRONÓSTICO, POR TIPO DE SISTEMA, 2019-2032 (MILES DE MILLONES DE USD)
    144. TABLA 141. ESTIMACIONES Y PRONÓSTICOS DEL TAMAÑO DEL MERCADO DE CONCENTRADORES DE COV DE SUDÁFRICA, POR REGION, 2019-2032 (MILES DE MILLONES DE USD)
    145. TABLA 142. ESTIMACIONES Y PRONÓSTICOS DEL TAMAÑO DEL MERCADO DE CONCENTRADORES DE COV DEL RESTO DE MEA, POR APLICACIÓN, 2019-2032 (MILES DE MILLONES DE USD)
    146. TABLA 143. ESTIMACIONES Y PRONÓSTICOS DEL TAMAÑO DEL MERCADO DE CONCENTRADORES DE COV DEL RESTO DE MEA, POR TECNOLOGÍA, 2019-2032 (MILES DE MILLONES DE USD)
    147. TABLA 144. ESTIMACIONES Y PRONÓSTICOS DEL TAMAÑO DEL MERCADO DE CONCENTRADORES DE COV DEL RESTO DE MEA PRONÓSTICO, POR INDUSTRIA DE USO FINAL, 2019-2032 (MILES DE MILLONES DE USD)
    148. TABLA 145. ESTIMACIONES Y PRONÓSTICOS DEL TAMAÑO DEL MERCADO DE CONCENTRADORES DE COV DEL RESTO DE MEA, POR TIPO DE SISTEMA, 2019-2032 (MILES DE MILLONES DE USD)
    149. TABLA 146. ESTIMACIONES Y PRONÓSTICOS DEL TAMAÑO DEL MERCADO DE CONCENTRADORES DE COV DEL RESTO DE MEA, PRONÓSTICO, POR REGION, 2019-2032 (MILES DE MILLONES DE USD)
    150. TABLA 147. LANZAMIENTO DE PRODUCTO/DESARROLLO DE PRODUCTO/APROBACIÓN DE PRODUCTO
    151. TABLA 148. ADQUISICIÓN/ASOCIACIÓN
    152. LISTA DE FIGURAS
    153. FIGURA 1. SINOPSIS DEL MERCADO
    154. FIGURA 2. ANÁLISIS DEL MERCADO DE CONCENTRADORES DE COV DE AMÉRICA DEL NORTE
    155. FIGURA 3. ANÁLISIS DEL MERCADO DE CONCENTRADORES DE COV DE EE. UU. POR APLICACIÓN
    156. FIGURA 4. ANÁLISIS DEL MERCADO DE CONCENTRADORES DE COV DE EE. UU. POR TECNOLOGÍA
    157. FIGURA 5. ANÁLISIS DEL MERCADO DE CONCENTRADORES DE COV DE EE. UU. POR INDUSTRIA DE USO FINAL
    158. FIGURA 6. ANÁLISIS DEL MERCADO DE CONCENTRADORES DE COV DE EE. UU. POR TIPO DE SISTEMA
    159. FIGURA 7. ANÁLISIS DEL MERCADO DE CONCENTRADORES DE COV DE EE. UU. POR REGIÓN
    160. FIGURA 8. ANÁLISIS DEL MERCADO DE CONCENTRADORES DE COV DE CANADÁ POR APLICACIÓN
    161. FIGURA 9. ANÁLISIS DEL MERCADO DE CONCENTRADORES DE COV DE CANADÁ POR TECNOLOGÍA
    162. FIGURA 10. ANÁLISIS DEL MERCADO DE CONCENTRADORES DE COV DE CANADÁ POR INDUSTRIA DE USO FINAL
    163. FIGURA 11. ANÁLISIS DEL MERCADO DE CONCENTRADORES DE COV DE CANADÁ POR TIPO DE SISTEMA
    164. FIGURA 12. ANÁLISIS DEL MERCADO DE CONCENTRADORES DE COV DE CANADÁ POR REGIONAL
    165. FIGURA 13. ANÁLISIS DEL MERCADO DE CONCENTRADORES DE COV DE EUROPA
    166. FIGURA 14. ANÁLISIS DEL MERCADO DE CONCENTRADORES DE COV DE ALEMANIA POR APLICACIÓN
    167. FIGURA 15. MERCADO DE CONCENTRADORES DE COV DE ALEMANIA ANÁLISIS POR TECNOLOGÍA
    168. FIGURA 16. ANÁLISIS DEL MERCADO DE CONCENTRADORES DE COV DE ALEMANIA POR INDUSTRIA DE USO FINAL
    169. FIGURA 17. ANÁLISIS DEL MERCADO DE CONCENTRADORES DE COV DE ALEMANIA POR TIPO DE SISTEMA
    170. FIGURA 18. ANÁLISIS DEL MERCADO DE CONCENTRADORES DE COV DE ALEMANIA POR REGIONAL
    171. FIGURA 19. ANÁLISIS DEL MERCADO DE CONCENTRADORES DE COV DEL REINO UNIDO POR APLICACIÓN
    172. FIGURA 20. ANÁLISIS DEL MERCADO DE CONCENTRADORES DE COV DEL REINO UNIDO POR TECNOLOGÍA
    173. FIGURA 21. ANÁLISIS DEL MERCADO DE CONCENTRADORES DE COV DEL REINO UNIDO POR INDUSTRIA DE USO FINAL
    174. FIGURA 22. ANÁLISIS DEL MERCADO DE CONCENTRADORES DE COV DEL REINO UNIDO POR TIPO DE SISTEMA
    175. FIGURA 23. ANÁLISIS DEL MERCADO DE CONCENTRADORES DE COV DEL REINO UNIDO POR REGIONAL Figura 24. Análisis del mercado de concentradores de COV en Francia por aplicación. Figura 25. Análisis del mercado de concentradores de COV en Francia por tecnología. Figura 26. Análisis del mercado de concentradores de COV en Francia por sector de uso final. Figura 27. Análisis del mercado de concentradores de COV en Francia por tipo de sistema. Figura 28. Análisis del mercado de concentradores de COV en Francia por región. Figura 29. Análisis del mercado de concentradores de COV en Rusia por aplicación. Figura 30. Análisis del mercado de concentradores de COV en Rusia por tecnología. Figura 31. Análisis del mercado de concentradores de COV en Rusia por sector de uso final. Figura 32. Análisis del mercado de concentradores de COV en Rusia por tipo de sistema. Figura 33. Análisis del mercado de concentradores de COV en Rusia por región. Figura 34. Análisis del mercado de concentradores de COV en Italia por aplicación. Figura 35. Análisis del mercado de concentradores de COV en Italia por tecnología. Figura 36. Análisis del mercado de concentradores de COV en Italia por sector de uso final. Figura 37. Análisis del mercado de concentradores de COV en Italia por tipo de sistema. Figura 38. Análisis del mercado de concentradores de COV en Italia por región. Figura 39. Análisis del mercado de concentradores de COV en España por aplicación. Figura 40. Análisis del mercado español de concentradores de COV por tecnología. Figura 41. Análisis del mercado español de concentradores de COV por sector de uso final. Figura 42. Análisis del mercado español de concentradores de COV por tipo de sistema. Figura 43. Análisis del mercado español de concentradores de COV por región. Figura 44. Análisis del mercado europeo de concentradores de COV por aplicación. Figura 45. Análisis del mercado europeo de concentradores de COV por tecnología. Figura 46. Análisis del mercado europeo de concentradores de COV por sector de uso final. Figura 47. Mercado europeo de concentradores de COV. ANÁLISIS POR TIPO DE SISTEMA
    176. FIGURA 48. ANÁLISIS DEL MERCADO DE CONCENTRADORES DE COV EN EL RESTO DE EUROPA POR REGIÓN
    177. FIGURA 49. ANÁLISIS DEL MERCADO DE CONCENTRADORES DE COV EN APAC
    178. FIGURA 50. ANÁLISIS DEL MERCADO DE CONCENTRADORES DE COV EN CHINA POR APLICACIÓN
    179. FIGURA 51. ANÁLISIS DEL MERCADO DE CONCENTRADORES DE COV EN CHINA POR TECNOLOGÍA
    180. FIGURA 52. ANÁLISIS DEL MERCADO DE CONCENTRADORES DE COV EN CHINA POR INDUSTRIA DE USO FINAL
    181. FIGURA 53. ANÁLISIS DEL MERCADO DE CONCENTRADORES DE COV EN CHINA POR TIPO DE SISTEMA
    182. FIGURA 54. ANÁLISIS DEL MERCADO DE CONCENTRADORES DE COV EN CHINA POR REGION
    183. FIGURA 55. ANÁLISIS DEL MERCADO DE CONCENTRADORES DE COV EN INDIA POR APLICACIÓN
    184. FIGURA 56. ANÁLISIS DEL MERCADO DE CONCENTRADORES DE COV DE LA INDIA POR TECNOLOGÍA
    185. FIGURA 57. ANÁLISIS DEL MERCADO DE CONCENTRADORES DE COV DE LA INDIA POR INDUSTRIA DE USO FINAL
    186. FIGURA 58. ANÁLISIS DEL MERCADO DE CONCENTRADORES DE COV DE LA INDIA POR TIPO DE SISTEMA
    187. FIGURA 59. ANÁLISIS DEL MERCADO DE CONCENTRADORES DE COV DE LA INDIA POR REGIONAL
    188. FIGURA 60. ANÁLISIS DEL MERCADO DE CONCENTRADORES DE COV DE JAPÓN POR APLICACIÓN
    189. FIGURA 61. ANÁLISIS DEL MERCADO DE CONCENTRADORES DE COV DE JAPÓN POR TECNOLOGÍA
    190. FIGURA 62. ANÁLISIS DEL MERCADO DE CONCENTRADORES DE COV DE JAPÓN POR INDUSTRIA DE USO FINAL
    191. FIGURA 63. ANÁLISIS DEL MERCADO DE CONCENTRADORES DE COV DE JAPÓN POR TIPO DE SISTEMA
    192. FIGURA 64. JAPÓN ANÁLISIS DEL MERCADO DE CONCENTRADORES DE COV POR REGIONALIDAD
    193. FIGURA 65. ANÁLISIS DEL MERCADO DE CONCENTRADORES DE COV DE COREA DEL SUR POR APLICACIÓN
    194. FIGURA 66. ANÁLISIS DEL MERCADO DE CONCENTRADORES DE COV DE COREA DEL SUR POR TECNOLOGÍA
    195. FIGURA 67. ANÁLISIS DEL MERCADO DE CONCENTRADORES DE COV DE COREA DEL SUR POR INDUSTRIA DE USO FINAL
    196. FIGURA 68. ANÁLISIS DEL MERCADO DE CONCENTRADORES DE COV DE COREA DEL SUR POR TIPO DE SISTEMA
    197. FIGURA 69. ANÁLISIS DEL MERCADO DE CONCENTRADORES DE COV DE COREA DEL SUR POR REGIONALIDAD
    198. FIGURA 70. ANÁLISIS DEL MERCADO DE CONCENTRADORES DE COV DE MALASIA POR APLICACIÓN
    199. FIGURA 71. ANÁLISIS DEL MERCADO DE CONCENTRADORES DE COV DE MALASIA POR TECNOLOGÍA
    200. FIGURA 72. ANÁLISIS DEL MERCADO DE CONCENTRADORES DE COV DE MALASIA POR INDUSTRIA DE USO FINAL
    201. FIGURA 73. ANÁLISIS DEL MERCADO DE CONCENTRADORES DE COV DE MALASIA POR TIPO DE SISTEMA
    202. FIGURA 74. ANÁLISIS DEL MERCADO DE CONCENTRADORES DE COV DE MALASIA POR REGIONAL
    203. FIGURA 75. ANÁLISIS DEL MERCADO DE CONCENTRADORES DE COV DE TAILANDIA POR APLICACIÓN
    204. FIGURA 76. ANÁLISIS DEL MERCADO DE CONCENTRADORES DE COV DE TAILANDIA POR TECNOLOGÍA
    205. FIGURA 77. ANÁLISIS DEL MERCADO DE CONCENTRADORES DE COV DE TAILANDIA POR INDUSTRIA DE USO FINAL
    206. FIGURA 78. ANÁLISIS DEL MERCADO DE CONCENTRADORES DE COV DE TAILANDIA POR TIPO DE SISTEMA
    207. FIGURA 79. COV DE TAILANDIA ANÁLISIS DEL MERCADO DE CONCENTRADORES POR REGIONALIDAD
    208. FIGURA 80. ANÁLISIS DEL MERCADO DE CONCENTRADORES DE COV DE INDONESIA POR APLICACIÓN
    209. FIGURA 81. ANÁLISIS DEL MERCADO DE CONCENTRADORES DE COV DE INDONESIA POR TECNOLOGÍA
    210. FIGURA 82. ANÁLISIS DEL MERCADO DE CONCENTRADORES DE COV DE INDONESIA POR INDUSTRIA DE USO FINAL
    211. FIGURA 83. ANÁLISIS DEL MERCADO DE CONCENTRADORES DE COV DE INDONESIA POR TIPO DE SISTEMA
    212. FIGURA 84. ANÁLISIS DEL MERCADO DE CONCENTRADORES DE COV DE INDONESIA POR REGIONALIDAD
    213. FIGURA 85. ANÁLISIS DEL MERCADO DE CONCENTRADORES DE COV DE RESTO DE APAC POR APLICACIÓN
    214. FIGURA 86. ANÁLISIS DEL MERCADO DE CONCENTRADORES DE COV DE RESTO DE APAC POR TECNOLOGÍA
    215. FIGURA 87. ANÁLISIS DEL MERCADO DE CONCENTRADORES DE COV EN EL RESTO DE APAC POR INDUSTRIA DE USO FINAL
    216. FIGURA 88. ANÁLISIS DEL MERCADO DE CONCENTRADORES DE COV EN EL RESTO DE APAC POR TIPO DE SISTEMA
    217. FIGURA 89. ANÁLISIS DEL MERCADO DE CONCENTRADORES DE COV EN EL RESTO DE APAC POR REGION
    218. FIGURA 90. ANÁLISIS DEL MERCADO DE CONCENTRADORES DE COV EN SUDAMÉRICA
    219. FIGURA 91. ANÁLISIS DEL MERCADO DE CONCENTRADORES DE COV EN BRASIL POR APLICACIÓN
    220. FIGURA 92. ANÁLISIS DEL MERCADO DE CONCENTRADORES DE COV EN BRASIL POR TECNOLOGÍA
    221. FIGURA 93. ANÁLISIS DEL MERCADO DE CONCENTRADORES DE COV EN BRASIL POR INDUSTRIA DE USO FINAL
    222. FIGURA 94. ANÁLISIS DEL MERCADO DE CONCENTRADORES DE COV EN BRASIL POR TIPO DE SISTEMA FIGURA 95. ANÁLISIS DEL MERCADO DE CONCENTRADORES DE COV DE BRASIL POR REGIONAL
    223. FIGURA 96. ANÁLISIS DEL MERCADO DE CONCENTRADORES DE COV DE MÉXICO POR APLICACIÓN
    224. FIGURA 97. ANÁLISIS DEL MERCADO DE CONCENTRADORES DE COV DE MÉXICO POR TECNOLOGÍA
    225. FIGURA 98. ANÁLISIS DEL MERCADO DE CONCENTRADORES DE COV DE MÉXICO POR INDUSTRIA DE USO FINAL
    226. FIGURA 99. ANÁLISIS DEL MERCADO DE CONCENTRADORES DE COV DE MÉXICO POR TIPO DE SISTEMA
    227. FIGURA 100. ANÁLISIS DEL MERCADO DE CONCENTRADORES DE COV DE MÉXICO POR REGIONAL
    228. FIGURA 101. ANÁLISIS DEL MERCADO DE CONCENTRADORES DE COV DE ARGENTINA POR APLICACIÓN
    229. FIGURA 102. ANÁLISIS DEL MERCADO DE CONCENTRADORES DE COV DE ARGENTINA POR TECNOLOGÍA
    230. FIGURA 103. ANÁLISIS DEL MERCADO DE CONCENTRADORES DE COV EN ARGENTINA POR INDUSTRIA DE USO FINAL
    231. FIGURA 104. ANÁLISIS DEL MERCADO DE CONCENTRADORES DE COV EN ARGENTINA POR TIPO DE SISTEMA
    232. FIGURA 105. ANÁLISIS DEL MERCADO DE CONCENTRADORES DE COV EN ARGENTINA POR REGIONAL
    233. FIGURA 106. ANÁLISIS DEL MERCADO DE CONCENTRADORES DE COV EN EL RESTO DE SUDAMÉRICA POR APLICACIÓN
    234. FIGURA 107. ANÁLISIS DEL MERCADO DE CONCENTRADORES DE COV EN EL RESTO DE SUDAMÉRICA POR TECNOLOGÍA
    235. FIGURA 108. ANÁLISIS DEL MERCADO DE CONCENTRADORES DE COV EN EL RESTO DE SUDAMÉRICA POR INDUSTRIA DE USO FINAL
    236. FIGURA 109. CONCENTRADORES DE COV EN EL RESTO DE SUDAMÉRICA ANÁLISIS DE MERCADO POR TIPO DE SISTEMA
    237. FIGURA 110. ANÁLISIS DEL MERCADO DE CONCENTRADORES DE COV DEL RESTO DE SUDAMÉRICA POR REGION
    238. FIGURA 111. ANÁLISIS DEL MERCADO DE CONCENTRADORES DE COV DE MEA
    239. FIGURA 112. ANÁLISIS DEL MERCADO DE CONCENTRADORES DE COV DE LOS PAÍSES DEL CCG POR APLICACIÓN
    240. FIGURA 113. ANÁLISIS DEL MERCADO DE CONCENTRADORES DE COV DE LOS PAÍSES DEL CCG POR TECNOLOGÍA
    241. FIGURA 114. ANÁLISIS DEL MERCADO DE CONCENTRADORES DE COV DE LOS PAÍSES DEL CCG POR INDUSTRIA DE USO FINAL
    242. FIGURA 115. ANÁLISIS DEL MERCADO DE CONCENTRADORES DE COV DE LOS PAÍSES DEL CCG POR TIPO DE SISTEMA
    243. FIGURA 116. ANÁLISIS DE CONCENTRADORES DE COV DE LOS PAÍSES DEL CCG

Segmentación del mercado de concentradores de COV

  • Mercado de concentradores de COV por aplicación (miles de millones de USD, 2019-2032)
    • Industrial
    • Comercial
    • Residencial
    • Automotriz
  • Mercado de concentradores de COV por tecnología (miles de millones de USD, 2019-2032)
    • Oxidación térmica
    • Adsorción
    • Tratamiento biológico
    • Separación por membranas
  • Mercado de concentradores de COV por industria de uso final (miles de millones de USD, 2019-2032)
    • Química Fabricación
    • Farmacéutica
    • Alimentos y bebidas
    • Impresión y recubrimiento
  • Mercado de concentradores de COV por tipo de sistema (miles de millones de USD, 2019-2032)
    • Sistemas portátiles
    • Sistemas estacionarios
    • Sistemas modulares
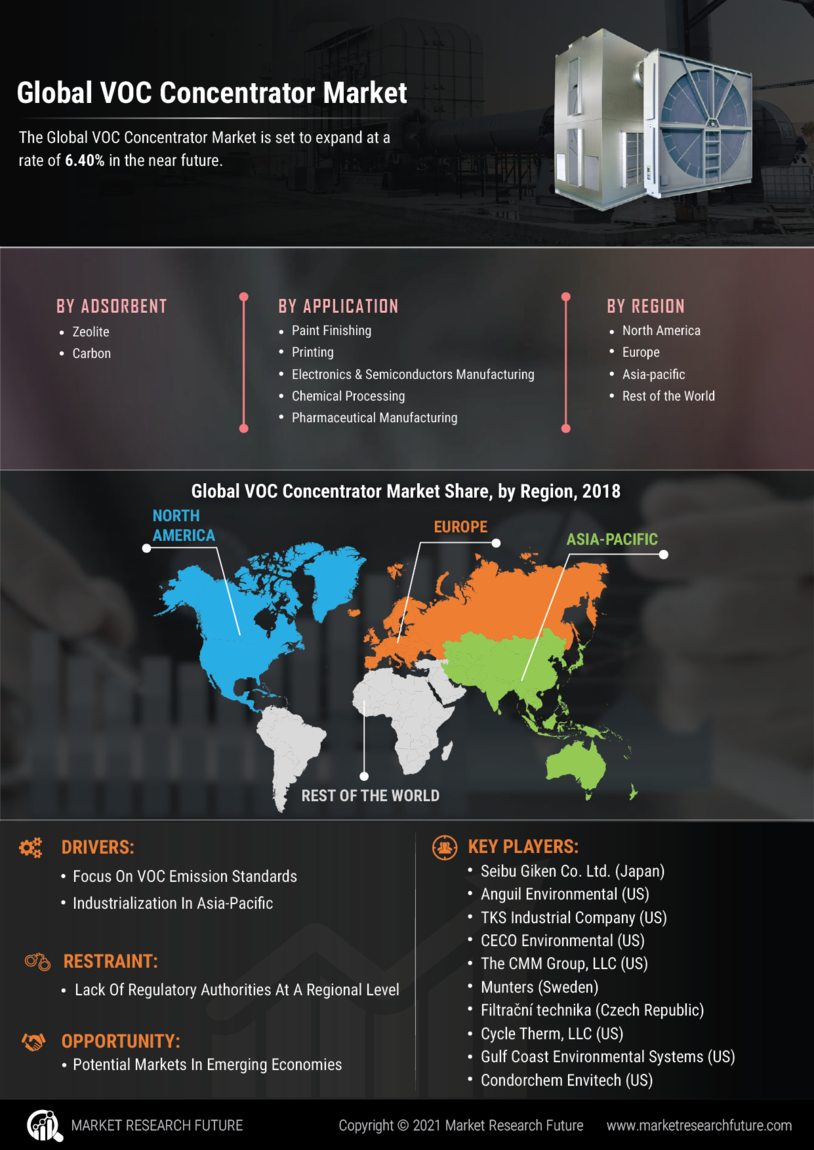
  • Mercado de concentradores de COV por región (miles de millones de USD, 2019-2032)
    • América del Norte
    • Europa
    • América del Sur
    • Asia Pacífico
    • Oriente Medio y África

Perspectiva regional del mercado de concentradores de COV (miles de millones de USD, 2019-2032)

  • Perspectivas de América del Norte (miles de millones de USD, 2019-2032)
    • Mercado de concentradores de COV en América del Norte por tipo de aplicación
      • Industrial
      • Comercial
      • Residencial
      • Automotriz
    • Mercado de concentradores de COV en América del Norte por tipo de tecnología
      • Oxidación térmica
      • Adsorción
      • Tratamiento biológico
      • Separación por membranas
    • Mercado de concentradores de COV en América del Norte por tipo de industria de uso final
      • Fabricación de productos químicos
      • Productos farmacéuticos
      • Alimentos y bebidas
      • Impresión y recubrimiento
    • América del Norte Mercado de concentradores de COV por tipo de sistema
      • Sistemas portátiles
      • Sistemas estacionarios
      • Sistemas modulares
    • Mercado de concentradores de COV en Norteamérica por tipo regional
      • EE. UU.
      • Canadá
    • Perspectivas para EE. UU. (miles de millones de USD, 2019-2032)
    • Mercado de concentradores de COV en EE. UU. por tipo de aplicación
      • Industrial
      • Comercial
      • Residencial
      • Automotriz
    • Mercado de concentradores de COV en EE. UU. por tipo de tecnología
      • Oxidación térmica
      • Adsorción
      • Tratamiento biológico
      • Membrana Separación
    • Mercado de concentradores de COV en EE. UU. por tipo de industria de uso final
      • Fabricación de productos químicos
      • Productos farmacéuticos
      • Alimentos y bebidas
      • Impresión y recubrimiento
    • Mercado de concentradores de COV en EE. UU. por tipo de sistema
      • Sistemas portátiles
      • Sistemas estacionarios
      • Sistemas modulares
    • Perspectivas de Canadá (miles de millones de USD, 2019-2032)
    • Mercado de concentradores de COV en Canadá por tipo de aplicación
      • Industrial
      • Comercial
      • Residencial
      • Automotriz
    • Mercado de concentradores de COV en Canadá por tecnología Tipo
      • Oxidación térmica
      • Adsorción
      • Tratamiento biológico
      • Separación por membranas
    • Mercado canadiense de concentradores de COV por tipo de industria de uso final
      • Fabricación de productos químicos
      • Productos farmacéuticos
      • Alimentos y bebidas
      • Impresión y recubrimiento
    • Mercado canadiense de concentradores de COV por tipo de sistema
      • Sistemas portátiles
      • Sistemas estacionarios
      • Sistemas modulares
    • Perspectivas en Europa (miles de millones de USD, 2019-2032)
      • Mercado europeo de concentradores de COV por aplicación Tipo
        • Industrial
        • Comercial
        • Residencial
        • Automotriz
      • Mercado europeo de concentradores de COV por tipo de tecnología
        • Oxidación térmica
        • Adsorción
        • Tratamiento biológico
        • Separación por membranas
      • Mercado europeo de concentradores de COV por tipo de industria de uso final
        • Fabricación química
        • Productos farmacéuticos
        • Alimentos y bebidas
        • Impresión y recubrimiento
      • Mercado europeo de concentradores de COV por tipo de sistema
        • Sistemas portátiles
        • Sistemas estacionarios
        • Modular Sistemas
      • Mercado europeo de concentradores de COV por tipo regional
        • Alemania
        • Reino Unido
        • Francia
        • Rusia
        • Italia
        • España
        • Resto de Europa
      • Perspectivas para ALEMANIA (miles de millones de USD, 2019-2032)
      • Mercado alemán de concentradores de COV por tipo de aplicación
        • Industrial
        • Comercial
        • Residencial
        • Automotriz
      • Mercado alemán de concentradores de COV por tipo de tecnología
        • Oxidación térmica
        • Adsorción
        • Biológica Tratamiento
        • Separación por membranas
      • Mercado de concentradores de COV en ALEMANIA por tipo de industria de uso final
        • Fabricación de productos químicos
        • Productos farmacéuticos
        • Alimentos y bebidas
        • Impresión y recubrimiento
      • Mercado de concentradores de COV en ALEMANIA por tipo de sistema
        • Sistemas portátiles
        • Sistemas estacionarios
        • Sistemas modulares
      • Perspectivas para el Reino Unido (miles de millones de USD, 2019-2032)
      • Mercado de concentradores de COV en el Reino Unido por aplicación Tipo
        • Industrial
        • Comercial
        • Residencial
        • Automotriz
      • Mercado de concentradores de COV en el Reino Unido por tipo de tecnología
        • Oxidación térmica
        • Adsorción
        • Tratamiento biológico
        • Separación por membranas
      • Mercado de concentradores de COV en el Reino Unido por tipo de industria de uso final
        • Fabricación de productos químicos
        • Productos farmacéuticos
        • Alimentos y bebidas
        • Impresión y recubrimiento
      • Mercado de concentradores de COV en el Reino Unido por tipo de sistema
        • Sistemas portátiles
        • Sistemas estacionarios
        • Modular Sistemas
      • Perspectivas de FRANCIA (miles de millones de USD, 2019-2032)
      • Mercado de concentradores de COV en FRANCIA por tipo de aplicación
        • Industrial
        • Comercial
        • Residencial
        • Automotriz
      • Mercado de concentradores de COV en FRANCIA por tipo de tecnología
        • Oxidación térmica
        • Adsorción
        • Tratamiento biológico
        • Separación por membranas
      • Mercado de concentradores de COV en FRANCIA por tipo de industria de uso final
        • Fabricación química
        • Productos farmacéuticos
        • Alimentos y bebidas
        • Impresión y Recubrimiento
      • Mercado de concentradores de COV en Francia por tipo de sistema
        • Sistemas portátiles
        • Sistemas estacionarios
        • Sistemas modulares
      • Perspectivas para Rusia (miles de millones de USD, 2019-2032)
      • Mercado de concentradores de COV en Rusia por tipo de aplicación
        • Industrial
        • Comercial
        • Residencial
        • Automotriz
      • Mercado de concentradores de COV en Rusia por tipo de tecnología
        • Oxidación térmica
        • Adsorción
        • Tratamiento biológico
        • Separación por membranas
      • Mercado de concentradores de COV en Rusia por Tipo de industria de uso final
        • Fabricación de productos químicos
        • Productos farmacéuticos
        • Alimentos y bebidas
        • Impresión y recubrimiento
      • Mercado de concentradores de COV en Rusia por tipo de sistema
        • Sistemas portátiles
        • Sistemas estacionarios
        • Sistemas modulares
      • Perspectivas en Italia (miles de millones de USD, 2019-2032)
      • Mercado de concentradores de COV en Italia por tipo de aplicación
        • Industrial
        • Comercial
        • Residencial
        • Automotriz
      • Mercado de concentradores de COV en Italia por tipo de tecnología
        • Térmica Oxidación
        • Adsorción
        • Tratamiento biológico
        • Separación por membranas
      • Mercado italiano de concentradores de COV por tipo de industria de uso final
        • Fabricación química
        • Productos farmacéuticos
        • Alimentos y bebidas
        • Impresión y recubrimiento
      • Mercado italiano de concentradores de COV por tipo de sistema
        • Sistemas portátiles
        • Sistemas estacionarios
        • Sistemas modulares
      • Perspectivas para España (miles de millones de USD, 2019-2032)
      • Mercado español de concentradores de COV por aplicación Tipo
        • Industrial
        • Comercial
        • Residencial
        • Automoción
      • Mercado español de concentradores de COV por tipo de tecnología
        • Oxidación térmica
        • Adsorción
        • Tratamiento biológico
        • Separación por membranas
      • Mercado español de concentradores de COV por tipo de industria de uso final
        • Fabricación química
        • Productos farmacéuticos
        • Alimentos y bebidas
        • Impresión y recubrimiento
      • Mercado español de concentradores de COV por tipo de sistema
        • Sistemas portátiles
        • Sistemas estacionarios
        • Modular Sistemas
      • Perspectivas para el RESTO DE EUROPA (miles de millones de USD, 2019-2032)
      • Mercado de concentradores de COV en el RESTO DE EUROPA por tipo de aplicación
        • Industrial
        • Comercial
        • Residencial
        • Automotriz
      • Mercado de concentradores de COV en el RESTO DE EUROPA por tipo de tecnología
        • Oxidación térmica
        • Adsorción
        • Tratamiento biológico
        • Separación por membranas
      • Mercado de concentradores de COV en el RESTO DE EUROPA por tipo de industria de uso final
        • Fabricación química
        • Productos farmacéuticos
        • Alimentos y bebidas
        • Impresión y Recubrimiento
      • Resto de Europa: Mercado de concentradores de COV por tipo de sistema
        • Sistemas portátiles
        • Sistemas estacionarios
        • Sistemas modulares
      • Perspectivas de Asia Pacífico (miles de millones de USD, 2019-2032)
        • Mercado de concentradores de COV en Asia Pacífico por tipo de aplicación
          • Industrial
          • Comercial
          • Residencial
          • Automotriz
        • Mercado de concentradores de COV en Asia Pacífico por tipo de tecnología
          • Oxidación térmica
          • Adsorción
          • Tratamiento biológico
          • Separación por membranas
        • Mercado de concentradores de COV en Asia Pacífico por fin Tipo de industria:
          • Fabricación de productos químicos
          • Productos farmacéuticos
          • Alimentos y bebidas
          • Impresión y recubrimiento
        • Mercado de concentradores de COV de Asia-Pacífico por tipo de sistema:
          • Sistemas portátiles
          • Sistemas estacionarios
          • Sistemas modulares
        • Mercado de concentradores de COV de Asia-Pacífico por tipo regional:
          • China
          • India
          • Japón
          • Corea del Sur
          • Malasia
          • Tailandia
          • Indonesia
          • Resto de Asia-Pacífico
        • Perspectivas para China (miles de millones de USD) 2019-2032)
        • Mercado de concentradores de COV en China por tipo de aplicación
          • Industrial
          • Comercial
          • Residencial
          • Automotriz
        • Mercado de concentradores de COV en China por tipo de tecnología
          • Oxidación térmica
          • Adsorción
          • Tratamiento biológico
          • Separación por membranas
        • Mercado de concentradores de COV en China por tipo de industria de uso final
          • Fabricación química
          • Productos farmacéuticos
          • Alimentos y bebidas
          • Impresión y recubrimiento
        • Mercado de concentradores de COV en China por tipo de sistema
          • Portátil Sistemas
          • Sistemas estacionarios
          • Sistemas modulares
        • Perspectivas de la INDIA (miles de millones de USD, 2019-2032)
        • Mercado de concentradores de COV en la INDIA por tipo de aplicación
          • Industrial
          • Comercial
          • Residencial
          • Automotriz
        • Mercado de concentradores de COV en la INDIA por tipo de tecnología
          • Oxidación térmica
          • Adsorción
          • Tratamiento biológico
          • Separación por membranas
        • Mercado de concentradores de COV en la INDIA por tipo de industria de uso final
          • Fabricación de productos químicos
          • Productos farmacéuticos
          • Alimentos y Bebidas
          • Impresión y recubrimiento
        • Mercado de concentradores de COV en INDIA por tipo de sistema
          • Sistemas portátiles
          • Sistemas estacionarios
          • Sistemas modulares
        • Perspectivas en Japón (miles de millones de USD, 2019-2032)
        • Mercado de concentradores de COV en Japón por tipo de aplicación
          • Industrial
          • Comercial
          • Residencial
          • Automotriz
        • Mercado de concentradores de COV en Japón por tipo de tecnología
          • Oxidación térmica
          • Adsorción
          • Tratamiento biológico
          • Membrana Separación
        • Mercado de concentradores de COV en Japón por tipo de industria de uso final
          • Fabricación de productos químicos
          • Productos farmacéuticos
          • Alimentos y bebidas
          • Impresión y recubrimiento
        • Mercado de concentradores de COV en Japón por tipo de sistema
          • Sistemas portátiles
          • Sistemas estacionarios
          • Sistemas modulares
        • Perspectivas para Corea del Sur (miles de millones de USD, 2019-2032)
        • Mercado de concentradores de COV en Corea del Sur por aplicación Tipo
          • Industrial
          • Comercial
          • Residencial
          • Automotriz
        • Mercado de concentradores de COV en Corea del Sur por tipo de tecnología
          • Oxidación térmica
          • Adsorción
          • Tratamiento biológico
          • Separación por membranas
        • Mercado de concentradores de COV en Corea del Sur por tipo de industria de uso final
          • Fabricación de productos químicos
          • Productos farmacéuticos
          • Alimentos y bebidas
          • Impresión y recubrimiento
        • Mercado de concentradores de COV en Corea del Sur por tipo de sistema
          • Sistemas portátiles
          • Estacionarios Sistemas
          • Sistemas modulares
        • Perspectivas de MALASIA (miles de millones de USD, 2019-2032)
        • Mercado de concentradores de COV de MALASIA por tipo de aplicación
          • Industrial
          • Comercial
          • Residencial
          • Automotriz
        • Mercado de concentradores de COV de MALASIA por tipo de tecnología
          • Oxidación térmica
          • Adsorción
          • Tratamiento biológico
          • Separación por membranas
        • Mercado de concentradores de COV de MALASIA por tipo de industria de uso final
          • Fabricación de productos químicos
          • Productos farmacéuticos
          • Alimentos y Bebidas
          • Impresión y recubrimiento
        • Mercado de concentradores de COV en MALASIA por tipo de sistema
          • Sistemas portátiles
          • Sistemas estacionarios
          • Sistemas modulares
        • Perspectivas de Tailandia (miles de millones de USD, 2019-2032)
        • Mercado de concentradores de COV en Tailandia por tipo de aplicación
          • Industrial
          • Comercial
          • Residencial
          • Automotriz
        • Mercado de concentradores de COV en Tailandia por tipo de tecnología
          • Oxidación térmica
          • Adsorción
          • Tratamiento biológico
          • Membrana Separación
        • Mercado de concentradores de COV en Tailandia por tipo de industria de uso final
          • Fabricación de productos químicos
          • Productos farmacéuticos
          • Alimentos y bebidas
          • Impresión y recubrimiento
        • Mercado de concentradores de COV en Tailandia por tipo de sistema
          • Sistemas portátiles
          • Sistemas estacionarios
          • Sistemas modulares
        • Perspectivas de Indonesia (miles de millones de USD, 2019-2032)
        • Mercado de concentradores de COV en Indonesia por aplicación Tipo
          • Industrial
          • Comercial
          • Residencial
          • Automotriz
        • Mercado de concentradores de COV en Indonesia por tipo de tecnología
          • Oxidación térmica
          • Adsorción
          • Tratamiento biológico
          • Separación por membranas
        • Mercado de concentradores de COV en Indonesia por tipo de industria de uso final
          • Fabricación de productos químicos
          • Productos farmacéuticos
          • Alimentos y bebidas
          • Impresión y recubrimiento
        • Mercado de concentradores de COV en Indonesia por tipo de sistema
          • Sistemas portátiles
          • Sistemas estacionarios
          • Modular Sistemas
        • Perspectivas para el RESTO DE APAC (miles de millones de USD, 2019-2032)
        • Mercado de concentradores de COV en el RESTO DE APAC por tipo de aplicación
          • Industrial
          • Comercial
          • Residencial
          • Automotriz
        • Mercado de concentradores de COV en el RESTO DE APAC por tipo de tecnología
          • Oxidación térmica
          • Adsorción
          • Tratamiento biológico
          • Separación por membranas
        • Mercado de concentradores de COV en el RESTO DE APAC por tipo de industria de uso final
          • Fabricación de productos químicos
          • Productos farmacéuticos
          • Alimentos y bebidas
          • Impresión y Recubrimiento
        • RESTO DEL MERCADO DE CONCENTRADORES DE COV DE APAC POR TIPO DE SISTEMA
          • Sistemas Portátiles
          • Sistemas Fijos
          • Sistemas Modulares
        • Panorama de Sudamérica (Miles de millones de USD, 2019-2032)
          • Mercado de Concentradores de COV de Sudamérica por Tipo de Aplicación
            • Industrial
            • Comercial
            • Residencial
            • Automotriz
          • Mercado de Concentradores de COV de Sudamérica por Tipo de Tecnología
            • Oxidación Térmica
            • Adsorción
            • Tratamiento Biológico
            • Separación por Membranas
          • Mercado de Concentradores de COV de Sudamérica por Final Tipo de industria:
            • Fabricación de productos químicos
            • Productos farmacéuticos
            • Alimentos y bebidas
            • Impresión y recubrimiento
          • Mercado de concentradores de COV en Sudamérica por tipo de sistema:
            • Sistemas portátiles
            • Sistemas estacionarios
            • Sistemas modulares
          • Mercado de concentradores de COV en Sudamérica por tipo regional:
            • Brasil
            • México
            • Argentina
            • Resto de Sudamérica
          • Perspectivas de BRASIL (miles de millones de USD, 2019-2032):
          • Mercado de concentradores de COV en Brasil por aplicación: Tipo
            • Industrial
            • Comercial
            • Residencial
            • Automotriz
          • Mercado de concentradores de COV en Brasil por tipo de tecnología
            • Oxidación térmica
            • Adsorción
            • Tratamiento biológico
            • Separación por membranas
          • Mercado de concentradores de COV en Brasil por tipo de industria de uso final
            • Fabricación de productos químicos
            • Productos farmacéuticos
            • Alimentos y bebidas
            • Impresión y recubrimiento
          • Mercado de concentradores de COV en Brasil por tipo de sistema
            • Sistemas portátiles
            • Sistemas estacionarios
            • Modular Sistemas
          • Perspectivas de MÉXICO (Miles de millones de USD, 2019-2032)
          • Mercado de concentradores de COV en MÉXICO por tipo de aplicación
            • Industrial
            • Comercial
            • Residencial
            • Automotriz
          • Mercado de concentradores de COV en MÉXICO por tipo de tecnología
            • Oxidación térmica
            • Adsorción
            • Tratamiento biológico
            • Separación por membranas
          • Mercado de concentradores de COV en MÉXICO por tipo de industria de uso final
            • Fabricación de productos químicos
            • Farmacéutica
            • Alimentos y bebidas
            • Impresión y Recubrimiento
          • Mercado de concentradores de COV en MÉXICO por tipo de sistema
            • Sistemas portátiles
            • Sistemas estacionarios
            • Sistemas modulares
          • Perspectivas de ARGENTINA (miles de millones de USD, 2019-2032)
          • Mercado de concentradores de COV en ARGENTINA por tipo de aplicación
            • Industrial
            • Comercial
            • Residencial
            • Automotriz
          • Mercado de concentradores de COV en ARGENTINA por tipo de tecnología
            • Oxidación térmica
            • Adsorción
            • Tratamiento biológico
            • Separación por membranas
          • COV en ARGENTINA Mercado de concentradores por tipo de industria de uso final
            • Fabricación de productos químicos
            • Productos farmacéuticos
            • Alimentos y bebidas
            • Impresión y recubrimiento
          • Mercado de concentradores de COV en Argentina por tipo de sistema
            • Sistemas portátiles
            • Sistemas estacionarios
            • Sistemas modulares
          • Perspectivas para el resto de Sudamérica (miles de millones de USD, 2019-2032)
          • Mercado de concentradores de COV para el resto de Sudamérica por tipo de aplicación
            • Industrial
            • Comercial
            • Residencial
            • Automotriz
          • Mercado de concentradores de COV para el resto de Sudamérica Por tipo de tecnología
            • Oxidación térmica
            • Adsorción
            • Tratamiento biológico
            • Separación por membranas
          • RESTO DE SUDAMÉRICA: Mercado de concentradores de COV por tipo de industria de uso final
            • Fabricación de productos químicos
            • Productos farmacéuticos
            • Alimentos y bebidas
            • Impresión y recubrimiento
          • RESTO DE SUDAMÉRICA: Mercado de concentradores de COV por tipo de sistema
            • Sistemas portátiles
            • Sistemas estacionarios
            • Sistemas modulares
          • Perspectivas para Oriente Medio y África (miles de millones de USD, 2019-2032)
            • Mercado de concentradores de COV de Oriente Medio y África por aplicación Tipo
              • Industrial
              • Comercial
              • Residencial
              • Automoción
            • Mercado de concentradores MEA VOC por tipo de tecnología
              • Oxidación térmica
              • Adsorción
              • Tratamiento biológico
              • Separación de membranas
            • Mercado de concentradores de MEA VOC por tipo de industria de uso final
              • Fabricación de productos químicos
              • Productos farmacéuticos
              • Alimentos y bebidas
              • Impresión y recubrimiento
            • Mercado de concentradores de COV MEA por tipo de sistema
              • Sistemas portátiles
              • Sistemas estacionarios
              • Modulares Sistemas
            • Mercado de concentradores de COV en Oriente Medio y África (MEA) por tipo de región
              • Países del CCG
              • Sudáfrica
              • Resto de Oriente Medio y África (MEA)
            • Perspectivas de los países del CCG (miles de millones de USD, 2019-2032)
            • Mercado de concentradores de COV en los países del CCG por tipo de aplicación
              • Industrial
              • Comercial
              • Residencial
              • Automotriz
            • Mercado de concentradores de COV en los países del CCG por tipo de tecnología
              • Oxidación térmica
              • Adsorción
              • Tratamiento biológico
              • Separación por membranas
            • CCG Mercado de concentradores de COV por país, según tipo de industria de uso final
              • Fabricación de productos químicos
              • Farmacéutica
              • Alimentos y bebidas
              • Impresión y recubrimiento
            • Mercado de concentradores de COV en los países del CCG por tipo de sistema
              • Sistemas portátiles
              • Sistemas estacionarios
              • Sistemas modulares
            • Perspectivas de Sudáfrica (miles de millones de USD, 2019-2032)
            • Mercado de concentradores de COV en Sudáfrica por tipo de aplicación
              • Industrial
              • Comercial
              • Residencial
              • Automotriz
            • Mercado de concentradores de COV en Sudáfrica por tipo de tecnología
              • Térmica Oxidación
              • Adsorción
              • Tratamiento biológico
              • Separación por membranas
            • Mercado de concentradores de COV en Sudáfrica por tipo de industria de uso final
              • Fabricación de productos químicos
              • Productos farmacéuticos
              • Alimentos y bebidas
              • Impresión y recubrimiento
            • Mercado de concentradores de COV en Sudáfrica por tipo de sistema
              • Sistemas portátiles
              • Sistemas estacionarios
              • Sistemas modulares
            • Perspectivas para el resto de Oriente Medio y África (miles de millones de USD, 2019-2032)
            • Mercado de concentradores de COV en el resto de Oriente Medio y África por aplicación Tipo
              • Industrial
              • Comercial
              • Residencial
              • Automotriz
            • REST OF MEA Mercado de Concentradores de COV por Tipo de Tecnología
              • Oxidación Térmica
              • Adsorción
              • Tratamiento Biológico
              • Separación por Membranas
            • REST OF MEA Mercado de Concentradores de COV por Tipo de Industria de Uso Final
              • Fabricación de Productos Químicos
              • Productos Farmacéuticos
              • Alimentos y Bebidas
              • Impresión y Recubrimiento
            • REST OF MEA Mercado de Concentradores de COV por Tipo de Sistema
              • Sistemas Portátiles
              • Estacionarios Sistemas
              • Sistemas modulares

Compare Licence

×
Features License Type
Single User Multiuser License Enterprise User
Price $4,950 $5,950 $7,250
Maximum User Access Limit 1 User Upto 10 Users Unrestricted Access Throughout the Organization
Free Customization
Direct Access to Analyst
Deliverable Format
Platform Access
Discount on Next Purchase 10% 15% 15%
Printable Versions