Request Free Sample ×

Kindly complete the form below to receive a free sample of this Report

* Please use a valid business email

Leading companies partner with us for data-driven Insights

clients tt-cursor
Hero Background

US Home Security Systems Market

ID: MRFR/SEM/11536-HCR
200 Pages
Ankit Gupta
Last Updated: April 06, 2026

Informe de investigación de mercado de sistemas de seguridad para el hogar: pronóstico hasta 2032

Compartir
Download PDF ×

We do not share your information with anyone. However, we may send you emails based on your report interest from time to time. You may contact us at any time to opt-out.

  1. 1 INTRODUCCIÓN AL MERCADO
    1. 1.1 INTRODUCCIÓN
    2. 1.2 ALCANCE DEL ESTUDIO
      1. 1.2.1 OBJETIVO DE LA INVESTIGACIÓN
      2. 1.2.2 SUPUESTOS
      3. 1.2.3 LIMITACIONES
    3. 1.3 ESTRUCTURA DEL MERCADO
  2. 2 METODOLOGÍA DE LA INVESTIGACIÓN
    1. 2.1 INVESTIGACIÓN DEL MERCADO DE SISTEMAS DE SEGURIDAD
    2. 2.2 INVESTIGACIÓN PRIMARIA
    3. 2.3 INVESTIGACIÓN SECUNDARIA INVESTIGACIÓN
    4. 2.4 MODELO DE PRONÓSTICO
      1. 2.4.1 RECOPILACIÓN, ANÁLISIS Y PRONÓSTICO DE DATOS DEL MERCADO
      2. 2.4.2 ESTIMACIÓN DEL TAMAÑO DEL MERCADO
  3. 3 DINÁMICA DEL MERCADO
    1. 3.1 INTRODUCCIÓN
    2. 3.2 IMPULSORES DEL MERCADO
    3. 3.3 DESAFÍOS DEL MERCADO
    4. 3.4 OPORTUNIDADES DEL MERCADO
    5. 3.5 RESTRICCIONES DEL MERCADO
  4. 4 RESUMEN EJECUTIVO
  5. 5 ANÁLISIS DE FACTORES DE MERCADO
    1. 5.1 ANÁLISIS DE LAS CINCO FUERZAS DE PORTER
    2. 5.2 ANÁLISIS DE LA CADENA DE SUMINISTRO
  6. 6 MERCADO DE SISTEMAS DE SEGURIDAD, POR SEGMENTOS
    1. 6.1 INTRODUCCIÓN
    2. 6.2 ESTADÍSTICAS DEL MERCADO
      1. 6.2.1 POR PRODUCTO
        1. 6.2.1.1 HARDWARE
        2. 6.2.1.2 SOLUCIONES DE SOFTWARE
      2. 6.2.2 POR IMPLEMENTACIÓN
        1. 6.2.2.1 SEGURIDAD COMERCIAL
        2. 6.2.2.2 SEGURIDAD INDUSTRIAL
      3. 6.2.3 POR USUARIO FINAL
        1. 6.2.3.1 TRANSPORTE
        2. 6.2.3.2 COMERCIAL
        3. 6.2.3.3 INDUSTRIAL
        4. 6.2.3.4 VENTA MINORISTA
        5. 6.2.3.5 BANCA Y FINANZAS
        6. 6.2.3.6 AEROESPACIAL Y DEFENSA
      4. 6.2.4 POR REGIÓN
        1. 6.2.4.1 AMÉRICA DEL NORTE
          1. 6.2.4.1.1 EE. UU.
          2. 6.2.4.1.1 CANADÁ
        2. 6.2.4.2 EUROPA
          1. 6.2.4.2.1 REINO UNIDO
          2. 6.2.4.2.2 ALEMANIA
          3. 6.2.4.2.3 FRANCIA
          4. 6.2.4.2.4 SUECIA
        3. 6.2.4.3 APAC
          1. 6.2.4.3.1 CHINA
          2. 6.2.4.3.2 JAPÓN
          3. 6.3.4.3.3 INDIA
        4. 6.2.4.4 RESTO DEL MUNDIAL
  7. 7 ANÁLISIS COMPETITIVO
    1. 7.1 ANÁLISIS DE CUOTA DE MERCADO
    2. 7.2 PERFILES DE LAS EMPRESAS
      1. 7.2.1 CISCO SYSTEMS, INC (EE. UU.)
      2. 7.2.2 ASSA ABLOY (SUECIA)
      3. 7.2.3 FLIR SYSTEMS (EE. UU.)
      4. 7.2.4 BOSCH SECURITY SYSTEMS (ALEMANIA)
      5. 7.2.5 ADT CORPORATION (EE. UU.)
      6. 7.2.6 BROCADE COMMUNICATION SYSTEM, INC (EE. UU.)
      7. 7.2.7 HONEYWELL INTERNATIONAL, INC (EE. UU.)
      8. 7.2.8 SYMANTEC CORPORATION (EE. UU.)
      9. 7.2.9 FORTINET (EE. UU.)
      10. 7.2.10 OTROS
    3. LISTA DE TABLAS
    4. TABLA 1 MERCADO DE SISTEMAS DE SEGURIDAD, POR PRODUCTO
    5. TABLA 2 MERCADO DE SISTEMAS DE SEGURIDAD, POR IMPLEMENTACIÓN
    6. TABLA 3 MERCADO DE SISTEMAS DE SEGURIDAD, POR USUARIO FINAL
    7. TABLA 4 MERCADO DE SISTEMAS DE SEGURIDAD, POR REGIÓN
    8. TABLA 5 MERCADO DE SISTEMAS DE SEGURIDAD DE AMÉRICA DEL NORTE, POR PRODUCTO
    9. TABLA 6 MERCADO DE SISTEMAS DE SEGURIDAD DE AMÉRICA DEL NORTE, POR IMPLEMENTACIÓN
    10. TABLA 7 MERCADO DE SISTEMAS DE SEGURIDAD DE AMÉRICA DEL NORTE, POR USUARIO FINAL
    11. TABLA 8 MERCADO DE SISTEMAS DE SEGURIDAD DE EE. UU., POR PRODUCTO
    12. TABLA 9 MERCADO DE SISTEMAS DE SEGURIDAD DE EE. UU., POR IMPLEMENTACIÓN
    13. TABLA 10 MERCADO DE SISTEMAS DE SEGURIDAD DE EE. UU., POR USUARIO FINAL
    14. TABLA 11 MERCADO DE SISTEMAS DE SEGURIDAD DE CANADÁ, POR PRODUCTO
    15. TABLA 12 MERCADO DE SISTEMAS DE SEGURIDAD DE CANADÁ, POR IMPLEMENTACIÓN
    16. TABLA 13 MERCADO DE SISTEMAS DE SEGURIDAD DE CANADÁ, POR USUARIO FINAL
    17. TABLA 14 MERCADO DE SISTEMAS DE SEGURIDAD DE EUROPA, POR PRODUCTO
    18. TABLA 15 MERCADO DE SISTEMAS DE SEGURIDAD DE EUROPA, POR IMPLEMENTACIÓN
    19. TABLA 16 MERCADO DE SISTEMAS DE SEGURIDAD DE EUROPA, POR USUARIO FINAL
    20. TABLA 17 MERCADO DE SISTEMAS DE SEGURIDAD DE ALEMANIA, POR PRODUCTO
    21. TABLA 18 MERCADO DE SISTEMAS DE SEGURIDAD DE ALEMANIA, POR IMPLEMENTACIÓN
    22. TABLA 19 MERCADO DE SISTEMAS DE SEGURIDAD DE FRANCIA, POR PRODUCTO
    23. TABLA 20 MERCADO DE SISTEMAS DE SEGURIDAD DE FRANCIA, POR IMPLEMENTACIÓN
    24. TABLA 21 MERCADO DE SISTEMAS DE SEGURIDAD DEL REINO UNIDO, POR PRODUCTO
    25. TABLA 22 MERCADO DE SISTEMAS DE SEGURIDAD DEL REINO UNIDO, POR IMPLEMENTACIÓN
    26. TABLA 23 MERCADO DE SISTEMAS DE SEGURIDAD DEL RESTO DE EUROPA, POR PRODUCTO
    27. TABLA 24 MERCADO DE SISTEMAS DE SEGURIDAD DEL RESTO DE EUROPA, POR IMPLEMENTACIÓN
    28. TABLA 25 MERCADO DE SISTEMAS DE SEGURIDAD DE ASIA-PACÍFICO, POR PRODUCTO
    29. TABLA 26 MERCADO DE SISTEMAS DE SEGURIDAD DE ASIA-PACÍFICO, POR IMPLEMENTACIÓN
    30. TABLA 27 MERCADO DE SISTEMAS DE SEGURIDAD DE ASIA-PACÍFICO, POR USUARIO FINAL
    31. TABLA 28 MERCADO DE SISTEMAS DE SEGURIDAD DE CHINA, POR PRODUCTO
    32. TABLA 29 MERCADO DE SISTEMAS DE SEGURIDAD DE CHINA, POR IMPLEMENTACIÓN
    33. TABLA 30 MERCADO DE SISTEMAS DE SEGURIDAD DE CHINA, POR USUARIO FINAL
    34. TABLA 31 MERCADO DE SISTEMAS DE SEGURIDAD DE JAPÓN, POR PRODUCTO
    35. TABLA 32 MERCADO DE SISTEMAS DE SEGURIDAD DE JAPÓN, POR IMPLEMENTACIÓN
    36. TABLA 33 MERCADO DE SISTEMAS DE SEGURIDAD DE JAPÓN, POR USUARIO FINAL
    37. TABLA 34 MERCADO DE SISTEMAS DE SEGURIDAD DE INDIA, POR PRODUCTO
    38. TABLA 35 MERCADO DE SISTEMAS DE SEGURIDAD DE INDIA, POR IMPLEMENTACIÓN
    39. TABLA 36 MERCADO DE SISTEMAS DE SEGURIDAD DE INDIA, POR USUARIO FINAL
    40. TABLA 37 MERCADO DE SISTEMAS DE SEGURIDAD DEL RESTO DEL MUNDO, POR PRODUCTO
    41. TABLA 38 RESTO DEL MERCADO MUNDIAL DE SISTEMAS DE SEGURIDAD, POR IMPLEMENTACIÓN
    42. TABLA 39 RESTO DEL MERCADO MUNDIAL DE SISTEMAS DE SEGURIDAD, POR USUARIO FINAL
    43. LISTA DE FIGURAS
    44. FIGURA 1 METODOLOGÍA DE LA INVESTIGACIÓN
    45. FIGURA 2 MERCADO DE SISTEMAS DE SEGURIDAD, POR PRODUCTO (%)
    46. FIGURA 3 MERCADO DE SISTEMAS DE SEGURIDAD, POR IMPLEMENTACIÓN (%)
    47. FIGURA 5 MERCADO DE SISTEMAS DE SEGURIDAD, POR USUARIO FINAL (%)
    48. FIGURA 6 MERCADO DE SISTEMAS DE SEGURIDAD, POR REGIÓN (%)
    49. FIGURA 7 MERCADO DE SISTEMAS DE SEGURIDAD DE AMÉRICA DEL NORTE, POR PRODUCTO (%)
    50. FIGURA 8 MERCADO DE SISTEMAS DE SEGURIDAD DE AMÉRICA DEL NORTE, POR IMPLEMENTACIÓN (%)
    51. FIGURA 8 MERCADO DE SISTEMAS DE SEGURIDAD DE AMÉRICA DEL NORTE, POR USUARIO FINAL (%)
    52. FIGURA 8 MERCADO DE SISTEMAS DE SEGURIDAD DE EE. UU., POR PRODUCTO
    53. FIGURA 9 MERCADO DE SISTEMAS DE SEGURIDAD DE EE. UU., POR IMPLEMENTACIÓN
    54. FIGURA 10 MERCADO DE SISTEMAS DE SEGURIDAD DE EE. UU., POR USUARIO FINAL
    55. FIGURA 11 MERCADO DE SISTEMAS DE SEGURIDAD DE CANADÁ, POR PRODUCTO
    56. FIGURA 12 MERCADO DE SISTEMAS DE SEGURIDAD DE CANADÁ, POR IMPLEMENTACIÓN
    57. FIGURA 13 CANADÁ MERCADO DE SISTEMAS DE SEGURIDAD, POR USUARIO FINAL
    58. FIGURA 14 MERCADO DE SISTEMAS DE SEGURIDAD EN EUROPA POR PRODUCTO (%)
    59. FIGURA 15 MERCADO DE SISTEMAS DE SEGURIDAD EN EUROPA, POR SOLUCIONES (%)
    60. FIGURA 16 MERCADO DE SISTEMAS DE SEGURIDAD EN EUROPA, POR INDUSTRIAS (%)
    61. FIGURA 17 MERCADO DE SISTEMAS DE SEGURIDAD EN ALEMANIA, POR PRODUCTO
    62. FIGURA 18 MERCADO DE SISTEMAS DE SEGURIDAD EN ALEMANIA, POR IMPLEMENTACIÓN
    63. FIGURA 19 MERCADO DE SISTEMAS DE SEGURIDAD EN FRANCIA, POR PRODUCTO
    64. FIGURA 20 MERCADO DE SISTEMAS DE SEGURIDAD EN FRANCIA, POR IMPLEMENTACIÓN
    65. FIGURA 21 MERCADO DE SISTEMAS DE SEGURIDAD DEL REINO UNIDO, POR PRODUCTO
    66. FIGURA 22 MERCADO DE SISTEMAS DE SEGURIDAD DEL REINO UNIDO, POR IMPLEMENTACIÓN
    67. FIGURA 23 RESTO DE EUROPA MERCADO DE SISTEMAS DE SEGURIDAD, POR PRODUCTO
    68. FIGURA 24 RESTO DE EUROPA MERCADO DE SISTEMAS DE SEGURIDAD, POR IMPLEMENTACIÓN
    69. FIGURA 25 MERCADO DE SISTEMAS DE SEGURIDAD DE ASIA-PACÍFICO, POR PRODUCTO (%)
    70. FIGURA 26 MERCADO DE SISTEMAS DE SEGURIDAD DE ASIA-PACÍFICO, POR SOLUCIONES (%)
    71. FIGURA 27 RESTO DEL MUNDO MERCADO DE SISTEMAS DE SEGURIDAD, POR PRODUCTO (%)
    72. FIGURA 28 RESTO DEL MUNDO MERCADO DE SISTEMAS DE SEGURIDAD, POR SOLUCIONES (%)

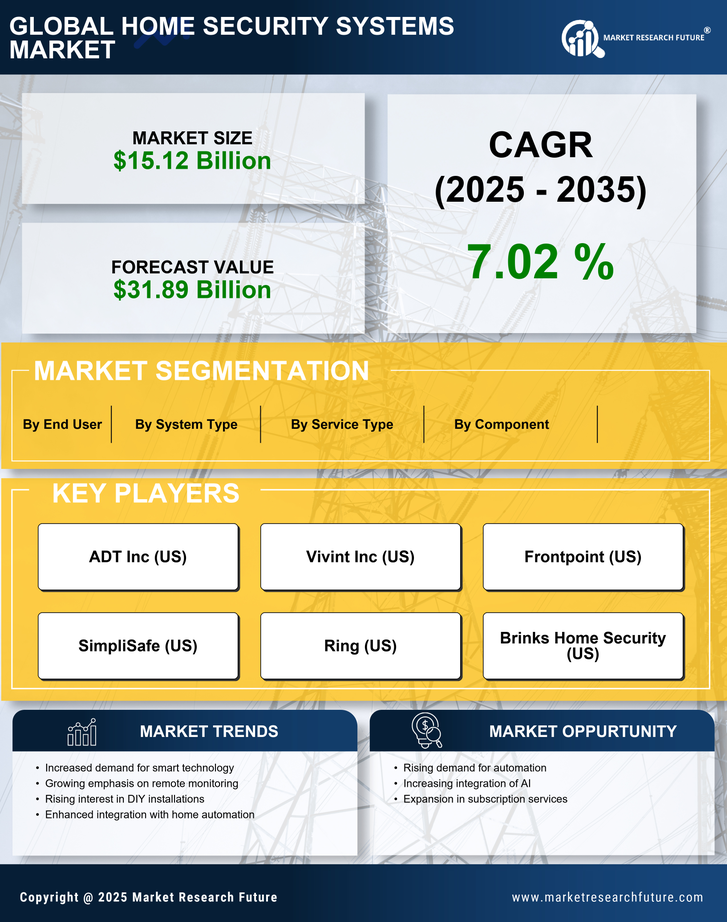
Segmentación del mercado de sistemas de seguridad para el hogar

Perspectiva del producto de sistemas de seguridad para el hogar

  • Cámaras

  • Sensores

  • Biometría

  • Tarjetas inteligentes

Sistemas de seguridad para el hogar tipo Outlook

  • Solución de videovigilancia

  • Sistema de Alerta Médica

Perspectiva regional de los sistemas de seguridad para el hogar (millones de dólares, 2018-2032)

  • Perspectivas de América del Norte (millones de dólares, 2018-2032)

    • Sistemas de seguridad para el hogar en América del Norte por producto

      • Cámaras

      • Sensores

      • Biometría

      • Tarjetas inteligentes

    • Sistemas de seguridad para el hogar en América del Norte por tipo

      • Solución de videovigilancia

      • Sistema de Alerta Médica

    • Perspectivas de EE. UU. (millones de dólares, 2018-2032)

    • Sistemas de seguridad para el hogar de EE. UU. por producto

      • Cámaras

      • Sensores

      • Biometría

      • Tarjetas inteligentes

    • Tipo de sistemas de seguridad para el hogar de EE. UU.

      • Solución de videovigilancia

      • Sistema de Alerta Médica

    • Perspectivas de CANADÁ (millones de dólares, 2018-2032)

    • CANADÁ Sistemas de seguridad para el hogar por producto

      • Cámaras

      • Sensores

      • Biometría

      • Tarjetas inteligentes

    • CANADÁ Sistemas de seguridad para el hogar por tipo

      • Solución de videovigilancia

      • Sistema de Alerta Médica

  • Perspectivas de Europa (millones de dólares, 2018-2032)

    • Sistemas de seguridad para el hogar en Europa por producto

      • Cámaras

      • Sensores

      • Biometría

      • Tarjetas inteligentes

    • Tipo de sistemas de seguridad para el hogar en Europa

      • Solución de videovigilancia

      • Sistema de Alerta Médica

    • Perspectivas de Alemania (millones de dólares, 2018-2032)

    • Sistemas de seguridad para el hogar en Alemania por producto

      • Cámaras

      • Sensores

      • Biometría

      • Tarjetas inteligentes

    • Tipo de sistemas de seguridad para el hogar en Alemania

      • Solución de videovigilancia

      • Sistema de Alerta Médica

    • Perspectivas de Francia (millones de dólares, 2018-2032)

    • Sistemas de seguridad para el hogar en Francia por producto

      • Cámaras

      • Sensores

      • Biometría

      • Tarjetas inteligentes

    • Tipo de sistemas de seguridad para el hogar en Francia

      • Solución de videovigilancia

      • Sistema de Alerta Médica

    • Perspectivas del Reino Unido (millones de dólares, 2018-2032)

    • Sistemas de seguridad para el hogar del Reino Unido por producto

      • Cámaras

      • Sensores

      • Biometría

      • Tarjetas inteligentes

      • Estructurado

    • Tipo de sistemas de seguridad para el hogar del Reino Unido

      • Solución de videovigilancia

      • Sistema de Alerta Médica

    • Perspectivas de ITALIA (millones de dólares, 2018-2032)

    • ITALIA Sistemas de seguridad para el hogar por producto

      • Cámaras

      • Sensores

      • Biometría

      • Tarjetas inteligentes

    • ITALIA Tipo de sistemas de seguridad para el hogar

      • Solución de videovigilancia

      • Sistema de Alerta Médica

    • Perspectivas de ESPAÑA (millones de dólares, 2018-2032)

    • Sistemas de Seguridad para el Hogar en España por Producto

      • Cámaras

      • Sensores

      • Biometría

      • Tarjetas inteligentes

    • Tipo de sistemas de seguridad para el hogar en España

      • Solución de videovigilancia

      • Sistema de Alerta Médica

    • Perspectivas del resto de Europa (millones de dólares, 2018-2032)

    • Sistemas de seguridad para el hogar en el resto de Europa por producto

      • Cámaras

      • Sensores

      • Biometría

      • Tarjetas inteligentes

    • RESTO DE EUROPA Tipo de sistemas de seguridad para el hogar

      • Solución de videovigilancia

      • Sistema de Alerta Médica

  • Perspectivas de Asia y el Pacífico (millones de dólares, 2018-2032)

    • Sistemas de seguridad para el hogar de Asia y el Pacífico por producto

      • Cámaras

      • Sensores

      • Biometría

      • Tarjetas inteligentes

    • Tipo de sistemas de seguridad para el hogar de Asia y el Pacífico

      • Solución de videovigilancia

      • Sistema de Alerta Médica

    • Perspectivas de China (millones de dólares, 2018-2032)

    • Sistemas de seguridad para el hogar de China por producto

      • Cámaras

      • Sensores

      • Biometría

      • Tarjetas inteligentes

    • Tipo de sistemas de seguridad para el hogar de China

      • Solución de videovigilancia

      • Sistema de Alerta Médica

    • Perspectivas de Japón (millones de dólares, 2018-2032)

    • Sistemas de seguridad para el hogar de Japón por producto

      • Cámaras

      • Sensores

      • Biometría

      • Tarjetas inteligentes

    • Tipo de sistemas de seguridad para el hogar de Japón

      • Solución de videovigilancia

      • Sistema de Alerta Médica

    • Perspectivas de la India (millones de dólares, 2018-2032)

    • Sistemas de seguridad para el hogar de la India por producto

      • Cámaras

      • Sensores

      • Biometría

      • Tarjetas inteligentes

    • Tipo de sistemas de seguridad para el hogar en India

      • Solución de videovigilancia

      • Sistema de Alerta Médica

    • Perspectivas de Australia (millones de dólares, 2018-2032)

    • Sistemas de seguridad para el hogar de Australia por producto

      • Cámaras

      • Sensores

      • Biometría

      • Tarjetas inteligentes

    • Tipo de sistemas de seguridad para el hogar en Australia

      • Solución de videovigilancia

      • Sistema de Alerta Médica

    • Perspectivas del resto de Asia y el Pacífico (millones de dólares, 2018-2032)

    • Resto de sistemas de seguridad para el hogar de Asia-Pacífico por producto

      • Cámaras

      • Sensores

      • Biometría

      • Tarjetas inteligentes

    • Tipo de sistemas de seguridad para el hogar del resto de Asia y el Pacífico

      • Solución de videovigilancia

      • Sistema de Alerta Médica

  • Perspectivas del resto del mundo (millones de dólares, 2018-2032)

    • Sistemas de seguridad para el hogar en el resto del mundo por producto

      • Cámaras

      • Sensores

      • Biometría

      • Tarjetas inteligentes

    • Tipo de sistemas de seguridad para el hogar del resto del mundo

      • Solución de videovigilancia

      • Sistema de Alerta Médica

    • Perspectivas de Oriente Medio (millones de dólares, 2018-2032)

    • Sistemas de seguridad para el hogar en Oriente Medio por producto

      • Cámaras

      • Sensores

      • Biometría

      • Tarjetas inteligentes

    • Tipo de sistemas de seguridad para el hogar en Oriente Medio

      • Solución de videovigilancia

      • Sistema de Alerta Médica

    • Perspectivas de África (millones de dólares, 2018-2032)

    • Sistemas de seguridad para el hogar en África por producto

      • Cámaras

      • Sensores

      • Biometría

      • Tarjetas inteligentes

    • Tipo de sistemas de seguridad para el hogar en África

      • Solución de videovigilancia

      • Sistema de Alerta Médica

    • Perspectivas de América Latina (millones de dólares, 2018-2032)

    • Sistemas de seguridad para el hogar en América Latina por producto

      • Cámaras

      • Sensores

      • Biometría

      • Tarjetas inteligentes

    • Tipo de sistemas de seguridad para el hogar en América Latina

      • Solución de videovigilancia

      • Sistema de Alerta Médica

Compare Licence

×
Features License Type
Single User Multiuser License Enterprise User
Price $4,950 $5,950 $7,250
Maximum User Access Limit 1 User Upto 10 Users Unrestricted Access Throughout the Organization
Free Customization
Direct Access to Analyst
Deliverable Format
Platform Access
Discount on Next Purchase 10% 15% 15%
Printable Versions