Request Free Sample ×

Kindly complete the form below to receive a free sample of this Report

* Please use a valid business email

Leading companies partner with us for data-driven Insights

clients tt-cursor
Hero Background

Upstream Oil Gas Services Market

ID: MRFR/EnP/36983-HCR
100 Pages
Chitranshi Jaiswal
Last Updated: April 06, 2026

Informe de investigación de mercado de servicios upstream de petróleo y gas por tipo de servicio (servicios de exploración, servicios de producción, servicios de perforación, servicios de terminación de pozos, servicios de yacimientos), por aplicación (petróleo convencional, petróleo no convencional, gas natural), por modo de servicio (en tierra firme, costa afuera), por tipo de cliente (compañías petroleras nacionales, compañías petroleras independientes, compañías petroleras internacionales) y por región (América del Norte, Europa, América del Sur, Asia Pacífico, Medio Oriente y África): pronóstico para 2034

Compartir
Download PDF ×

We do not share your information with anyone. However, we may send you emails based on your report interest from time to time. You may contact us at any time to opt-out.

Upstream Oil Gas Services Market Infographic
Purchase Options
  1. 1 RESUMEN EJECUTIVO
    1. 1.1 Descripción general del mercado
    2. 1.2 Hallazgos clave
    3. 1.3 Segmentación del mercado
    4. 1.4 Panorama Competitivo
    5. 1.5 Retos y Oportunidades
    6. 1.6 Perspectivas futuras
  2. 2 INTRODUCCIÓN AL MERCADO
    1. 2.1 Definición
    2. 2.2 Alcance del estudio
      1. 2.2.1 Objetivo de la investigación
      2. 2.2.2 Supuesto
      3. 2.2.3 Limitaciones
  3. 3 METODOLOGÍA DE LA INVESTIGACIÓN
    1. 3.1 Descripción general
    2. 3.2 Minería de datos
    3. 3.3 Investigación Secundaria
    4. 3.4 Investigación Primaria
      1. 3.4.1 Entrevistas primarias y proceso de recopilación de información
      2. 3.4.2 Desglose de los encuestados principales
    5. 3.5 Modelo de previsión
    6. 3.6 Estimación del tamaño del mercado
      1. 3.6.1 Enfoque ascendente
      2. 3.6.2 Enfoque de arriba hacia abajo
    7. 3.7 Triangulación de datos
    8. 3.8 Validación
  4. 4 DINÁMICA DEL MERCADO
    1. 4.1 Descripción general
    2. 4.2 Conductores
    3. 4.3 Restricciones
    4. 4.4 Oportunidades
  5. 5 ANÁLISIS DE FACTORES DE MERCADO
    1. 5.1 Análisis de la cadena de valor
    2. 5.2 Análisis de las cinco fuerzas de Porter
      1. 5.2.1 Poder de negociación de los proveedores
      2. 5.2.2 Poder de negociación de los compradores
      3. 5.2.3 Amenaza de nuevos participantes
      4. 5.2.4 Amenaza de sustitutos
      5. 5.2.5 Intensidad de la rivalidad
    3. 5.3 Análisis de impacto de COVID-19
      1. 5.3.1 Análisis de Impacto en el Mercado
      2. 5.3.2 Impacto Regional
      3. 5.3.3 Análisis de oportunidades y amenazas
  6. 6 MERCADO DE SERVICIOS DE PETRÓLEO Y GAS UPSTREAM, POR TIPO DE SERVICIO (MILLONES DE USD)
    1. 6.1 Servicios de exploración
    2. 6.2 Servicios de producción
    3. 6.3 Servicios de perforación
    4. 6.4 Servicios de terminación de pozos
    5. 6.5 Servicios de embalses
  7. 7 MERCADO DE SERVICIOS DE PETRÓLEO Y GAS UPSTREAM, POR APLICACIÓN (MILLONES DE USD)
    1. 7.1 Petróleo convencional
    2. 7.2 Petróleo no convencional
    3. 7.3 Gas Natural
  8. 8 MERCADO DE SERVICIOS UPSTREAM DE PETRÓLEO Y GAS, POR MODALIDAD DE SERVICIO (MILLONES DE USD)
    1. 8.1 En tierra
    2. 8.2 Costa afuera
  9. 9 MERCADO DE SERVICIOS UPSTREAM DE PETRÓLEO Y GAS, POR TIPO DE CLIENTE (MILLONES DE USD)
    1. 9.1 Empresas Petroleras Nacionales
    2. 9.2 Compañías petroleras independientes
    3. 9.3 Compañías petroleras internacionales
  10. 10 MERCADO DE SERVICIOS DE PETRÓLEO Y GAS UPSTREAM, POR REGIONAL (MILLONES DE USD)
    1. 10.1 América del Norte
      1. 10.1.1 Estados Unidos
      2. 10.1.2 Canadá
    2. 10.2 Europa
      1. 10.2.1 Alemania
      2. 10.2.2 Reino Unido
      3. 10.2.3 Francia
      4. 10.2.4 Rusia
      5. 10.2.5 Italia
      6. 10.2.6 España
      7. 10.2.7 Resto de Europa
    3. 10.3 Asia Pacífico
      1. 10.3.1 China
      2. 10.3.2 India
      3. 10.3.3 Japón
      4. 10.3.4 Corea del Sur
      5. 10.3.5 Malasia
      6. 10.3.6 Tailandia
      7. 10.3.7 Indonesia
      8. 10.3.8 Resto de APAC
    4. 10.4 América del Sur
      1. 10.4.1 Brasil
      2. 10.4.2 México
      3. 10.4.3 Argentina
      4. 10.4.4 Resto de Sudamérica
    5. 10.5 AMUMA
      1. 10.5.1 Países del CCG
      2. 10.5.2 Sudáfrica
      3. 10.5.3 Resto de MEA
  11. 11 PANORAMA COMPETITIVO
    1. 11.1 Descripción general
    2. 11.2 Análisis Competitivo
    3. 11.3 Análisis de cuota de mercado
    4. 11.4 Importante estrategia de crecimiento en el mercado de servicios upstream de petróleo y gas
    5. 11.5 Benchmarking competitivo
    6. 11.6 Actores líderes en términos de número de desarrollos en el mercado de servicios upstream de petróleo y gas
    7. 11.7 Desarrollos clave y estrategias de crecimiento
      1. 11.7.1 Lanzamiento de nuevos productos/implementación de servicios
      2. 11.7.2 Fusión y Adquisiciones
      3. 11.7.3 Empresas conjuntas
    8. 11.8 Matriz financiera de los principales actores
      1. 11.8.1 Ventas e ingresos operativos
      2. 11.8.2 Gasto en I+D de los principales actores. 2023
  12. 12 PERFILES DE LA EMPRESA
    1. 12.1 Petrofac
      1. 12.1.1 Panorama financiero
      2. 12.1.2 Productos Ofrecidos
      3. 12.1.3 Desarrollos clave
      4. 12.1.4 Análisis FODA
      5. 12.1.5 Estrategias clave
    2. 12.2 McDermott Internacional
      1. 12.2.1 Panorama financiero
      2. 12.2.2 Productos Ofrecidos
      3. 12.2.3 Desarrollos clave
      4. 12.2.4 Análisis FODA
      5. 12.2.5 Estrategias clave
    3. 12.3 Oceaneering International
      1. 12.3.1 Panorama financiero
      2. 12.3.2 Productos Ofrecidos
      3. 12.3.3 Desarrollos clave
      4. 12.3.4 Análisis FODA
      5. 12.3.5 Estrategias clave
    4. 12.4 Cameron Internacional
      1. 12.4.1 Panorama financiero
      2. 12.4.2 Productos Ofrecidos
      3. 12.4.3 Desarrollos clave
      4. 12.4.4 Análisis FODA
      5. 12.4.5 Estrategias clave
    5. 12.5 Schlumberger
      1. 12.5.1 Panorama financiero
      2. 12.5.2 Productos ofrecidos
      3. 12.5.3 Desarrollos clave
      4. 12.5.4 Análisis FODA
      5. 12.5.5 Estrategias clave
    6. 12.6 Soluciones Aker
      1. 12.6.1 Panorama financiero
      2. 12.6.2 Productos ofrecidos
      3. 12.6.3 Desarrollos clave
      4. 12.6.4 Análisis FODA
      5. 12.6.5 Estrategias clave
    7. 12.7 Baker Hughes
      1. 12.7.1 Panorama financiero
      2. 12.7.2 Productos ofrecidos
      3. 12.7.3 Desarrollos clave
      4. 12.7.4 Análisis FODA
      5. 12.7.5 Estrategias clave
    8. 12.8 Corporación Noble
      1. 12.8.1 Panorama financiero
      2. 12.8.2 Productos ofrecidos
      3. 12.8.3 Desarrollos clave
      4. 12.8.4 Análisis FODA
      5. 12.8.5 Estrategias clave
    9. 12.9 Weatherford Internacional
      1. 12.9.1 Panorama financiero
      2. 12.9.2 Productos ofrecidos
      3. 12.9.3 Desarrollos clave
      4. 12.9.4 Análisis FODA
      5. 12.9.5 Estrategias clave
    10. 12.10 TechnipFMC
      1. 12.10.1 Panorama financiero
      2. 12.10.2 Productos Ofrecidos
      3. 12.10.3 Desarrollos clave
      4. 12.10.4 Análisis FODA
      5. 12.10.5 Estrategias clave
    11. 12.11 Saipem
      1. 12.11.1 Panorama financiero
      2. 12.11.2 Productos Ofrecidos
      3. 12.11.3 Desarrollos clave
      4. 12.11.4 Análisis FODA
      5. 12.11.5 Estrategias clave
    12. 12.12 Royal Dutch Shell
      1. 12.12.1 Panorama financiero
      2. 12.12.2 Productos Ofrecidos
      3. 12.12.3 Desarrollos clave
      4. 12.12.4 Análisis FODA
      5. 12.12.5 Estrategias clave
    13. 12.13 Transocean
      1. 12.13.1 Panorama financiero
      2. 12.13.2 Productos Ofrecidos
      3. 12.13.3 Desarrollos clave
      4. 12.13.4 Análisis FODA
      5. 12.13.5 Estrategias clave
    14. 12.14 Halliburton
      1. 12.14.1 Panorama financiero
      2. 12.14.2 Productos Ofrecidos
      3. 12.14.3 Desarrollos clave
      4. 12.14.4 Análisis FODA
      5. 12.14.5 Estrategias clave
    15. 12.15 Submarino 7
      1. 12.15.1 Panorama financiero
      2. 12.15.2 Productos ofrecidos
      3. 12.15.3 Desarrollos clave
      4. 12.15.4 Análisis FODA
      5. 12.15.5 Estrategias clave
  13. 13 APÉNDICE
    1. 13.1 Referencias
    2. 13.2 Informes relacionados
    3. LISTA DE TABLAS
    4. TABLA 1. LISTA DE SUPUESTOS
    5. TABLA 2. ESTIMACIONES Y ESTIMACIONES DEL TAMAÑO DEL MERCADO DE SERVICIOS DE GAS Y PETRÓLEO ARRIBA DE AMÉRICA DEL NORTE. PRONÓSTICO, POR TIPO DE SERVICIO, 2019-2032 (MILES DE MILLONES DE USD)
    6. TABLA 3. ESTIMACIONES Y ESTIMACIONES DEL TAMAÑO DEL MERCADO DE SERVICIOS DE PETRÓLEO Y GAS EN AMÉRICA DEL NORTE. PRONÓSTICO, POR APLICACIÓN, 2019-2032 (MILES DE MILLONES DE USD)
    7. TABLA 4. ESTIMACIONES Y ESTIMACIONES DEL TAMAÑO DEL MERCADO DE SERVICIOS DE PETRÓLEO Y GAS EN AMÉRICA DEL NORTE. PRONÓSTICO, POR MODO DE SERVICIO, 2019-2032 (MILES DE MILLONES DE USD)
    8. TABLA 5. ESTIMACIONES Y ESTIMACIONES DEL TAMAÑO DEL MERCADO DE SERVICIOS DE PETRÓLEO Y GAS EN AMÉRICA DEL NORTE. PRONÓSTICO, POR TIPO DE CLIENTE, 2019-2032 (MILES DE MILLONES DE USD)
    9. TABLA 6. ESTIMACIONES Y ESTIMACIONES DEL TAMAÑO DEL MERCADO DE SERVICIOS DE PETRÓLEO Y GAS EN AMÉRICA DEL NORTE. PRONÓSTICO, POR REGIONAL, 2019-2032 (MILES DE MILLONES DE USD)
    10. TABLA 7. ESTIMACIONES Y PRESENTACIONES DEL TAMAÑO DEL MERCADO DE SERVICIOS DE PETRÓLEO Y GAS DE EE.UU. PRONÓSTICO, POR TIPO DE SERVICIO, 2019-2032 (MILES DE MILLONES DE USD)
    11. TABLA 8. ESTIMACIONES Y PRONÓSTICOS DEL TAMAÑO DEL MERCADO DE SERVICIOS DE PETRÓLEO Y GAS DE EE. UU. PRONÓSTICO, POR APLICACIÓN, 2019-2032 (MILES DE MILLONES DE USD)
    12. TABLA 9. ESTIMACIONES Y ESTIMACIONES DEL TAMAÑO DEL MERCADO DE SERVICIOS DE PETRÓLEO Y GAS DE EE.UU. PRONÓSTICO, POR MODO DE SERVICIO, 2019-2032 (MILES DE MILLONES DE USD)
    13. TABLA 10. ESTIMACIONES Y ESTIMACIONES DEL TAMAÑO DEL MERCADO DE SERVICIOS DE PETRÓLEO Y GAS DE EE.UU. PRONÓSTICO, POR TIPO DE CLIENTE, 2019-2032 (MILES DE MILLONES DE USD)
    14. TABLA 11. ESTIMACIONES Y PRÁCTICAS DEL TAMAÑO DEL MERCADO DE SERVICIOS DE PETRÓLEO Y GAS DE EE. UU. PRONÓSTICO, POR REGIONAL, 2019-2032 (MILES DE MILLONES DE USD)
    15. TABLA 12. ESTIMACIONES Y PRESENTACIONES DEL TAMAÑO DEL MERCADO DE SERVICIOS DE PETRÓLEO Y GAS EN CANADÁ. PRONÓSTICO, POR TIPO DE SERVICIO, 2019-2032 (MILES DE MILLONES DE USD)
    16. TABLA 13. ESTIMACIONES Y PRONÓSTICOS DEL TAMAÑO DEL MERCADO DE SERVICIOS DE PETRÓLEO Y GAS EN CANADÁ. PRONÓSTICO, POR APLICACIÓN, 2019-2032 (MILES DE MILLONES DE USD)
    17. TABLA 14. ESTIMACIONES Y ESTIMACIONES DEL TAMAÑO DEL MERCADO DE SERVICIOS DE PETRÓLEO Y GAS EN CANADÁ. PRONÓSTICO, POR MODO DE SERVICIO, 2019-2032 (MILES DE MILLONES DE USD)
    18. TABLA 15. ESTIMACIONES Y ESTIMACIONES DEL TAMAÑO DEL MERCADO DE SERVICIOS DE PETRÓLEO Y GAS EN CANADÁ. PRONÓSTICO, POR TIPO DE CLIENTE, 2019-2032 (MILES DE MILLONES DE USD)
    19. TABLA 16. ESTIMACIONES Y PREVISIÓN DEL TAMAÑO DEL MERCADO DE SERVICIOS DE PETRÓLEO Y GAS EN CANADÁ. PRONÓSTICO, POR REGIONAL, 2019-2032 (MILES DE MILLONES DE USD)
    20. TABLA 17. ESTIMACIONES Y PRESIONES DEL TAMAÑO DEL MERCADO DE SERVICIOS DE PETRÓLEO Y GAS EN EUROPA. PRONÓSTICO, POR TIPO DE SERVICIO, 2019-2032 (MILES DE MILLONES DE USD)
    21. TABLA 18. ESTIMACIONES Y PRONÓSTICOS DEL TAMAÑO DEL MERCADO DE SERVICIOS DE PETRÓLEO Y GAS EN EUROPA. PRONÓSTICO, POR APLICACIÓN, 2019-2032 (MILES DE MILLONES DE USD)
    22. TABLA 19. ESTIMACIONES Y ESTIMACIONES DEL TAMAÑO DEL MERCADO DE SERVICIOS DE PETRÓLEO Y GAS EN EUROPA. PRONÓSTICO, POR MODO DE SERVICIO, 2019-2032 (MILES DE MILLONES DE USD)
    23. TABLA 20. ESTIMACIONES Y ESTIMACIONES DEL TAMAÑO DEL MERCADO DE SERVICIOS DE PETRÓLEO Y GAS EN EUROPA. PRONÓSTICO, POR TIPO DE CLIENTE, 2019-2032 (MILES DE MILLONES DE USD)
    24. TABLA 21. ESTIMACIONES Y PREVISIÓN DEL TAMAÑO DEL MERCADO DE SERVICIOS DE PETRÓLEO Y GAS EN EUROPA. PRONÓSTICO, POR REGIONAL, 2019-2032 (MILES DE MILLONES DE USD)
    25. TABLA 22. ESTIMACIONES Y ESTIMACIONES DEL TAMAÑO DEL MERCADO DE SERVICIOS DE PETRÓLEO Y GAS EN ALEMANIA EN ALEMANIA. PRONÓSTICO, POR TIPO DE SERVICIO, 2019-2032 (MILES DE MILLONES DE USD)
    26. TABLA 23. ESTIMACIONES Y ESTIMACIONES DEL TAMAÑO DEL MERCADO DE SERVICIOS DE PETRÓLEO Y GAS EN ALEMANIA EN ALEMANIA. PRONÓSTICO, POR APLICACIÓN, 2019-2032 (MILES DE MILLONES DE USD)
    27. TABLA 24. ESTIMACIONES Y ESTIMACIONES DEL TAMAÑO DEL MERCADO DE SERVICIOS DE PETRÓLEO Y GAS UPSTREAM DE ALEMANIA. PRONÓSTICO, POR MODO DE SERVICIO, 2019-2032 (MILES DE MILLONES DE USD)
    28. TABLA 25. ESTIMACIONES Y ESTIMACIONES DEL TAMAÑO DEL MERCADO DE SERVICIOS DE PETRÓLEO Y GAS EN ALEMANIA EN ALEMANIA. PRONÓSTICO, POR TIPO DE CLIENTE, 2019-2032 (MILES DE MILLONES DE USD)
    29. TABLA 26. ESTIMACIONES Y ESTIMACIONES DEL TAMAÑO DEL MERCADO DE SERVICIOS DE PETRÓLEO Y GAS EN ALEMANIA. PRONÓSTICO, POR REGIONAL, 2019-2032 (MILES DE MILLONES DE USD)
    30. TABLA 27. ESTIMACIONES Y ESTIMACIONES DEL TAMAÑO DEL MERCADO DE SERVICIOS DE GAS Y PETRÓLEO UPSTREAM DEL REINO UNIDO. PRONÓSTICO, POR TIPO DE SERVICIO, 2019-2032 (MILES DE MILLONES DE USD)
    31. TABLA 28. ESTIMACIONES Y ESTIMACIONES DEL TAMAÑO DEL MERCADO DE SERVICIOS DE PETRÓLEO Y GAS EN EL REINO UNIDO. PRONÓSTICO, POR APLICACIÓN, 2019-2032 (MILES DE MILLONES DE USD)
    32. TABLA 29. ESTIMACIONES Y ESTIMACIONES DEL TAMAÑO DEL MERCADO DE SERVICIOS DE GAS Y PETRÓLEO UPSTREAM DEL REINO UNIDO. PRONÓSTICO, POR MODO DE SERVICIO, 2019-2032 (MILES DE MILLONES DE USD)
    33. TABLA 30. ESTIMACIONES Y ESTIMACIONES DEL TAMAÑO DEL MERCADO DE SERVICIOS DE PETRÓLEO Y GAS EN EL REINO UNIDO. PRONÓSTICO, POR TIPO DE CLIENTE, 2019-2032 (MILES DE MILLONES DE USD)
    34. TABLA 31. ESTIMACIONES Y ESTIMACIONES DEL TAMAÑO DEL MERCADO DE SERVICIOS DE PETRÓLEO Y GAS UPSTREAM DEL REINO UNIDO. PRONÓSTICO, POR REGIONAL, 2019-2032 (MILES DE MILLONES DE USD)
    35. TABLA 32. ESTIMACIONES Y PROYECTOS DEL TAMAÑO DEL MERCADO DE SERVICIOS DE PETRÓLEO Y GAS EN FRANCIA. PRONÓSTICO, POR TIPO DE SERVICIO, 2019-2032 (MILES DE MILLONES DE USD)
    36. TABLA 33. ESTIMACIONES Y ESTIMACIONES DEL TAMAÑO DEL MERCADO DE SERVICIOS DE PETRÓLEO Y GAS EN FRANCIA. PRONÓSTICO, POR APLICACIÓN, 2019-2032 (MILES DE MILLONES DE USD)
    37. TABLA 34. ESTIMACIONES Y ESTIMACIONES DEL TAMAÑO DEL MERCADO DE SERVICIOS DE PETRÓLEO Y GAS EN FRANCIA. PRONÓSTICO, POR MODO DE SERVICIO, 2019-2032 (MILES DE MILLONES DE USD)
    38. TABLA 35. ESTIMACIONES Y ESTIMACIONES DEL TAMAÑO DEL MERCADO DE SERVICIOS DE PETRÓLEO Y GAS EN FRANCIA. PRONÓSTICO, POR TIPO DE CLIENTE, 2019-2032 (MILES DE MILLONES DE USD)
    39. TABLA 36. ESTIMACIONES Y EMPRESAS DEL TAMAÑO DEL MERCADO DE SERVICIOS DE PETRÓLEO Y GAS EN FRANCIA. PRONÓSTICO, POR REGIONAL, 2019-2032 (MILES DE MILLONES DE USD)
    40. TABLA 37. ESTIMACIONES Y ESTIMACIONES DEL TAMAÑO DEL MERCADO DE SERVICIOS DE PETRÓLEO Y GAS EN RUSIA. PRONÓSTICO, POR TIPO DE SERVICIO, 2019-2032 (MILES DE MILLONES DE USD)
    41. TABLA 38. ESTIMACIONES Y ESTIMACIONES DEL TAMAÑO DEL MERCADO DE SERVICIOS DE PETRÓLEO Y GAS EN RUSIA. PRONÓSTICO, POR APLICACIÓN, 2019-2032 (MILES DE MILLONES DE USD)
    42. TABLA 39. ESTIMACIONES Y ESTIMACIONES DEL TAMAÑO DEL MERCADO DE SERVICIOS DE PETRÓLEO Y GAS EN RUSIA. PRONÓSTICO, POR MODO DE SERVICIO, 2019-2032 (MILES DE MILLONES DE USD)
    43. TABLA 40. ESTIMACIONES Y ESTIMACIONES DEL TAMAÑO DEL MERCADO DE SERVICIOS DE PETRÓLEO Y GAS EN RUSIA. PRONÓSTICO, POR TIPO DE CLIENTE, 2019-2032 (MILES DE MILLONES DE USD)
    44. TABLA 41. ESTIMACIONES Y ESTIMACIONES DEL TAMAÑO DEL MERCADO DE SERVICIOS DE PETRÓLEO Y GAS EN RUSIA. PRONÓSTICO, POR REGIONAL, 2019-2032 (MILES DE MILLONES DE USD)
    45. TABLA 42. ESTIMACIONES Y ESTIMACIONES DEL TAMAÑO DEL MERCADO DE SERVICIOS DE PETRÓLEO Y GAS EN ITALIA. PRONÓSTICO, POR TIPO DE SERVICIO, 2019-2032 (MILES DE MILLONES DE USD)
    46. TABLA 43. ESTIMACIONES Y ESTIMACIONES DEL TAMAÑO DEL MERCADO DE SERVICIOS DE PETRÓLEO Y GAS EN ITALIA. PRONÓSTICO, POR APLICACIÓN, 2019-2032 (MILES DE MILLONES DE USD)
    47. TABLA 44. PETRÓLEO UPSTREAM DE ITALIAY ESTIMACIONES Y ESTIMACIONES DEL TAMAÑO DEL MERCADO DE SERVICIOS DE GAS PRONÓSTICO, POR MODO DE SERVICIO, 2019-2032 (MILES DE MILLONES DE USD)
    48. TABLA 45. ESTIMACIONES Y ESTIMACIONES DEL TAMAÑO DEL MERCADO DE SERVICIOS DE PETRÓLEO Y GAS EN ITALIA. PRONÓSTICO, POR TIPO DE CLIENTE, 2019-2032 (MILES DE MILLONES DE USD)
    49. TABLA 46. ESTIMACIONES Y PREVISIÓN DEL TAMAÑO DEL MERCADO DE SERVICIOS DE PETRÓLEO Y GAS EN ITALIA. PRONÓSTICOS, POR REGIONALES, 2019-2032 (MILES DE MILLONES DE USD)
    50. TABLA 47. ESTIMACIONES Y ESTIMACIONES DEL TAMAÑO DEL MERCADO DE SERVICIOS DE PETRÓLEO Y GAS EN ESPAÑA. PRONÓSTICO, POR TIPO DE SERVICIO, 2019-2032 (MILES DE MILLONES DE USD)
    51. TABLA 48. ESTIMACIONES Y ESTIMACIONES DEL TAMAÑO DEL MERCADO DE SERVICIOS DE PETRÓLEO Y GAS EN ESPAÑA. PRONÓSTICO, POR APLICACIÓN, 2019-2032 (MILES DE MILLONES DE USD)
    52. TABLA 49. ESTIMACIONES Y ESTIMACIONES DEL TAMAÑO DEL MERCADO DE SERVICIOS DE PETRÓLEO Y GAS EN ESPAÑA. PREVISIÓN, POR MODO DE SERVICIO, 2019-2032 (MILES DE MILLONES DE USD)
    53. TABLA 50. ESTIMACIONES Y ESTIMACIONES DEL TAMAÑO DEL MERCADO DE SERVICIOS DE PETRÓLEO Y GAS EN ESPAÑA. PREVISIÓN, POR TIPO DE CLIENTE, 2019-2032 (MILES DE MILLONES DE USD)
    54. TABLA 51. ESTIMACIONES Y ESTIMACIONES DEL TAMAÑO DEL MERCADO DE SERVICIOS DE PETRÓLEO Y GAS EN ESPAÑA. PRONÓSTICO, POR REGIONAL, 2019-2032 (MILES DE MILLONES DE USD)
    55. TABLA 52. ESTIMACIONES Y ESTIMACIONES DEL TAMAÑO DEL MERCADO DE SERVICIOS DE PETRÓLEO Y GAS PARA EL RESTO DE EUROPA. PRONÓSTICO, POR TIPO DE SERVICIO, 2019-2032 (MILES DE MILLONES DE USD)
    56. TABLA 53. ESTIMACIONES Y ESTIMACIONES DEL TAMAÑO DEL MERCADO DE SERVICIOS DE PETRÓLEO Y GAS PARA EL RESTO DE EUROPA. PRONÓSTICO, POR APLICACIÓN, 2019-2032 (MILES DE MILLONES DE USD)
    57. TABLA 54. ESTIMACIONES Y ESTIMACIONES DEL TAMAÑO DEL MERCADO DE SERVICIOS DE PETRÓLEO Y GAS PARA EL RESTO DE EUROPA. PRONÓSTICO, POR MODO DE SERVICIO, 2019-2032 (MILES DE MILLONES DE USD)
    58. TABLA 55. ESTIMACIONES Y ESTIMACIONES DEL TAMAÑO DEL MERCADO DE SERVICIOS DE PETRÓLEO Y GAS PARA EL RESTO DE EUROPA. PRONÓSTICO, POR TIPO DE CLIENTE, 2019-2032 (MILES DE MILLONES DE USD)
    59. TABLA 56. ESTIMACIONES Y ESTIMACIONES DEL TAMAÑO DEL MERCADO DE SERVICIOS DE PETRÓLEO Y GAS PARA EL RESTO DE EUROPA. PRONÓSTICO, POR REGIONAL, 2019-2032 (MILES DE MILLONES DE USD)
    60. TABLA 57. ESTIMACIONES Y ESTIMACIONES DEL TAMAÑO DEL MERCADO DE SERVICIOS DE PETRÓLEO Y GAS EN APAC APAC. PRONÓSTICO, POR TIPO DE SERVICIO, 2019-2032 (MILES DE MILLONES DE USD)
    61. TABLA 58. ESTIMACIONES Y ESTIMACIONES DEL TAMAÑO DEL MERCADO DE SERVICIOS DE PETRÓLEO Y GAS APAC APAC. PRONÓSTICO, POR APLICACIÓN, 2019-2032 (MILES DE MILLONES DE USD)
    62. TABLA 59. ESTIMACIONES Y ESTIMACIONES DEL TAMAÑO DEL MERCADO DE SERVICIOS DE PETRÓLEO Y GAS EN APAC APAC. PRONÓSTICO, POR MODO DE SERVICIO, 2019-2032 (MILES DE MILLONES DE USD)
    63. TABLA 60. ESTIMACIONES Y ESTIMACIONES DEL TAMAÑO DEL MERCADO DE SERVICIOS DE PETRÓLEO Y GAS APAC APAC. PRONÓSTICO, POR TIPO DE CLIENTE, 2019-2032 (MILES DE MILLONES DE USD)
    64. TABLA 61. ESTIMACIONES Y ESTIMACIONES DEL TAMAÑO DEL MERCADO DE SERVICIOS DE PETRÓLEO Y GAS APAC APAC. PRONÓSTICO, POR REGIONAL, 2019-2032 (MILES DE MILLONES DE USD)
    65. TABLA 62. ESTIMACIONES Y ESTIMACIONES DEL TAMAÑO DEL MERCADO DE SERVICIOS DE PETRÓLEO Y GAS EN CHINA UPSTREAM. PRONÓSTICO, POR TIPO DE SERVICIO, 2019-2032 (MILES DE MILLONES DE USD)
    66. TABLA 63. ESTIMACIONES Y ESTIMACIONES DEL TAMAÑO DEL MERCADO DE SERVICIOS DE PETRÓLEO Y GAS UPSTREAM DE CHINA. PRONÓSTICO, POR APLICACIÓN, 2019-2032 (MILES DE MILLONES DE USD)
    67. TABLA 64. ESTIMACIONES Y ESTIMACIONES DEL TAMAÑO DEL MERCADO DE SERVICIOS DE PETRÓLEO Y GAS EN CHINA UPSTREAM. PRONÓSTICO, POR MODO DE SERVICIO, 2019-2032 (MILES DE MILLONES DE USD)
    68. TABLA 65. ESTIMACIONES Y ESTIMACIONES DEL TAMAÑO DEL MERCADO DE SERVICIOS DE PETRÓLEO Y GAS EN CHINA UPSTREAM. PRONÓSTICO, POR TIPO DE CLIENTE, 2019-2032 (MILES DE MILLONES DE USD)
    69. TABLA 66. ESTIMACIONES Y ESTIMACIONES DEL TAMAÑO DEL MERCADO DE SERVICIOS DE GAS Y PETRÓLEO UPSTREAM DE CHINA. PRONÓSTICO, POR REGIONAL, 2019-2032 (MILES DE MILLONES DE USD)
    70. TABLA 67. ESTIMACIONES Y ESTIMACIONES DEL TAMAÑO DEL MERCADO DE SERVICIOS DE PETRÓLEO Y GAS EN LA INDIA UPSTREAM. PRONÓSTICO, POR TIPO DE SERVICIO, 2019-2032 (MILES DE MILLONES DE USD)
    71. TABLA 68. ESTIMACIONES Y ESTIMACIONES DEL TAMAÑO DEL MERCADO DE SERVICIOS DE PETRÓLEO Y GAS EN LA INDIA. PRONÓSTICO, POR APLICACIÓN, 2019-2032 (MILES DE MILLONES DE USD)
    72. TABLA 69. ESTIMACIONES Y ESTIMACIONES DEL TAMAÑO DEL MERCADO DE SERVICIOS DE PETRÓLEO Y GAS EN LA INDIA. PRONÓSTICO, POR MODO DE SERVICIO, 2019-2032 (MILES DE MILLONES DE USD)
    73. TABLA 70. ESTIMACIONES Y ESTIMACIONES DEL TAMAÑO DEL MERCADO DE SERVICIOS DE PETRÓLEO Y GAS ARRIBA DE LA INDIA. PRONÓSTICO, POR TIPO DE CLIENTE, 2019-2032 (MILES DE MILLONES DE USD)
    74. TABLA 71. ESTIMACIONES Y ESTIMACIONES DEL TAMAÑO DEL MERCADO DE SERVICIOS DE PETRÓLEO Y GAS EN LA INDIA. PRONÓSTICO, POR REGIONAL, 2019-2032 (MILES DE MILLONES DE USD)
    75. TABLA 72. ESTIMACIONES Y PRESENTACIONES DEL TAMAÑO DEL MERCADO DE SERVICIOS DE PETRÓLEO Y GAS EN JAPÓN. PRONÓSTICO, POR TIPO DE SERVICIO, 2019-2032 (MILES DE MILLONES DE USD)
    76. TABLA 73. ESTIMACIONES Y ESTIMACIONES DEL TAMAÑO DEL MERCADO DE SERVICIOS DE PETRÓLEO Y GAS ARRIBA DE JAPÓN EN JAPÓN. PRONÓSTICO, POR APLICACIÓN, 2019-2032 (MILES DE MILLONES DE USD)
    77. TABLA 74. ESTIMACIONES Y ESTIMACIONES DEL TAMAÑO DEL MERCADO DE SERVICIOS DE PETRÓLEO Y GAS EN JAPÓN. PRONÓSTICO, POR MODO DE SERVICIO, 2019-2032 (MILES DE MILLONES DE USD)
    78. TABLA 75. ESTIMACIONES Y ESTIMACIONES DEL TAMAÑO DEL MERCADO DE SERVICIOS DE PETRÓLEO Y GAS ARRIBA DE JAPÓN EN JAPÓN. PRONÓSTICO, POR TIPO DE CLIENTE, 2019-2032 (MILES DE MILLONES DE USD)
    79. TABLA 76. ESTIMACIONES Y ESTIMACIONES DEL TAMAÑO DEL MERCADO DE SERVICIOS DE PETRÓLEO Y GAS EN JAPÓN. PRONÓSTICO, POR REGIONAL, 2019-2032 (MILES DE MILLONES DE USD)
    80. TABLA 77. ESTIMACIONES Y ESTIMACIONES DEL TAMAÑO DEL MERCADO DE SERVICIOS DE PETRÓLEO Y GAS EN COREA DEL SUR. PRONÓSTICO, POR TIPO DE SERVICIO, 2019-2032 (MILES DE MILLONES DE USD)
    81. TABLA 78. ESTIMACIONES Y ESTIMACIONES DEL TAMAÑO DEL MERCADO DE SERVICIOS DE PETRÓLEO Y GAS EN COREA DEL SUR. PRONÓSTICO, POR APLICACIÓN, 2019-2032 (MILES DE MILLONES DE USD)
    82. TABLA 79. ESTIMACIONES Y ESTIMACIONES DEL TAMAÑO DEL MERCADO DE SERVICIOS DE PETRÓLEO Y GAS EN COREA DEL SUR. PRONÓSTICO, POR MODO DE SERVICIO, 2019-2032 (MILES DE MILLONES DE USD)
    83. TABLA 80. ESTIMACIONES Y ESTIMACIONES DEL TAMAÑO DEL MERCADO DE SERVICIOS DE PETRÓLEO Y GAS ARRIBA DE COREA DEL SUR. PRONÓSTICO, POR TIPO DE CLIENTE, 2019-2032 (MILES DE MILLONES DE USD)
    84. TABLA 81. ESTIMACIONES Y ESTIMACIONES DEL TAMAÑO DEL MERCADO DE SERVICIOS DE PETRÓLEO Y GAS EN COREA DEL SUR. PRONÓSTICO, POR REGIONAL, 2019-2032 (MILES DE MILLONES DE USD)
    85. TABLA 82. ESTIMACIONES Y ESTIMACIONES DEL TAMAÑO DEL MERCADO DE SERVICIOS DE PETRÓLEO Y GAS ARRIBA DE MALASIA. PRONÓSTICO, POR TIPO DE SERVICIO, 2019-2032 (MILES DE MILLONES DE USD)
    86. TABLA 83. ESTIMACIONES Y ESTIMACIONES DEL TAMAÑO DEL MERCADO DE SERVICIOS DE PETRÓLEO Y GAS ARRIBA DE MALASIA. PRONÓSTICO, POR APLICACIÓN, 2019-2032 (MILES DE MILLONES DE USD)
    87. TABLA 84. ESTIMACIONES Y ESTIMACIONES DEL TAMAÑO DEL MERCADO DE SERVICIOS DE PETRÓLEO Y GAS ARRIBA DE MALASIA. PRONÓSTICO, POR MODO DE SERVICIO, 2019-2032 (MILES DE MILLONES DE USD)
    88. TABLA 85. ESTIMACIONES Y ESTIMACIONES DEL TAMAÑO DEL MERCADO DE SERVICIOS DE PETRÓLEO Y GAS ARRIBA DE MALASIA. PRONÓSTICO, POR TIPO DE CLIENTE, 2019-2032 (MILES DE MILLONES DE USD)
    89. TABLA 86. ESTIMACIONES Y ESTIMACIONES DEL TAMAÑO DEL MERCADO DE SERVICIOS DE PETRÓLEO Y GAS ARRIBA DE MALASIA. PRONÓSTICO, POR REGIONAL, 2019-2032 (MILES DE MILLONES DE USD)
    90. TABLA 87. ESTIMACIONES Y ESTIMACIONES DEL TAMAÑO DEL MERCADO DE SERVICIOS DE PETRÓLEO Y GAS EN TAILANDIA. PRONÓSTICO, POR TIPO DE SERVICIO, 2019-2032 (MILES DE MILLONES DE USD)
    91. TABLA 88. ESTIMACIONES Y ESTIMACIONES DEL TAMAÑO DEL MERCADO DE SERVICIOS DE PETRÓLEO Y GAS ARRIBA DE TAILANDIA. PRONÓSTICO, POR APLICACIÓN, 2019-2032 (MILES DE MILLONES DE USD)
    92. TABLA 89. ESTIMACIONES Y ESTIMACIONES DEL TAMAÑO DEL MERCADO DE SERVICIOS DE PETRÓLEO Y GAS ARRIBA DE TAILANDIA. PRONÓSTICO, POR MODO DE SERVICIO, 2019-2032 (MILES DE MILLONES DE USD)
    93. TABLA 90. ESTIMACIONES Y ESTIMACIONES DEL TAMAÑO DEL MERCADO DE SERVICIOS DE PETRÓLEO Y GAS ARRIBA DE TAILANDIA. PRONÓSTICO, POR TIPO DE CLIENTE, 2019-2032 (MILES DE MILLONES DE USD)
    94. TABLA 91. ESTIMACIONES Y ESTIMACIONES DEL TAMAÑO DEL MERCADO DE SERVICIOS DE PETRÓLEO Y GAS ARRIBA DE TAILANDIA. PRONÓSTICO, POR REGIONAL, 2019-2032 (MILES DE MILLONES DE USD)
    95. TABLA 92. ESTIMACIONES Y ESTIMACIONES DEL TAMAÑO DEL MERCADO DE SERVICIOS DE PETRÓLEO Y GAS EN INDONESIA. PRONÓSTICO, POR TIPO DE SERVICIO, 2019-2032 (MILES DE MILLONES DE USD)
    96. TABLA 93. ESTIMACIONES Y PRONÓSTICOS DEL TAMAÑO DEL MERCADO DE SERVICIOS DE PETRÓLEO Y GAS EN INDONESIA. PRONÓSTICO, POR APLICACIÓN, 2019-2032 (MILES DE MILLONES DE USD)
    97. TABLA 94. ESTIMACIONES Y ESTIMACIONES DEL TAMAÑO DEL MERCADO DE SERVICIOS DE PETRÓLEO Y GAS EN INDONESIA. PRONÓSTICO, POR MODO DE SERVICIO, 2019-2032 (MILES DE MILLONES DE USD)
    98. TABLA 95. ESTIMACIONES Y ESTIMACIONES DEL TAMAÑO DEL MERCADO DE SERVICIOS DE PETRÓLEO Y GAS EN INDONESIA UPSTREAM. PRONÓSTICO, POR TIPO DE CLIENTE, 2019-2032 (MILES DE MILLONES DE USD)
    99. TABLA 96. ESTIMACIONES Y ESTIMACIONES DEL TAMAÑO DEL MERCADO DE SERVICIOS DE PETRÓLEO Y GAS EN INDONESIA. PRONÓSTICO, POR REGIONAL, 2019-2032 (MILES DE MILLONES DE USD)
    100. TABLA 97. ESTIMACIONES Y ESTIMACIONES DEL TAMAÑO DEL MERCADO DE SERVICIOS DE PETRÓLEO Y GAS DEL RESTO DE APAC UPSTREAM. PRONÓSTICO, POR TIPO DE SERVICIO, 2019-2032 (MILES DE MILLONES DE USD)
    101. TABLA 98. ESTIMACIONES Y ESTIMACIONES DEL TAMAÑO DEL MERCADO DE SERVICIOS DE PETRÓLEO Y GAS DEL RESTO DE APAC UPSTREAM. PRONÓSTICO, POR APLICACIÓN, 2019-2032 (MILES DE MILLONES DE USD)
    102. TABLA 99. ESTIMACIONES Y ESTIMACIONES DEL TAMAÑO DEL MERCADO DE SERVICIOS DE PETRÓLEO Y GAS DEL RESTO DE APAC UPSTREAM. PRONÓSTICO, POR MODO DE SERVICIO, 2019-2032 (MILES DE MILLONES DE USD)
    103. TABLA 100. ESTIMACIONES Y ESTIMACIONES DEL TAMAÑO DEL MERCADO DE SERVICIOS DE PETRÓLEO Y GAS DEL RESTO DE APAC UPSTREAM. PRONÓSTICO, POR TIPO DE CLIENTE, 2019-2032 (MILES DE MILLONES DE USD)
    104. TABLA 101. ESTIMACIONES Y ESTIMACIONES DEL TAMAÑO DEL MERCADO DE SERVICIOS DE PETRÓLEO Y GAS DEL RESTO DE APAC UPSTREAM. PRONÓSTICO, POR REGIONAL, 2019-2032 (MILES DE MILLONES DE USD)
    105. TABLA 102. ESTIMACIONES Y PRONÓSTICOS DEL TAMAÑO DEL MERCADO DE SERVICIOS DE PETRÓLEO Y GAS EN AMÉRICA DEL SUR. PRONÓSTICO, POR TIPO DE SERVICIO, 2019-2032 (MILES DE MILLONES DE USD)
    106. TABLA 103. ESTIMACIONES Y PRONÓSTICOS DEL TAMAÑO DEL MERCADO DE SERVICIOS DE PETRÓLEO Y GAS EN AMÉRICA DEL SUR. PRONÓSTICO, POR APLICACIÓN, 2019-2032 (MILES DE MILLONES DE USD)
    107. TABLA 104. ESTIMACIONES Y ESTIMACIONES DEL TAMAÑO DEL MERCADO DE SERVICIOS DE PETRÓLEO Y GAS ARRIBA DE AMÉRICA DEL SUR. PRONÓSTICO, POR MODO DE SERVICIO, 2019-2032 (MILES DE MILLONES DE USD)
    108. TABLA 105. ESTIMACIONES Y ESTIMACIONES DEL TAMAÑO DEL MERCADO DE SERVICIOS DE PETRÓLEO Y GAS EN AMÉRICA DEL SUR. PRONÓSTICO, POR TIPO DE CLIENTE, 2019-2032 (MILES DE MILLONES DE USD)
    109. TABLA 106. ESTIMACIONES Y PREVISIONES DEL TAMAÑO DEL MERCADO DE SERVICIOS DE PETRÓLEO Y GAS EN AMÉRICA DEL SUR. PRONÓSTICO, POR REGIONAL, 2019-2032 (MILES DE MILLONES DE USD)
    110. TABLA 107. ESTIMACIONES Y EMPRESAS DEL TAMAÑO DEL MERCADO DE SERVICIOS DE PETRÓLEO Y GAS EN BRASIL. PRONÓSTICO, POR TIPO DE SERVICIO, 2019-2032 (MILES DE MILLONES DE USD)
    111. TABLA 108. ESTIMACIONES Y ESTIMACIONES DEL TAMAÑO DEL MERCADO DE SERVICIOS DE PETRÓLEO Y GAS EN BRASIL. PRONÓSTICO, POR APLICACIÓN, 2019-2032 (MILES DE MILLONES DE USD)
    112. TABLA 109. ESTIMACIONES Y PRÁCTICAS DEL TAMAÑO DEL MERCADO DE SERVICIOS DE PETRÓLEO Y GAS EN BRASIL. PRONÓSTICO, POR MODO DE SERVICIO, 2019-2032 (MILES DE MILLONES DE USD)
    113. TABLA 110. ESTIMACIONES Y ESTIMACIONES DEL TAMAÑO DEL MERCADO DE SERVICIOS DE PETRÓLEO Y GAS EN BRASIL. PRONÓSTICO, POR TIPO DE CLIENTE, 2019-2032 (MILES DE MILLONES DE USD)
    114. TABLA 111. ESTIMACIONES Y EMPRESAS DEL TAMAÑO DEL MERCADO DE SERVICIOS DE PETRÓLEO Y GAS EN BRASIL. PRONÓSTICO, POR REGIONAL, 2019-2032 (MILES DE MILLONES DE USD)
    115. TABLA 112. ESTIMACIONES Y PROYECTOS DEL TAMAÑO DEL MERCADO DE SERVICIOS DE PETRÓLEO Y GAS UPSTREAM DE MÉXICO. PRONÓSTICO, POR TIPO DE SERVICIO, 2019-2032 (MILES DE MILLONES DE USD)
    116. TABLA 113. ESTIMACIONES Y PROYECTOS DEL TAMAÑO DEL MERCADO DE SERVICIOS DE PETRÓLEO Y GAS UPSTREAM DE MÉXICO. PRONÓSTICO, POR APLICACIÓN, 2019-2032 (MILES DE MILLONES DE USD)
    117. TABLA 114. ESTIMACIONES Y PROYECTOS DEL TAMAÑO DEL MERCADO DE SERVICIOS DE PETRÓLEO Y GAS UPSTREAM DE MÉXICO. PRONÓSTICO, POR MODO DE SERVICIO, 2019-2032 (MILES DE MILLONES DE USD)
    118. TABLA 115. ESTIMACIONES Y PROYECTOS DEL TAMAÑO DEL MERCADO DE SERVICIOS DE PETRÓLEO Y GAS UPSTREAM DE MÉXICO. PRONÓSTICO, POR TIPO DE CLIENTE, 2019-2032 (MILES DE MILLONES DE USD)
    119. TABLA 116. ESTIMACIONES Y ESTIMACIONES DEL TAMAÑO DEL MERCADO DE SERVICIOS DE PETRÓLEO Y GAS UPSTREAM EN MÉXICO. PRONÓSTICO, POR REGIONAL, 2019-2032 (MILES DE MILLONES DE USD)
    120. TABLA 117. ESTIMACIONES Y ESTIMACIONES DEL TAMAÑO DEL MERCADO DE SERVICIOS DE PETRÓLEO Y GAS ARGENTINA EN ARGENTINA. PRONÓSTICO, POR TIPO DE SERVICIO, 2019-2032 (MILES DE MILLONES DE USD)
    121. TABLA 118. ESTIMACIONES Y ESTIMACIONES DEL TAMAÑO DEL MERCADO DE SERVICIOS DE PETRÓLEO Y GAS ARGENTINA EN ARGENTINA. PRONÓSTICO, POR APLICACIÓN, 2019-2032 (MILES DE MILLONES DE USD)
    122. TABLA 119. ESTIMACIONES Y ESTIMACIONES DEL TAMAÑO DEL MERCADO DE SERVICIOS DE PETRÓLEO Y GAS UPSTREAM DE ARGENTINA. PRONÓSTICO, POR MODO DE SERVICIO, 2019-2032 (MILES DE MILLONES DE USD)
    123. TABLA 120. ESTIMACIONES Y ESTIMACIONES DEL TAMAÑO DEL MERCADO DE SERVICIOS DE PETRÓLEO Y GAS ARGENTINA EN ARGENTINA. PRONÓSTICO, POR TIPO DE CLIENTE, 2019-2032 (MILES DE MILLONES DE USD)
    124. TABLA 121. ESTIMACIONES Y ESTIMACIONES DEL TAMAÑO DEL MERCADO DE SERVICIOS DE PETRÓLEO Y GAS UPSTREAM DE ARGENTINA. PRONÓSTICO, POR REGIONAL, 2019-2032 (MILES DE MILLONES DE USD)
    125. TABLA 122. ESTIMACIONES Y ESTIMACIONES DEL TAMAÑO DEL MERCADO DE SERVICIOS DE PETRÓLEO Y GAS PARA EL RESTO DE AMÉRICA DEL SUR. PRONÓSTICO, POR TIPO DE SERVICIO, 2019-2032 (MILES DE MILLONES DE USD)
    126. TABLA 123. ESTIMACIONES Y ESTIMACIONES DEL TAMAÑO DEL MERCADO DE SERVICIOS DE PETRÓLEO Y GAS PARA EL RESTO DE SUDAMÉRICA. PRONÓSTICO, POR APLICACIÓN, 2019-2032 (MILES DE MILLONES DE USD)
    127. TABLA 124. ESTIMACIONES Y ESTIMACIONES DEL TAMAÑO DEL MERCADO DE SERVICIOS DE PETRÓLEO Y GAS PARA EL RESTO DE AMÉRICA DEL SUR. PRONÓSTICO, POR MODO DE SERVICIO, 2019-2032 (MILES DE MILLONES DE USD)
    128. TABLA 125. ESTIMACIONES Y ESTIMACIONES DEL TAMAÑO DEL MERCADO DE SERVICIOS DE PETRÓLEO Y GAS PARA EL RESTO DE AMÉRICA DEL SUR. PRONÓSTICO, POR TIPO DE CLIENTE, 2019-2032 (MILES DE MILLONES DE USD)
    129. TABLA 126. ESTIMACIONES Y ESTIMACIONES DEL TAMAÑO DEL MERCADO DE SERVICIOS DE PETRÓLEO Y GAS PARA EL RESTO DE SUDAMÉRICA. PRONÓSTICO, POR REGIONAL, 2019-2032 (MILES DE MILLONES DE USD)
    130. TABLA 127. ESTIMACIONES Y PROYECTOS DEL TAMAÑO DEL MERCADO DE SERVICIOS DE PETRÓLEO Y GAS MEA UPSTREAM. PRONÓSTICO, POR TIPO DE SERVICIO, 2019-2032 (MILES DE MILLONES DE USD)
    131. TABLA 128. ESTIMACIONES Y ESTIMACIONES DEL TAMAÑO DEL MERCADO DE SERVICIOS DE PETRÓLEO Y GAS DE MEA UPSTREAM. PRONÓSTICO, POR APLICACIÓN, 2019-2032 (MILES DE MILLONES DE USD)
    132. TABLA 129. ESTIMACIONES Y ESTIMACIONES DEL TAMAÑO DEL MERCADO DE SERVICIOS DE PETRÓLEO Y GAS MEA UPSTREAM. PRONÓSTICO, POR MODO DE SERVICIO, 2019-2032 (MILES DE MILLONES DE USD)
    133. TABLA 130. ESTIMACIONES Y ESTIMACIONES DEL TAMAÑO DEL MERCADO DE SERVICIOS DE PETRÓLEO Y GAS MEA UPSTREAM. PRONÓSTICO, POR TIPO DE CLIENTE, 2019-2032 (MILES DE MILLONES DE USD)
    134. TABLA 131. ESTIMACIONES Y ESTIMACIONES DEL TAMAÑO DEL MERCADO DE SERVICIOS DE PETRÓLEO Y GAS MEA UPSTREAM. PRONÓSTICO, POR REGIONAL, 2019-2032 (MILES DE MILLONES DE USD)
    135. TABLA 132. ESTIMACIONES Y ESTIMACIONES DEL TAMAÑO DEL MERCADO DE SERVICIOS DE PETRÓLEO Y GAS DE LOS PAÍSES DEL CCG. PRONÓSTICO, POR TIPO DE SERVICIO, 2019-2032 (MILLONES DE USD)
    136. CUADRO 133. CCG CESTIMACIONES Y ESTIMACIONES DEL TAMAÑO DEL MERCADO DE SERVICIOS DE PETRÓLEO Y GAS DE LOS PAÍSES PRONÓSTICO, POR APLICACIÓN, 2019-2032 (MILES DE MILLONES DE USD)
    137. TABLA 134. ESTIMACIONES Y ESTIMACIONES DEL TAMAÑO DEL MERCADO DE SERVICIOS DE PETRÓLEO Y GAS DE LOS PAÍSES DEL CCG. PRONÓSTICO, POR MODO DE SERVICIO, 2019-2032 (MILES DE MILLONES DE USD)
    138. TABLA 135. ESTIMACIONES Y ESTIMACIONES DEL TAMAÑO DEL MERCADO DE SERVICIOS DE PETRÓLEO Y GAS DE LOS PAÍSES DEL CCG. PRONÓSTICO, POR TIPO DE CLIENTE, 2019-2032 (MILES DE MILLONES DE USD)
    139. TABLA 136. ESTIMACIONES Y ESTIMACIONES DEL TAMAÑO DEL MERCADO DE SERVICIOS DE PETRÓLEO Y GAS DE LOS PAÍSES DEL CCG. PRONÓSTICO, POR REGIONAL, 2019-2032 (MILES DE MILLONES DE USD)
    140. TABLA 137. ESTIMACIONES Y ESTIMACIONES DEL TAMAÑO DEL MERCADO DE SERVICIOS DE GAS Y PETRÓLEO UPSTREAM DE SUDÁFRICA. PRONÓSTICO, POR TIPO DE SERVICIO, 2019-2032 (MILES DE MILLONES DE USD)
    141. TABLA 138. ESTIMACIONES Y ESTIMACIONES DEL TAMAÑO DEL MERCADO DE SERVICIOS DE PETRÓLEO Y GAS EN SUDÁFRICA. PRONÓSTICO, POR APLICACIÓN, 2019-2032 (MILES DE MILLONES DE USD)
    142. TABLA 139. ESTIMACIONES Y ESTIMACIONES DEL TAMAÑO DEL MERCADO DE SERVICIOS DE PETRÓLEO Y GAS ARRIBA DE SUDÁFRICA. PRONÓSTICO, POR MODO DE SERVICIO, 2019-2032 (MILES DE MILLONES DE USD)
    143. TABLA 140. ESTIMACIONES Y ESTIMACIONES DEL TAMAÑO DEL MERCADO DE SERVICIOS DE PETRÓLEO Y GAS EN SUDÁFRICA. PRONÓSTICO, POR TIPO DE CLIENTE, 2019-2032 (MILES DE MILLONES DE USD)
    144. TABLA 141. ESTIMACIONES Y ESTIMACIONES DEL TAMAÑO DEL MERCADO DE SERVICIOS DE PETRÓLEO Y GAS EN SUDÁFRICA. PRONÓSTICO, POR REGIONAL, 2019-2032 (MILES DE MILLONES DE USD)
    145. TABLA 142. ESTIMACIONES Y ESTIMACIONES DEL TAMAÑO DEL MERCADO DE SERVICIOS DE PETRÓLEO Y GAS RESTO DE MEA UPSTREAM. PRONÓSTICO, POR TIPO DE SERVICIO, 2019-2032 (MILES DE MILLONES DE USD)
    146. TABLA 143. ESTIMACIONES Y ESTIMACIONES DEL TAMAÑO DEL MERCADO DE SERVICIOS DE PETRÓLEO Y GAS RESTO DE MEA UPSTREAM. PRONÓSTICO, POR APLICACIÓN, 2019-2032 (MILES DE MILLONES DE USD)
    147. TABLA 144. ESTIMACIONES Y ESTIMACIONES DEL TAMAÑO DEL MERCADO DE SERVICIOS DE PETRÓLEO Y GAS RESTO DE MEA UPSTREAM. PRONÓSTICO, POR MODO DE SERVICIO, 2019-2032 (MILES DE MILLONES DE USD)
    148. TABLA 145. ESTIMACIONES Y ESTIMACIONES DEL TAMAÑO DEL MERCADO DE SERVICIOS DE PETRÓLEO Y GAS RESTO DE MEA UPSTREAM. PRONÓSTICO, POR TIPO DE CLIENTE, 2019-2032 (MILES DE MILLONES DE USD)
    149. TABLA 146. ESTIMACIONES Y ESTIMACIONES DEL TAMAÑO DEL MERCADO DE SERVICIOS DE PETRÓLEO Y GAS RESTO DE MEA UPSTREAM. PRONÓSTICO, POR REGIONAL, 2019-2032 (MILES DE MILLONES DE USD)
    150. TABLA 147. LANZAMIENTO/DESARROLLO/APROBACIÓN DE PRODUCTOS
    151. TABLA 148. ADQUISICIÓN/ASOCIACIÓN
    152. LISTA DE CIFRAS
    153. FIGURA 1. SINOPSIS DEL MERCADO
    154. FIGURA 2. ANÁLISIS DEL MERCADO DE SERVICIOS DE PETRÓLEO Y GAS UPSTREAM EN AMÉRICA DEL NORTE
    155. FIGURA 3 . A NOSOTROS ANÁLISIS DEL MERCADO DE SERVICIOS DE PETRÓLEO Y GAS UPSTREAM POR TIPO DE SERVICIO
    156. FIGURA 4. ANÁLISIS DEL MERCADO DE SERVICIOS DE PETRÓLEO Y GAS UPSTREAM DE EE. UU. POR APLICACIÓN
    157. FIGURA 5. ANÁLISIS DEL MERCADO DE SERVICIOS DE PETRÓLEO Y GAS UPSTREAM DE EE. UU. POR MODO DE SERVICIO
    158. FIGURA 6. ANÁLISIS DEL MERCADO DE SERVICIOS DE PETRÓLEO Y GAS UPSTREAM DE EE. UU. POR CLIENTE TIPO
    159. FIGURA 7. ANÁLISIS DEL MERCADO DE SERVICIOS DE PETRÓLEO Y GAS UPSTREAM DE EE.UU. POR REGIONAL
    160. FIGURA 8. ANÁLISIS DEL MERCADO DE SERVICIOS DE PETRÓLEO Y GAS UPSTREAM DE CANADÁ POR TIPO DE SERVICIO
    161. FIGURA 9. MERCADO DE SERVICIOS DE PETRÓLEO Y GAS UPSTREAM DE CANADÁ POR TIPO DE SERVICIO ANÁLISIS POR APLICACIÓN
    162. FIGURA 10. CANADÁ ARRIBA ANÁLISIS DEL MERCADO DE SERVICIOS DE PETRÓLEO Y GAS POR MODO DE SERVICIO
    163. FIGURA 11. ANÁLISIS DEL MERCADO DE SERVICIOS DE PETRÓLEO Y GAS DE CANADÁ POR TIPO DE CLIENTE
    164. FIGURA 12. ANÁLISIS DEL MERCADO DE SERVICIOS DE PETRÓLEO Y GAS DE CANADÁ POR REGIONAL
    165. FIGURA 13 ANÁLISIS DEL MERCADO DE SERVICIOS DE PETRÓLEO Y GAS UPSTREAM EN EUROPA.
    166. FIGURA 14. ANÁLISIS DEL MERCADO DE SERVICIOS DE PETRÓLEO Y GAS DE ALEMANIA POR TIPO DE SERVICIO
    167. FIGURA 15. ANÁLISIS DEL MERCADO DE SERVICIOS DE PETRÓLEO Y GAS DE ALEMANIA POR APLICACIÓN
    168. FIGURA 16. ANÁLISIS DEL MERCADO DE SERVICIOS DE PETRÓLEO Y GAS DE ALEMANIA POR APLICACIÓN POR MODO DE SERVICIO
    169. FIGURA 17. ANÁLISIS DEL MERCADO DE SERVICIOS DE PETRÓLEO Y GAS DE ALEMANIA POR TIPO DE CLIENTE
    170. FIGURA 18. ANÁLISIS DEL MERCADO DE SERVICIOS DE PETRÓLEO Y DE GAS DE ALEMANIA POR REGIONAL
    171. FIGURA 19. ANÁLISIS DEL MERCADO DE SERVICIOS DE PETRÓLEO Y DE GAS DEL REINO UNIDO POR TIPO DE SERVICIO
    172. GRÁFICO 20. SERVICIOS DE PETRÓLEO Y GAS EN EL REINO UNIDO ANÁLISIS DE MERCADO POR APLICACIÓN
    173. FIGURA 21. ANÁLISIS DEL MERCADO DE SERVICIOS DE PETRÓLEO Y GAS UPSTREAM DEL REINO UNIDO POR MODO DE SERVICIO
    174. FIGURA 22. ANÁLISIS DEL MERCADO DE SERVICIOS DE PETRÓLEO Y GAS UPSTREAM DEL REINO UNIDO POR TIPO DE CLIENTE
    175. FIGURA 23. PETRÓLEO UPSTREAM DEL REINO UNIDO Y ANÁLISIS DEL MERCADO DE SERVICIOS DE GAS POR CIFRA REGIONAL
  14. 24 ANÁLISIS DEL MERCADO DE SERVICIOS DE PETRÓLEO Y GAS DE FRANCIA POR TIPO DE SERVICIO
    1. FIGURA 25. ANÁLISIS DEL MERCADO DE SERVICIOS DE PETRÓLEO Y DE GAS DE FRANCIA POR APLICACIÓN
    2. FIGURA 26. ANÁLISIS DEL MERCADO DE SERVICIOS DE PETRÓLEO Y DE GAS DE FRANCIA POR MODO DE SERVICIO
    3. GRÁFICO 27. SERVICIOS DE PETRÓLEO Y GAS UPSTREAM EN FRANCIA ANÁLISIS DE MERCADO POR TIPO DE CLIENTE
    4. FIGURA 28. FRANCIA ANÁLISIS DEL MERCADO DE SERVICIOS DE PETRÓLEO Y GAS UPSTREAM POR REGIONAL
    5. FIGURA 29. ANÁLISIS DEL MERCADO DE SERVICIOS DE PETRÓLEO Y GAS UPSTREAM DE RUSIA POR TIPO DE SERVICIO
    6. FIGURA 30. PETRÓLEO UPSTREAM DE RUSIA Y ANÁLISIS DEL MERCADO DE SERVICIOS DE GAS POR APLICACIÓN
    7. FIGURA 31. ANÁLISIS DEL MERCADO DE SERVICIOS DE PETRÓLEO Y GAS ARRIBA DE RUSIA POR MODO DE SERVICIO
    8. FIGURA 32. ANÁLISIS DEL MERCADO DE SERVICIOS DE PETRÓLEO Y GAS ARRIBA DE RUSIA POR TIPO DE CLIENTE
    9. FIGURA 33. SERVICIOS DE PETRÓLEO Y GAS ARRIBA DE RUSIA ANÁLISIS DE MERCADO POR REGIONALES
    10. GRÁFICO 34. ANÁLISIS DEL MERCADO DE SERVICIOS DE PETRÓLEO Y GAS DE ITALIA POR TIPO DE SERVICIO
    11. FIGURA 35. ANÁLISIS DEL MERCADO DE SERVICIOS DE PETRÓLEO Y DE GAS DE ITALIA POR APLICACIÓN
    12. FIGURA 36. ANÁLISIS DEL MERCADO DE SERVICIOS DE PETRÓLEO Y DE GAS DE ITALIA POR SERVICIO MODO
    13. FIGURA 37. ITALIA ANÁLISIS DEL MERCADO DE SERVICIOS DE PETRÓLEO Y GAS UPSTREAM POR TIPO DE CLIENTE
    14. FIGURA 38. ANÁLISIS DEL MERCADO DE SERVICIOS DE PETRÓLEO Y GAS UPSTREAM DE ITALIA POR REGIONAL
    15. FIGURA 39. ANÁLISIS DEL MERCADO DE SERVICIOS DE PETRÓLEO Y GAS UPSTREAM DE ESPAÑA POR TIPO DE SERVICIO
    16. FIGURA 40. SERVICIOS UPSTREAM DE PETRÓLEO Y GAS EN ESPAÑA ANÁLISIS DE MERCADO POR APLICACIÓN
    17. GRÁFICO 41. ANÁLISIS DEL MERCADO DE SERVICIOS DE PETRÓLEO Y GAS UPSTREAM DE ESPAÑA POR MODALIDAD DE SERVICIO
    18. FIGRÁFICO 42. ANÁLISIS DEL MERCADO DE SERVICIOS DE PETRÓLEO Y GAS UPSTREAM DE ESPAÑA POR TIPO DE CLIENTE
    19. FIGURA 43. PETRÓLEO UPSTREAM DE ESPAÑA Y ANÁLISIS DEL MERCADO DE SERVICIOS DE GAS POR REGIONALES
    20. />GRÁFICO 44. ANÁLISIS DEL MERCADO DE SERVICIOS DE PETRÓLEO Y GAS DEL RESTO DE EUROPA POR TIPO DE SERVICIO
    21. GRÁFICO 45. ANÁLISIS DEL MERCADO DE SERVICIOS DE PETRÓLEO Y GAS DEL RESTO DE EUROPA POR APLICACIÓN
    22. FIGURA 46. ANÁLISIS DEL MERCADO DE SERVICIOS DE PETRÓLEO Y GAS DEL RESTO DE EUROPA POR APLICACIÓN
    23. ANÁLISIS DEL MERCADO DE SERVICIOS DE GAS POR MODALIDAD DE SERVICIO
    24. FIGURA 47. ANÁLISIS DEL MERCADO DE SERVICIOS DE PETRÓLEO Y GAS DEL RESTO DE EUROPA POR TIPO DE CLIENTE
    25. FIGURA 48. ANÁLISIS DEL MERCADO DE SERVICIOS DE PETRÓLEO Y GAS DEL RESTO DE EUROPA POR REGIONAL
    26. FIGURA 49. ANÁLISIS DEL MERCADO DE SERVICIOS DE PETRÓLEO Y GAS DE APAC
    27. FIGURA 50. PETRÓLEO ARRIBA DE CHINA Y ANÁLISIS DEL MERCADO DE SERVICIOS DE GAS POR TIPO DE SERVICIO
    28. FIGURA 51. ANÁLISIS DEL MERCADO DE SERVICIOS DE PETRÓLEO Y GAS UPSTREAM DE CHINA POR APLICACIÓN
    29. FIGURA 52. ANÁLISIS DEL MERCADO DE SERVICIOS DE PETRÓLEO Y GAS UPSTREAM DE CHINA POR MODO DE SERVICIO
    30. FIGURA 53. CHINA ANÁLISIS DE MERCADO DE SERVICIOS DE PETRÓLEO Y GAS UPSTREAM POR CLIENTE TIPO
    31. GRÁFICO 54. ANÁLISIS DEL MERCADO DE SERVICIOS DE PETRÓLEO Y GAS UPSTREAM DE CHINA POR REGIONAL
    32. FIGURA 55. ANÁLISIS DEL MERCADO DE SERVICIOS DE PETRÓLEO Y GAS UPSTREAM DE INDIA POR TIPO DE SERVICIO
    33. FIGURA 56. MERCADO DE SERVICIOS DE PETRÓLEO Y GAS UPSTREAM DE INDIA POR TIPO DE SERVICIO ANÁLISIS POR APLICACIÓN
    34. FIGURA 57. ANÁLISIS DEL MERCADO DE SERVICIOS DE PETRÓLEO Y GAS DE INDIA POR MODO DE SERVICIO
    35. FIGURA 58. ANÁLISIS DEL MERCADO DE SERVICIOS DE PETRÓLEO Y DE GAS DE INDIA POR TIPO DE CLIENTE
    36. FIGURA 59. ANÁLISIS DEL MERCADO DE SERVICIOS DE PETRÓLEO Y DE GAS DE INDIA POR REGIONAL
    37. GRÁFICO 60. MERCADO DE SERVICIOS DE PETRÓLEO Y GAS UPSTREAM DE JAPÓN ANÁLISIS POR TIPO DE SERVICIO
    38. FIGURA 61. ANÁLISIS DEL MERCADO DE SERVICIOS DE PETRÓLEO Y GAS ARRIBA DE JAPÓN POR APLICACIÓN
    39. FIGURA 62. ANÁLISIS DEL MERCADO DE SERVICIOS DE PETRÓLEO Y GAS ARRIBA DE JAPÓN POR MODO DE SERVICIO
    40. FIGURA 63. PETRÓLEO Y GAS ARRIBA DE JAPÓN Y ANÁLISIS DEL MERCADO DE SERVICIOS DE GAS POR TIPO DE CLIENTE
    41. GRÁFICO 64. ANÁLISIS DEL MERCADO DE SERVICIOS DE PETRÓLEO Y GAS ARRIBA DE JAPÓN POR REGIONAL
    42. GRÁFICO 65. ANÁLISIS DEL MERCADO DE SERVICIOS DE PETRÓLEO Y GAS ARRIBA DE COREA DEL SUR POR TIPO DE SERVICIO
    43. FIGURA 66. ANÁLISIS DEL MERCADO DE SERVICIOS DE GAS Y PETRÓLEO ARRIBA DE COREA DEL SUR POR TIPO DE SERVICIO POR APLICACIÓN
    44. FIGURA 67. ANÁLISIS DEL MERCADO DE SERVICIOS DE PETRÓLEO Y GAS DE COREA DEL SUR POR MODO DE SERVICIO
    45. FIGURA 68. ANÁLISIS DEL MERCADO DE SERVICIOS DE PETRÓLEO Y GAS DE COREA DEL SUR POR TIPO DE CLIENTE
    46. FIGURA 69. ANÁLISIS DEL MERCADO DE SERVICIOS DE PETRÓLEO Y GAS DE COREA DEL SUR POR REGIONAL FIGURA 70. MALASIA ANÁLISIS DEL MERCADO DE SERVICIOS DE PETRÓLEO Y GAS UPSTREAM POR TIPO DE SERVICIO
    47. FIGURA 71. ANÁLISIS DEL MERCADO DE SERVICIOS DE PETRÓLEO Y GAS UPSTREAM DE MALASIA POR APLICACIÓN
    48. FIGURA 72. ANÁLISIS DEL MERCADO DE SERVICIOS DE PETRÓLEO Y GAS UPSTREAM DE MALASIA POR MODO DE SERVICIO
    49. FIGURA 73. SERVICIOS DE PETRÓLEO Y GAS UPSTREAM DE MALASIA ANÁLISIS DE MERCADO POR TIPO DE CLIENTE
    50. FIGURA 74. ANÁLISIS DEL MERCADO DE SERVICIOS DE PETRÓLEO Y GAS UPSTREAM DE MALASIA POR REGIONAL
    51. FIGURA 75. ANÁLISIS DEL MERCADO DE SERVICIOS DE PETRÓLEO Y GAS UPSTREAM DE TAILANDIA POR TIPO DE SERVICIO
    52. FIGURA 76. PETRÓLEO UPSTREAM DE TAILANDIA Y ANÁLISIS DEL MERCADO DE SERVICIOS DE GAS POR APLICACIÓN
    53. FIGURA 77. ANÁLISIS DEL MERCADO DE SERVICIOS DE PETRÓLEO Y GAS ARRIBA DE TAILANDIA POR MODO DE SERVICIO
    54. FIGURA 78. ANÁLISIS DEL MERCADO DE SERVICIOS DE PETRÓLEO Y GAS ARRIBA DE TAILANDIA POR TIPO DE CLIENTE
    55. FIGURA 79. SERVICIOS DE GAS Y PETRÓLEO ARRIBA DE TAILANDIA ANÁLISIS DE MERCADO POR CIFRA
    56. REGIONAL 80. ANÁLISIS DEL MERCADO DE SERVICIOS DE PETRÓLEO Y GAS DE INDONESIA POR TIPO DE SERVICIO
    57. FIGURA 81. ANÁLISIS DEL MERCADO DE SERVICIOS DE PETRÓLEO Y DE GAS DE INDONESIA POR APLICACIÓN
    58. FIGURA 82. ANÁLISIS DEL MERCADO DE SERVICIOS DE PETRÓLEO Y DE GAS DE INDONESIA POR MODO DE SERVICIO
    59. GRÁFICO 83. INDONESIA ANÁLISIS DEL MERCADO DE SERVICIOS DE PETRÓLEO Y GAS UPSTREAM POR TIPO DE CLIENTE
    60. FIGURA 84. ANÁLISIS DEL MERCADO DE SERVICIOS DE PETRÓLEO Y GAS UPSTREAM DE INDONESIA POR REGIONAL
    61. FIGURA 85. RESTO DE APAC ANÁLISIS DEL MERCADO DE SERVICIOS DE PETRÓLEO Y GAS UPSTREAM POR TIPO DE SERVICIO
    62. FIGURA 86. RESTO DEL PETRÓLEO APAC ARRIBA ANÁLISIS DEL MERCADO DE SERVICIOS DE PETRÓLEO Y GAS POR APLICACIÓN
    63. FIGURA 87. ANÁLISIS DEL MERCADO DE SERVICIOS DE PETRÓLEO Y GAS DEL RESTO DE APAC POR MODO DE SERVICIO
    64. FIGURA 88. ANÁLISIS DEL MERCADO DE SERVICIOS DE PETRÓLEO Y GAS DEL RESTO DE APAC POR TIPO DE CLIENTE
    65. GRÁFICO 89. RESTO DE SERVICIOS DE PETRÓLEO Y GAS UPSTREAM DE APAC ANÁLISIS DE MERCADO POR REGIONAL
    66. GRÁFICO 90. ANÁLISIS DEL MERCADO DE SERVICIOS DE PETRÓLEO Y GAS UPSTREAM DE SUDAMÉRICA
    67. GRÁFICO 91. ANÁLISIS DEL MERCADO DE SERVICIOS DE PETRÓLEO Y GAS UPSTREAM DE BRASIL POR TIPO DE SERVICIO
    68. FIGURA 92. PETRÓLEO Y GAS BRASIL UPSTREAM ANÁLISIS DEL MERCADO DE SERVICIOS POR APLICACIÓN
    69. GRÁFICO 93. ANÁLISIS DEL MERCADO DE SERVICIOS DE PETRÓLEO Y GAS UPSTREAM DE BRASIL POR MODO DE SERVICIO
    70. FIGURA 94. ANÁLISIS DEL MERCADO DE SERVICIOS DE PETRÓLEO Y GAS UPSTREAM DE BRASIL POR TIPO DE CLIENTE
    71. FIGURA 95. ANÁLISIS DEL MERCADO DE SERVICIOS DE PETRÓLEO Y GAS UPSTREAM DE BRASIL POR MODO DE SERVICIO REGIONAL
    72. GRÁFICO 96. MÉXICO ANÁLISIS DEL MERCADO DE SERVICIOS DE PETRÓLEO Y GAS UPSTREAM POR TIPO DE SERVICIO
    73. GRÁFICO 97. ANÁLISIS DEL MERCADO DE SERVICIOS DE PETRÓLEO Y GAS UPSTREAM DE MÉXICO POR APLICACIÓN
    74. FIGURA 98. ANÁLISIS DEL MERCADO DE SERVICIOS DE PETRÓLEO Y GAS UPSTREAM DE MÉXICO POR MODALIDAD DE SERVICIO
    75. FIGURA 99. MERCADO DE SERVICIOS DE PETRÓLEO Y GAS UPSTREAM DE MÉXICO ANÁLISIS POR TIPO DE CLIENTE
    76. GRÁFICO 100. ANÁLISIS DEL MERCADO DE SERVICIOS DE PETRÓLEO Y GAS UPSTREAM DE MÉXICO POR REGIONAL
    77. GRÁFICO 101. ANÁLISIS DEL MERCADO DE SERVICIOS DE PETRÓLEO Y GAS UPSTREAM DE ARGENTINA POR TIPO DE SERVICIO
    78. FIGURA 102. PETRÓLEO Y GAS UPSTREAM DE ARGENTINA ANÁLISIS DEL MERCADO DE SERVICIOS DE GAS POR APLICACIÓN
    79. FIGURA 103. ANÁLISIS DEL MERCADO DE SERVICIOS DE PETRÓLEO Y GAS UPSTREAM DE ARGENTINA POR MODO DE SERVICIO
    80. FIGURA 104. ANÁLISIS DEL MERCADO DE SERVICIOS DE PETRÓLEO Y GAS UPSTREAM DE ARGENTINA POR TIPO DE CLIENTE
    81. FIGURA 105. SERVICIOS DE PETRÓLEO Y GAS UPSTREAM DE ARGENTINA POR TIPO DE CLIENTE ANÁLISIS DE MERCADO POR REGIONALES
    82. GRÁFICO 106. RESTO DE SUR AMÉRICA ANÁLISIS DEL MERCADO DE SERVICIOS DE PETRÓLEO Y GAS UPSTREAM POR TIPO DE SERVICIO
    83. FIGURA 107. RESTO DE SUDAMÉRICA ANÁLISIS DEL MERCADO DE SERVICIOS DE PETRÓLEO Y GAS UPSTREAM POR APLICACIÓN
    84. FIGURA 108. RESTO DE SUR AMÉRICA MERCADO DE SERVICIOS DE PETRÓLEO Y GAS UPSTREAM ANÁLISIS POR MODALIDAD DE SERVICIO
    85. FIGURA 109. RESTO DE SUR AMÉRICA ANÁLISIS DEL MERCADO DE SERVICIOS DE PETRÓLEO Y GAS UPSTREAM POR TIPO DE CLIENTE
    86. FIGURA 110. RESTO DE SUDAMÉRICA ANÁLISIS DEL MERCADO DE SERVICIOS DE PETRÓLEO Y GAS UPSTREAM POR REGIONAL
    87. FIGURA 111. SERVICIOS DE PETRÓLEO Y GAS MEA UPSTREAM ANÁLISIS DE MERCADO
    88. FIGURA 112. PAÍSES DEL CCG ANÁLISIS DEL MERCADO DE SERVICIOS DE PETRÓLEO Y GAS UPSTREAM POR TIPO DE SERVICIO
    89. FIGURA 113. PAÍSES DEL CCG ANÁLISIS DEL MERCADO DE SERVICIOS DE PETRÓLEO Y GAS UPSTREAM POR APLICACIÓN
    90. FIGURA 114. PAÍSES DEL CCG PETRÓLEO UPSTREAM Y ANÁLISIS DE MERCADO DE SERVICIOS DE GAS POR SERVICE MODE
    91. FIGURA 115. ANÁLISIS DEL MERCADO DE SERVICIOS DE PETRÓLEO Y GAS DE LOS PAÍSES DEL CCG POR TIPO DE CLIENTE
    92. FIGURA 116. ANÁLISIS DEL MERCADO DE SERVICIOS DE PETRÓLEO Y DE GAS DE LOS PAÍSES DEL CCG POR REGIONAL
    93. FIGURA 117. PETRÓLEO DE SUDÁFRICA Y ANÁLISIS DEL MERCADO DE SERVICIOS DE GAS POR SERVICIO TIPO
    94. FIGURA 118. ANÁLISIS DEL MERCADO DE SERVICIOS DE PETRÓLEO Y GAS ARRIBA DE SUDÁFRICA POR APLICACIÓN
    95. FIGURA 119. ANÁLISIS DEL MERCADO DE SERVICIOS DE PETRÓLEO Y GAS ARRIBA DE SUDÁFRICA POR MODO DE SERVICIO
    96. FIGURA 120. PETRÓLEO Y GAS ARRIBA DE SUDÁFRICA Y ANÁLISIS DEL MERCADO DE SERVICIOS DE GAS POR TIPO DE CLIENTE
    97. GRÁFICO 121. ANÁLISIS DEL MERCADO DE SERVICIOS DE PETRÓLEO Y GAS ARRIBA DE SUDÁFRICA POR TIPO DE SERVICIO
    98. FIGURA 122. ANÁLISIS DEL MERCADO DE SERVICIOS DE PETRÓLEO Y GAS ARRIBA DEL RESTO DE MEA POR TIPO DE SERVICIO
    99. FIGURA 123. RESTO DE PETRÓLEO Y GAS ARRIBA DE MEA POR TIPO DE SERVICIO Y ANÁLISIS DEL MERCADO DE SERVICIOS DE GAS POR APLICACIÓN
    100. FIGURA 124. RESTO DE MEA ANÁLISIS DE MERCADO DE SERVICIOS DE PETRÓLEO Y GAS POR MODALIDAD DE SERVICIO
    101. FIGURA 125. RESTO DE MEA ANÁLISIS DE MERCADO DE SERVICIOS DE PETRÓLEO Y GAS POR TIPO DE CLIENTE
    102. FIGURA 126. RESTO DE MEA ANÁLISIS DE MERCADO DE SERVICIOS DE PETRÓLEO Y GAS POR MODALIDAD DE SERVICIO Y ANÁLISIS DEL MERCADO DE SERVICIOS DE GAS POR REGIONALES
    103. />FIGURA 127. CRITERIOS CLAVE DE COMPRA DEL MERCADO DE SERVICIOS DE PETRÓLEO Y GAS UPSTREAM
    104. FIGURA 128. PROCESO DE INVESTIGACIÓN DEL MRFR
    105. FIGURA 129. ANÁLISIS DRO DEL MERCADO DE SERVICIOS DE PETRÓLEO Y GAS UPSTREAM
    106. FIGURA 130. IMPULSORES ANÁLISIS DE IMPACTO: SERVICIOS DE PETRÓLEO Y GAS UPSTREAM MERCADO
    107. FIGURA 131. ANÁLISIS DE IMPACTO DE LAS RESTRICCIONES: MERCADO DE SERVICIOS DE PETRÓLEO Y GAS UPSTREAM
    108. FIGURA 132. CADENA DE SUMINISTRO / VALOR: MERCADO DE SERVICIOS DE PETRÓLEO Y GAS UPSTREAM
    109. FIGURA 133. MERCADO DE SERVICIOS DE PETRÓLEO Y GAS UPSTREAM, POR TIPO DE SERVICIO, 2024 (% PARTICIPACIÓN)
    110. FIGURA 134. MERCADO DE SERVICIOS DE PETRÓLEO Y GAS UPSTREAM, POR TIPO DE SERVICIO, 2019 A 2032 (Miles de millones de USD)
    111. FIGURA 135. MERCADO DE SERVICIOS DE PETRÓLEO Y GAS UPSTREAM, POR APLICACIÓN, 2024 (% DE PARTICIPACIÓN)
    112. FIGURA 136. MERCADO DE SERVICIOS DE PETRÓLEO Y GAS UPSTREAM, POR APLICACIÓN, 2019 A 2032 (Miles de millones de USD)
    113. GRÁFICO 137. MERCADO DE SERVICIOS DE PETRÓLEO Y GAS UPSTREAM, POR MODO DE SERVICIO, 2024 (% DE PARTICIPACIÓN)
    114. GRÁFICO 138. MERCADO DE SERVICIOS DE PETRÓLEO Y GAS UPSTREAM, POR MODO DE SERVICIO, DE 2019 A 2032 (Miles de millones de dólares)
    115. FIGURA 139. ARRIBA MERCADO DE SERVICIOS DE PETRÓLEO Y GAS, POR TIPO DE CLIENTE, 2024 (% DE PARTICIPACIÓN)
    116. FIGURA 140. MERCADO DE SERVICIOS DE PETRÓLEO Y GAS UPSTREAM, POR TIPO DE CLIENTE, 2019 A 2032 (Miles de millones de USD)
    117. FIGURA 141. PETRÓLEO Y GAS UPSTREAM MERCADO DE SERVICIOS DE GAS, POR REGIONAL, 2024 (% PARTICIPACIÓN)
    118. GRÁFICO 142. MERCADO DE SERVICIOS DE PETRÓLEO Y GAS UPSTREAM, POR REGIONAL, 2019 A 2032 (Miles de millones de USD)
    119. GRÁFICO 143. Evaluación comparativa de los principales competidores

Segmentación del mercado de servicios upstream de petróleo y gas


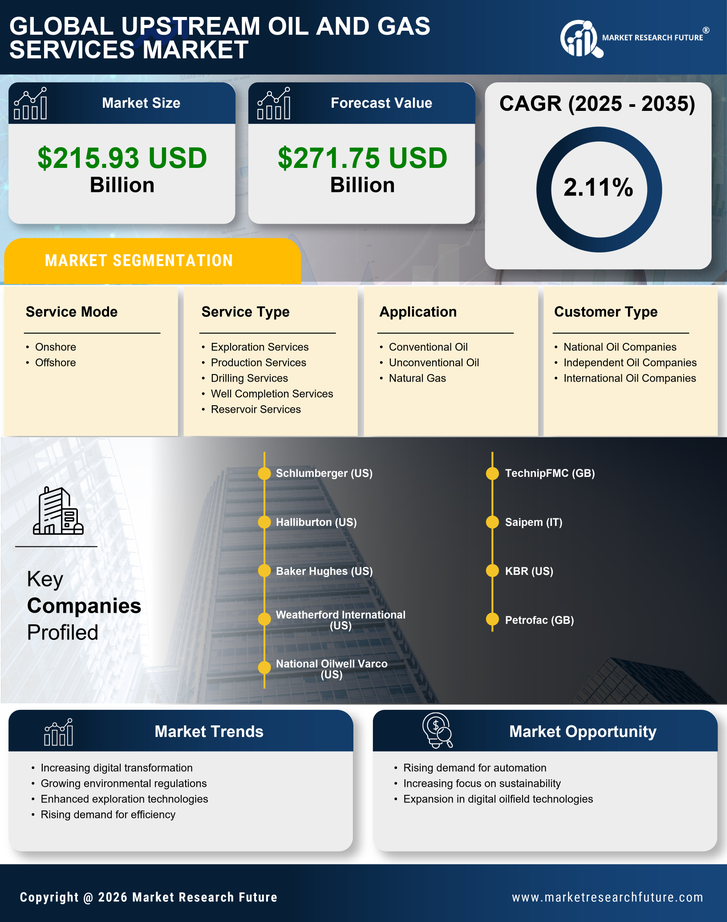
  • Mercado de servicios upstream de petróleo y gas por tipo de servicio (miles de millones de dólares, 2019-2032)
    • Servicios de exploración
    • Servicios de producción
    • Servicios de perforación
    • Servicios de terminación de pozos
    • Servicios de depósito


  • Mercado de servicios upstream de petróleo y gas por aplicación (miles de millones de dólares, 2019-2032)
    • Aceite convencional
    • Petróleo no convencional
    • Gas natural


  • Mercado de servicios upstream de petróleo y gas por modo de servicio (miles de millones de dólares, 2019-2032)
    • En tierra
    • Costa afuera


  • Mercado de servicios upstream de petróleo y gas por tipo de cliente (miles de millones de dólares, 2019-2032)
    • Compañías petroleras nacionales
    • Compañías petroleras independientes
    • Compañías petroleras internacionales


  • Mercado de servicios upstream de petróleo y gas por región (miles de millones de dólares, 2019-2032)
    • América del Norte
    • Europa
    • América del Sur
    • Asia Pacífico
    • Medio Oriente y África


Perspectivas regionales del mercado de servicios upstream de petróleo y gas (miles de millones de dólares, 2019-2032)


  • Perspectivas de América del Norte (miles de millones de dólares, 2019-2032)
    • Mercado de servicios upstream de petróleo y gas de América del Norte por tipo de servicio
      • Servicios de exploración
      • Servicios de producción
      • Servicios de perforación
      • Servicios de terminación de pozos
      • Servicios de depósito
    • Mercado de servicios upstream de petróleo y gas de América del Norte por tipo de aplicación
      • Aceite convencional
      • Petróleo no convencional
      • Gas natural
    • Mercado de servicios upstream de petróleo y gas de América del Norte por tipo de modo de servicio
      • En tierra
      • Costa afuera
    • Mercado de servicios upstream de petróleo y gas de América del Norte por tipo de cliente
      • Compañías petroleras nacionales
      • Compañías petroleras independientes
      • Compañías petroleras internacionales
    • Mercado de servicios upstream de petróleo y gas de América del Norte por tipo regional
      • EE.UU.
      • Canadá
    • Perspectivas de EE. UU. (miles de millones de dólares, 2019-2032)
    • Mercado de servicios upstream de petróleo y gas de EE. UU. por tipo de servicio
      • Servicios de exploración
      • Servicios de producción
      • Servicios de perforación
      • Servicios de terminación de pozos
      • Servicios de depósito
    • Mercado de servicios upstream de petróleo y gas de EE. UU. por tipo de aplicación
      • Aceite convencional
      • Petróleo no convencional
      • Gas natural
    • Mercado de servicios upstream de petróleo y gas de EE. UU. por tipo de modo de servicio
      • En tierra
      • Costa afuera
    • Mercado de servicios upstream de petróleo y gas de EE. UU. por tipo de cliente
      • Compañías petroleras nacionales
      • Compañías petroleras independientes
      • Compañías petroleras internacionales
    • Perspectivas de CANADÁ (miles de millones de dólares, 2019-2032)
    • Mercado de servicios upstream de petróleo y gas de CANADÁ por tipo de servicio
      • Servicios de exploración
      • Servicios de producción
      • Servicios de perforación
      • Servicios de terminación de pozos
      • Servicios de depósito
    • Mercado de servicios upstream de petróleo y gas de CANADÁ por tipo de aplicación
      • Aceite convencional
      • Petróleo no convencional
      • Gas natural
    • Mercado de servicios upstream de petróleo y gas de CANADÁ por tipo de modo de servicio
      • En tierra
      • Costa afuera
    • Mercado de servicios upstream de petróleo y gas de CANADÁ por tipo de cliente
      • Compañías petroleras nacionales
      • Compañías petroleras independientes
      • Compañías petroleras internacionales
    • Perspectivas de Europa (miles de millones de dólares, 2019-2032)
      • Mercado europeo de servicios upstream de petróleo y gas por tipo de servicio
        • Servicios de exploración
        • Servicios de producción
        • Servicios de perforación
        • Servicios de terminación de pozos
        • Servicios de depósito
      • Mercado europeo de servicios upstream de petróleo y gas por tipo de aplicación
        • Aceite convencional
        • Petróleo no convencional
        • Gas natural
      • Mercado europeo de servicios upstream de petróleo y gas por tipo de modo de servicio
        • En tierra
        • Costa afuera
      • Mercado europeo de servicios upstream de petróleo y gas por tipo de cliente
        • Compañías petroleras nacionales
        • Compañías petroleras independientes
        • Compañías petroleras internacionales
      • Mercado europeo de servicios upstream de petróleo y gas por tipo regional
        • Alemania
        • Reino Unido
        • Francia
        • Rusia
        • Italia
        • España
        • Resto de Europa
      • Perspectivas de ALEMANIA (miles de millones de dólares, 2019-2032)
      • Mercado de servicios upstream de petróleo y gas de ALEMANIA por tipo de servicio
        • Servicios de exploración
        • Servicios de producción
        • Servicios de perforación
        • Servicios de terminación de pozos
        • Servicios de depósito
      • Mercado de servicios upstream de petróleo y gas de ALEMANIA por tipo de aplicación
        • Aceite convencional
        • Petróleo no convencional
        • Gas natural
      • Mercado de servicios upstream de petróleo y gas de ALEMANIA por tipo de modo de servicio
        • En tierra
        • Costa afuera
      • Mercado de servicios upstream de petróleo y gas de ALEMANIA por tipo de cliente
        • Compañías petroleras nacionales
        • Compañías petroleras independientes
        • Compañías petroleras internacionales
      • Perspectivas del Reino Unido (miles de millones de dólares, 2019-2032)
      • Mercado de servicios upstream de petróleo y gas del Reino Unido por tipo de servicio
        • Servicios de exploración
        • Servicios de producción
        • Servicios de perforación
        • Servicios de terminación de pozos
        • Servicios de depósito
      • Mercado de servicios upstream de petróleo y gas del Reino Unido por tipo de aplicación
        • Aceite convencional
        • Petróleo no convencional
        • Gas natural
      • Mercado de servicios upstream de petróleo y gas del Reino Unido por tipo de modo de servicio
        • En tierra
        • Costa afuera
      • Mercado de servicios upstream de petróleo y gas del Reino Unido por tipo de cliente
        • Compañías petroleras nacionales
        • Compañías petroleras independientes
        • Compañías petroleras internacionales
      • Perspectivas de FRANCIA (miles de millones de dólares, 2019-2032)
      • Mercado de servicios de petróleo y gas upstream de FRANCIA por tipo de servicio
        • Servicios de exploración
        • Servicios de producción
        • Servicios de perforación
        • Servicios de terminación de pozos
        • Servicios de depósito
      • Mercado de servicios upstream de petróleo y gas de FRANCIA por tipo de aplicación
        • Aceite convencional
        • Petróleo no convencional
        • Gas natural
      • Mercado de servicios de petróleo y gas upstream de FRANCIA por tipo de modo de servicio
        • En tierra
        • Costa afuera
      • Mercado de servicios upstream de petróleo y gas de Francia por tipo de cliente
        • Compañías petroleras nacionales
        • Compañías petroleras independientes
        • Compañías petroleras internacionales
      • Perspectivas de RUSIA (miles de millones de dólares, 2019-2032)
      • Mercado de servicios upstream de petróleo y gas de Rusia por tipo de servicio
        • Servicios de exploración
        • Servicios de producción
        • Servicios de perforación
        • Servicios de terminación de pozos
        • Servicios de depósito
      • Mercado de servicios upstream de petróleo y gas de Rusia por tipo de aplicación
        • Aceite convencional
        • Petróleo no convencional
        • Gas natural
      • Mercado de servicios upstream de petróleo y gas de Rusia por tipo de modo de servicio
        • En tierra
        • Costa afuera
      • Mercado de servicios upstream de petróleo y gas de Rusia por tipo de cliente
        • Compañías petroleras nacionales
        • Compañías petroleras independientes
        • Compañías petroleras internacionales
      • Perspectivas de ITALIA (miles de millones de dólares, 2019-2032)
      • Mercado de servicios upstream de petróleo y gas de ITALIA por tipo de servicio
        • Servicios de exploración
        • Servicios de producción
        • Servicios de perforación
        • Servicios de terminación de pozos
        • Servicios de depósito
      • Mercado de servicios upstream de petróleo y gas de ITALIA por tipo de aplicación
        • Aceite convencional
        • Petróleo no convencional
        • Gas natural
      • Mercado de servicios upstream de petróleo y gas de ITALIA por tipo de modo de servicio
        • En tierra
        • Costa afuera
      • Mercado de servicios upstream de petróleo y gas de ITALIA por tipo de cliente
        • Compañías petroleras nacionales
        • Compañías petroleras independientes
        • Compañías petroleras internacionales
      • Perspectivas de ESPAÑA (miles de millones de dólares, 2019-2032)
      • Mercado de servicios upstream de petróleo y gas en España por tipo de servicio
        • Servicios de exploración
        • Servicios de producción
        • Servicios de perforación
        • Servicios de terminación de pozos
        • Servicios de depósito
      • Mercado de servicios upstream de petróleo y gas en España por tipo de aplicación
        • Aceite convencional
        • Petróleo no convencional
        • Gas natural
      • Mercado de servicios upstream de petróleo y gas en España por tipo de modo de servicio
        • En tierra
        • Costa afuera
      • Mercado de servicios upstream de petróleo y gas en España por tipo de cliente
        • Compañías petroleras nacionales
        • Compañías petroleras independientes
        • Compañías petroleras internacionales
      • Perspectivas DEL RESTO DE EUROPA (Miles de millones de dólares, 2019-2032)
      • RESTO DE EUROPA Mercado de servicios upstream de petróleo y gas por tipo de servicio
        • Servicios de exploración
        • Servicios de producción
        • Servicios de perforación
        • Servicios de terminación de pozos
        • Servicios de depósito
      • RESTO DE EUROPA Mercado de servicios upstream de petróleo y gas por tipo de aplicación
        • Aceite convencional
        • Petróleo no convencional
        • Gas natural
      • RESTO DE EUROPA Mercado de servicios upstream de petróleo y gas por tipo de modo de servicio
        • En tierra
        • Costa afuera
      • RESTO DE EUROPA Mercado de servicios upstream de petróleo y gas por tipo de cliente
        • Compañías petroleras nacionales
        • Compañías petroleras independientes
        • Compañías petroleras internacionales
      • Perspectivas de Asia Pacífico (miles de millones de dólares, 2019-2032)
        • Mercado de servicios de petróleo y gas upstream de APAC por tipo de servicio
          • Servicios de exploración
          • Servicios de producción
          • Servicios de perforación
          • Servicios de terminación de pozos
          • Servicios de depósito
        • Mercado de servicios de petróleo y gas upstream de APAC por tipo de aplicación
          • Aceite convencional
          • Petróleo no convencional
          • Gas natural
        • Mercado de servicios de petróleo y gas upstream de APAC por tipo de modo de servicio
          • En tierra
          • Costa afuera
        • Mercado de servicios upstream de petróleo y gas de APAC por tipo de cliente
          • Compañías petroleras nacionales
          • Compañías petroleras independientes
          • Compañías petroleras internacionales
        • Mercado de servicios de petróleo y gas upstream de APAC por tipo regional
          • China
          • India
          • Japón
          • Corea del Sur
          • Malasia
          • Tailandia
          • Indonesia
          • Resto de APAC
        • Perspectivas de CHINA (miles de millones de dólares, 2019-2032)
        • Mercado de servicios upstream de petróleo y gas de CHINA por tipo de servicio
          • Servicios de exploración
          • Servicios de producción
          • Servicios de perforación
          • Servicios de terminación de pozos
          • Servicios de depósito
        • Mercado de servicios upstream de petróleo y gas de CHINA por tipo de aplicación
          • Aceite convencional
          • Petróleo no convencional
          • Gas natural
        • Mercado de servicios upstream de petróleo y gas de CHINA por tipo de modo de servicio
          • En tierra
          • Costa afuera
        • Mercado de servicios upstream de petróleo y gas de CHINA por tipo de cliente
          • Compañías Petroleras Nacionales
          • Compañías petroleras independientes
          • Compañías petroleras internacionales
        • Perspectivas de la INDIA (miles de millones de dólares, 2019-2032)
        • Mercado de servicios upstream de petróleo y gas de INDIA por tipo de servicio
          • Servicios de exploración
          • Servicios de producción
          • Servicios de perforación
          • Servicios de terminación de pozos
          • Servicios de depósito
        • Mercado de servicios upstream de petróleo y gas de INDIA por tipo de aplicación
          • Aceite convencional
          • Petróleo no convencional
          • Gas natural
        • Mercado de servicios upstream de petróleo y gas de INDIA por tipo de modo de servicio
          • En tierra
          • Costa afuera
        • Mercado de servicios upstream de petróleo y gas de INDIA por tipo de cliente
          • Compañías petroleras nacionales
          • Compañías petroleras independientes
          • Compañías petroleras internacionales
        • Perspectivas de JAPÓN (miles de millones de dólares, 2019-2032)
        • Mercado de servicios upstream de petróleo y gas de Japón por tipo de servicio
          • Servicios de exploración
          • Servicios de producción
          • Servicios de perforación
          • Servicios de terminación de pozos
          • Servicios de depósito
        • Mercado de servicios upstream de petróleo y gas de Japón por tipo de aplicación
          • Aceite convencional
          • Petróleo no convencional
          • Gas natural
        • Mercado de servicios upstream de petróleo y gas de Japón por tipo de modo de servicio
          • En tierra
          • Costa afuera
        • Mercado de servicios upstream de petróleo y gas de Japón por tipo de cliente
          • Compañías petroleras nacionales
          • Compañías petroleras independientes
          • Compañías petroleras internacionales
        • Perspectivas de COREA DEL SUR (miles de millones de dólares, 2019-2032)
        • Mercado de servicios upstream de petróleo y gas de COREA DEL SUR por tipo de servicio
          • Servicios de exploración
          • Servicios de producción
          • Servicios de perforación
          • Servicios de terminación de pozos
          • Servicios de depósito
        • Mercado de servicios upstream de petróleo y gas de COREA DEL SUR por tipo de aplicación
          • Aceite convencional
          • Petróleo no convencional
          • Gas natural
        • Mercado de servicios upstream de petróleo y gas de COREA DEL SUR por tipo de modo de servicio
          • En tierra
          • Costa afuera
        • Mercado de servicios upstream de petróleo y gas de COREA DEL SUR por tipo de cliente
          • Compañías petroleras nacionales
          • Compañías petroleras independientes
          • Compañías petroleras internacionales
        • Perspectivas de MALASIA (miles de millones de dólares, 2019-2032)
        • Mercado de servicios upstream de petróleo y gas de MALASIA por tipo de servicio
          • Servicios de exploración
          • Servicios de producción
          • Servicios de perforación
          • Servicios de terminación de pozos
          • Servicios de depósito
        • Mercado de servicios upstream de petróleo y gas de MALASIA por tipo de aplicación
          • Aceite convencional
          • Petróleo no convencional
          • Gas natural
        • Mercado de servicios upstream de petróleo y gas de MALASIA por tipo de modo de servicio
          • En tierra
          • Costa afuera
        • Mercado de servicios upstream de petróleo y gas de MALASIA por tipo de cliente
          • Compañías petroleras nacionales
          • Compañías petroleras independientes
          • Compañías petroleras internacionales
        • Perspectivas de TAILANDIA (miles de millones de dólares, 2019-2032)
        • Mercado de servicios upstream de petróleo y gas de TAILANDIA por tipo de servicio
          • Servicios de exploración
          • Servicios de producción
          • Servicios de perforación
          • Servicios de terminación de pozos
          • Servicios de depósito
        • Mercado de servicios upstream de petróleo y gas de TAILANDIA por tipo de aplicación
          • Aceite convencional
          • Petróleo no convencional
          • Gas natural
        • Mercado de servicios upstream de petróleo y gas de TAILANDIA por tipo de modo de servicio
          • En tierra
          • Costa afuera
        • Mercado de servicios upstream de petróleo y gas de TAILANDIA por tipo de cliente
          • Compañías petroleras nacionales
          • Compañías petroleras independientes
          • Compañías petroleras internacionales
        • Perspectivas de INDONESIA (miles de millones de dólares, 2019-2032)
        • Mercado de servicios upstream de petróleo y gas de INDONESIA por tipo de servicio
          • Servicios de exploración
          • Servicios de producción
          • Servicios de perforación
          • Servicios de terminación de pozos
          • Servicios de depósito
        • Mercado de servicios upstream de petróleo y gas de INDONESIA por tipo de aplicación
          • Aceite convencional
          • Petróleo no convencional
          • Gas natural
        • Mercado de servicios upstream de petróleo y gas de INDONESIA por tipo de modo de servicio
          • En tierra
          • Costa afuera
        • Mercado de servicios upstream de petróleo y gas de INDONESIA por tipo de cliente
          • Compañías petroleras nacionales
          • Compañías petroleras independientes
          • Compañías petroleras internacionales
        • Perspectivas del RESTO DE APAC (miles de millones de dólares, 2019-2032)
        • RESTO DEL Mercado de Servicios Upstream de Petróleo y Gas de APAC por tipo de servicio
          • Servicios de exploración
          • Servicios de producción
          • Servicios de perforación
          • Servicios de terminación de pozos
          • Servicios de depósito
        • RESTO DEL Mercado de Servicios Upstream de Petróleo y Gas de APAC por tipo de aplicación
          • Aceite convencional
          • Petróleo no convencional
          • Gas natural
        • RESTO DEL Mercado de Servicios Upstream de Petróleo y Gas de APAC por tipo de modo de servicio
          • En tierra
          • Costa afuera
        • RESTO DEL Mercado de Servicios Upstream de Petróleo y Gas de APAC por tipo de cliente
          • Compañías petroleras nacionales
          • Compañías petroleras independientes
          • Compañías petroleras internacionales
        • Perspectivas de América del Sur (miles de millones de dólares, 2019-2032)
          • Mercado de servicios upstream de petróleo y gas de América del Sur por tipo de servicio
            • Servicios de exploración
            • Servicios de producción
            • Servicios de perforación
            • Servicios de terminación de pozos
            • Servicios de depósito
          • Mercado de servicios upstream de petróleo y gas de América del Sur por tipo de aplicación
            • Aceite convencional
            • Petróleo no convencional
            • Gas natural
          • Mercado de servicios upstream de petróleo y gas de América del Sur por tipo de modo de servicio
            • En tierra
            • Costa afuera
          • Mercado de servicios upstream de petróleo y gas de América del Sur por tipo de cliente
            • Compañías petroleras nacionales
            • Compañías petroleras independientes
            • Compañías petroleras internacionales
          • Mercado de servicios upstream de petróleo y gas de América del Sur por tipo regional
            • Brasil
            • México
            • Argentina
            • Resto de Sudamérica
          • Perspectivas de BRASIL (miles de millones de dólares, 2019-2032)
          • Mercado de servicios upstream de petróleo y gas de BRASIL por tipo de servicio
            • Servicios de exploración
            • Servicios de producción
            • Servicios de perforación
            • Servicios de terminación de pozos
            • Servicios de depósito
          • Mercado de servicios upstream de petróleo y gas de BRASIL por tipo de aplicación
            • Aceite convencional
            • Petróleo no convencional
            • Gas natural
          • Mercado de servicios upstream de petróleo y gas de BRASIL por tipo de modo de servicio
            • En tierra
            • Costa afuera
          • Mercado de servicios upstream de petróleo y gas de BRASIL por tipo de cliente
            • Compañías petroleras nacionales
            • Compañías petroleras independientes
            • Compañías petroleras internacionales
          • Perspectivas de MÉXICO (Miles de millones de dólares, 2019-2032)
          • Mercado de Servicios Upstream de Petróleo y Gas en MÉXICO por tipo de servicio
            • Servicios de exploración
            • Servicios de producción
            • Servicios de perforación
            • Servicios de terminación de pozos
            • Servicios de depósito
          • Mercado de Servicios Upstream de Petróleo y Gas en MÉXICO por tipo de aplicación
            • Aceite convencional
            • Petróleo no convencional
            • Gas natural
          • Mercado de Servicios Upstream de Petróleo y Gas en MÉXICO por tipo de modo de servicio
            • En tierra
            • Costa afuera
          • Mercado de Servicios Upstream de Petróleo y Gas en MÉXICO por tipo de cliente
            • Compañías petroleras nacionales
            • Compañías petroleras independientes
            • Compañías petroleras internacionales
          • Perspectivas de ARGENTINA (miles de millones de dólares, 2019-2032)
          • Mercado de servicios upstream de petróleo y gas en ARGENTINA por tipo de servicio
            • Servicios de exploración
            • Servicios de producción
            • Servicios de perforación
            • Servicios de terminación de pozos
            • Servicios de depósito
          • Mercado de servicios upstream de petróleo y gas en ARGENTINA por tipo de aplicación
            • Aceite convencional
            • Petróleo no convencional
            • Gas natural
          • Mercado de servicios upstream de petróleo y gas en ARGENTINA por tipo de modo de servicio
            • En tierra
            • Costa afuera
          • Mercado de servicios upstream de petróleo y gas en ARGENTINA por tipo de cliente
            • Compañías petroleras nacionales
            • Compañías petroleras independientes
            • Compañías petroleras internacionales
          • Perspectivas DEL RESTO DE AMÉRICA DEL SUR (Miles de millones de dólares, 2019-2032)
          • RESTO DE AMÉRICA DEL SUR Mercado de servicios upstream de petróleo y gas por tipo de servicio
            • Servicios de exploración
            • Servicios de producción
            • Servicios de perforación
            • Servicios de terminación de pozos
            • Servicios de depósito
          • RESTO DE AMÉRICA DEL SUR Mercado de servicios upstream de petróleo y gas por tipo de aplicación
            • Aceite convencional
            • Petróleo no convencional
            • Gas natural
          • RESTO DE AMÉRICA DEL SUR Mercado de servicios upstream de petróleo y gas por tipo de modo de servicio
            • En tierra
            • Costa afuera
          • RESTO DE AMÉRICA DEL SUR Mercado de servicios upstream de petróleo y gas por tipo de cliente
            • Compañías petroleras nacionales
            • Compañías petroleras independientes
            • Compañías petroleras internacionales
          • Perspectivas de los MEA (miles de millones de dólares, 2019-2032)
            • Mercado de servicios de petróleo y gas upstream de MEA por tipo de servicio
              • Servicios de exploración
              • Servicios de producción
              • Servicios de perforación
              • Servicios de terminación de pozos
              • Servicios de depósito
            • Mercado de servicios upstream de petróleo y gas de MEA por tipo de aplicación
              • Aceite convencional
              • Petróleo no convencional
              • Gas natural
            • Mercado de servicios upstream de petróleo y gas de MEA por tipo de modo de servicio
              • En tierra
              • Costa afuera
            • Mercado de servicios upstream de petróleo y gas de MEA por tipo de cliente
              • Compañías petroleras nacionales
              • Compañías petroleras independientes
              • Compañías petroleras internacionales
            • Mercado de servicios upstream de petróleo y gas de MEA por tipo regional
              • Países del CCG
              • Sudáfrica
              • Resto de MEA
            • Perspectivas de los PAÍSES del CCG (miles de millones de dólares, 2019-2032)
            • Países del CCG Mercado de servicios upstream de petróleo y gas por tipo de servicio
              • Servicios de exploración
              • Servicios de producción
              • Servicios de perforación
              • Servicios de terminación de pozos
              • Servicios de depósito
            • Países del CCG Mercado de servicios upstream de petróleo y gas por tipo de aplicación
              • Aceite convencional
              • Petróleo no convencional
              • Gas natural
            • Países del CCG Mercado de servicios upstream de petróleo y gas por tipo de modo de servicio
              • En tierra
              • Costa afuera
            • Países del CCG Mercado de servicios upstream de petróleo y gas por tipo de cliente
              • Compañías petroleras nacionales
              • Compañías petroleras independientes
              • Compañías petroleras internacionales
            • Perspectivas de SUDÁFRICA (miles de millones de dólares, 2019-2032)
            • Mercado de servicios upstream de petróleo y gas de SUDÁFRICA por tipo de servicio
              • Servicios de exploración
              • Servicios de producción
              • Servicios de perforación
              • Servicios de terminación de pozos
              • Servicios de depósito
            • Mercado de servicios upstream de petróleo y gas de SUDÁFRICA por tipo de aplicación
              • Aceite convencional
              • Petróleo no convencional
              • Gas natural
            • SUDÁFRICA Upstream OiMercado de servicios de l y gas por tipo de modo de servicio
              • En tierra
              • Costa afuera
            • Mercado de servicios upstream de petróleo y gas de SUDÁFRICA por tipo de cliente
              • Compañías petroleras nacionales
              • Compañías petroleras independientes
              • Compañías petroleras internacionales
            • Perspectivas del RESTO DE MEA (miles de millones de dólares, 2019-2032)
            • RESTO DEL Mercado de Servicios Upstream de Petróleo y Gas de MEA por tipo de servicio
              • Servicios de exploración
              • Servicios de producción
              • Servicios de perforación
              • Servicios de terminación de pozos
              • Servicios de depósito
            • RESTO DEL MEA Mercado de servicios de petróleo y gas upstream por tipo de aplicación
              • Aceite convencional
              • Petróleo no convencional
              • Gas natural
            • RESTO DEL Mercado de Servicios Upstream de Petróleo y Gas de MEA por tipo de modo de servicio
              • En tierra
              • Costa afuera
            • RESTO DEL Mercado de Servicios Upstream de Petróleo y Gas de MEA por tipo de cliente
              • Compañías petroleras nacionales
              • Compañías petroleras independientes
              • Compañías petroleras internacionales

Compare Licence

×
Features License Type
Single User Multiuser License Enterprise User
Price $4,950 $5,950 $7,250
Maximum User Access Limit 1 User Upto 10 Users Unrestricted Access Throughout the Organization
Free Customization
Direct Access to Analyst
Deliverable Format
Platform Access
Discount on Next Purchase 10% 15% 15%
Printable Versions