Test Management Software Market

ID: MRFR/ICT/9126-HCR 90 Pages Ankit Gupta Last Updated: October 22, 2026
Informe de investigación del mercado de software de gestión de pruebas: Información, por implementación (local y en la nube), por precios (mensual, anual y licencia única), por tamaño de organización (PYMES y grandes empresas), por vertical (BFSI, TI y telecomunicaciones, manufactura, energía y servicios públicos, atención médica y ciencias de la vida, educación, aeroespacial y defensa, y otros), y por región (América del Norte, Europa, Asia-Pacífico y resto del mundo) – Pronóstico del mercado hasta 2035.
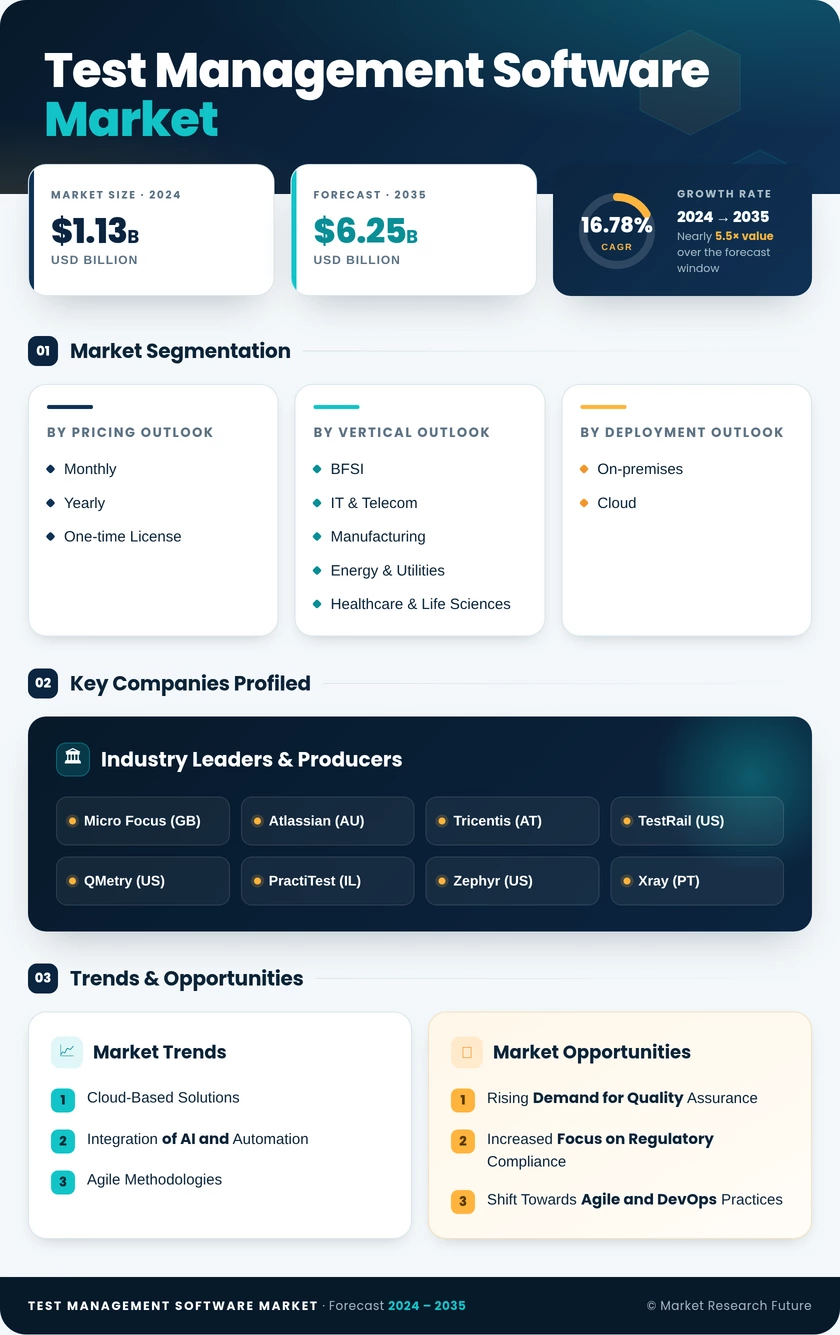
Test Management Software Market
Market Size
Forecast Period2025 - 2035
CAGR (2025 - 2035)16.78%
2024 Market Size$ 1.13 Billion
2025 Market Size$ 1.32 Billion
2035 Market Size$ 6.25 Billion
Key Players
Micro Focus
Atlassian
Tricentis
TestRail
QMetry
PractiTest
Opportunities
  • Rising Demand for Quality Assurance
  • Increased Focus on Regulatory Compliance
  • Shift Towards Agile and DevOps Practices
  1. 1 RESUMEN EJECUTIVO
    1. 1.1 Análisis del atractivo del mercado
      1. 1.1.1 Mercado global de software de gestión de pruebas, por implementación
      2. 1.1.2 Mercado global de software de gestión de pruebas, por precios
      3. 1.1.3 Mercado global de software de gestión de pruebas, por tamaño de organización
      4. 1.1.4 Mercado global de software de gestión de pruebas, por sector vertical
      5. 1.1.5 Mercado global de software de gestión de pruebas, por región
  2. 2 INTRODUCCIÓN AL MERCADO
    1. 2.1 Definición
    2. 2.2 Alcance del estudio
    3. 2.3 Estructura del mercado
  3. 3 METODOLOGÍA DE LA INVESTIGACIÓN
    1. 3.1 Proceso de investigación
    2. 3.2 Investigación primaria
    3. 3.3 Investigación secundaria
    4. 3.4 Estimación del tamaño del mercado
    5. 3.5 Lista de supuestos
  4. 4 DINÁMICA DEL MERCADO
    1. 4.1 Introducción
    2. 4.2 Factores impulsores
      1. 4.2.1 El rápido crecimiento de la industria del software ha generado una mayor demanda de pruebas de software
      2. 4.2.2 Creciente importancia del software de gestión de pruebas en las organizaciones para mejorar la comunicación entre desarrolladores y testers
    3. 4.3 Restricción
      1. 4.3.1 Disponibilidad de herramientas de código abierto
    4. 4.4 Oportunidad
      1. 4.4.1 Aumento de las implementaciones en la nube
      2. 4.4.2 Integración de herramientas de gestión de pruebas con pruebas de software, detección de errores y otras plataformas
      3. 4.4.3 Demanda emergente de Asia-Pacífico
    5. 4.5 Desafío
      1. 4.5.1 Baja adopción en países subdesarrollados
    6. 4.6 Impacto de la COVID-19
      1. 4.6.1 Impacto en el sector de TI
      2. 4.6.2 Impacto en el desarrollo de software
      3. 4.6.3 Impacto en la adopción de herramientas de gestión de pruebas
      4. 4.6.4 Impacto en las economías
      5. 4.6.5 Impacto en el modelo de implementación
      6. 4.6.6 Crecimiento interanual por región y país
  5. 5 ANÁLISIS DE FACTORES DE MERCADO
    1. 5.1 Análisis de la cadena de valor/análisis de la cadena de suministro
    2. 5.2 Modelo de las cinco fuerzas de Porter
      1. 5.2.1 Poder de negociación de los proveedores
      2. 5.2.2 Poder de negociación de los compradores
      3. 5.2.3 Amenaza de nuevos participantes
      4. 5.2.4 Amenaza de sustitutos
      5. 5.2.5 Intensidad de la rivalidad
  6. 6 MERCADO GLOBALTEST DE SOFTWARE DE GESTIÓN, POR IMPLEMENTACIÓN
    1. 6.1 Introducción
    2. 6.2 Local
    3. 6.3 En la nube
  7. 7 MERCADO GLOBAL DE SOFTWARE DE GESTIÓN DE PRUEBAS, POR PRECIOS
    1. 7.1 Introducción
    2. 7.2 Mensual
    3. 7.3 Anual
    4. 7.4 Licencia única
  8. 8 MERCADO GLOBAL DE SOFTWARE DE GESTIÓN DE PRUEBAS, POR TAMAÑO DE LA ORGANIZACIÓN
    1. 8.1 Introducción
    2. 8.2 Pequeñas y grandes empresas
    3. 8.3 Grandes empresas
  9. 9 MERCADO GLOBAL DE SOFTWARE DE GESTIÓN DE PRUEBAS, POR VERTICAL
    1. 9.1 Introducción
    2. 9.2 BFSI
    3. 9.3 TI y telecomunicaciones
    4. 9.4 Manufactura
    5. 9.5 Energía y servicios públicos
    6. 9.6 Salud y ciencias de la vida
    7. 9.7 Educación
    8. 9.8 Aeroespacial y Defensa
    9. 9.9 Otros
  10. 10 MERCADO GLOBALTEST DE SOFTWARE DE GESTIÓN, POR REGIÓN
    1. 10.1 Resumen
    2. 10.2 Norteamérica
      1. 10.2.1 Tamaño del mercado y estimaciones, por país, 2023-2032
      2. 10.2.2 Tamaño del mercado y estimaciones, por implementación, 2023-2032
      3. 10.2.3 Tamaño del mercado y estimaciones, por precio, 2023-2032
      4. 10.2.4 Tamaño del mercado y estimaciones, por tamaño de la organización, 2023-2032
      5. 10.2.5 Tamaño del mercado y estimaciones, por sector industrial, 2023-2032
      6. 10.2.6 EE. UU.
        1. 10.2.6.1 Tamaño del mercado y Estimaciones por implementación, 2023-2032
        2. 10.2.6.2 Tamaño del mercado y estimaciones por precio, 2023-2032
        3. 10.2.6.3 Tamaño del mercado y estimaciones por tamaño de la organización, 2023-2032
        4. 10.2.6.4 Tamaño del mercado y estimaciones por sector industrial, 2023-2032
      7. 10.2.7 Canadá
        1. 10.2.7.1 Tamaño del mercado y estimaciones por implementación, 2023-2032
        2. 10.2.7.2 Tamaño del mercado y estimaciones por precio, 2023-2032
        3. 10.2.7.3 Tamaño del mercado y estimaciones por tamaño de la organización, 2023-2032
        4. 10.2.7.4 Tamaño del mercado y estimaciones, por sector industrial, 2023-2032
      8. 10.2.8 México
        1. 10.2.8.1 Tamaño del mercado y estimaciones, por implementación, 2023-2032
        2. 10.2.8.2 Tamaño del mercado y estimaciones, por precio, 2023-2032
        3. 10.2.8.3 Tamaño del mercado y estimaciones, por tamaño de la organización, 2023-2032
        4. 10.2.8.4 Tamaño del mercado y estimaciones, por sector industrial, 2023-2032
    3. 10.3 Europa
      1. 10.3.1 Tamaño del mercado y estimaciones, por país, 2023-2032
      2. 10.3.2 Tamaño del mercado y Estimaciones por implementación, 2023-2032
      3. 10.3.3 Tamaño del mercado y estimaciones por precio, 2023-2032
      4. 10.3.4 Tamaño del mercado y estimaciones por tamaño de la organización, 2023-2032
      5. 10.3.5 Tamaño del mercado y estimaciones por sector industrial, 2023-2032
      6. 10.3.6 Alemania
        1. 10.3.6.1 Tamaño del mercado y estimaciones por implementación, 2023-2032
        2. 10.3.6.2 Tamaño del mercado y estimaciones por precio, 2023-2032
        3. 10.3.6.3 Tamaño del mercado y estimaciones por tamaño de la organización, 2023-2032
        4. 10.3.6.4 Tamaño del mercado y Estimaciones por sector industrial, 2023-2032
      7. 10.3.7 Reino Unido
        1. 10.3.7.1 Tamaño del mercado y estimaciones por implementación, 2023-2032
        2. 10.3.7.2 Tamaño del mercado y estimaciones por precio, 2023-2032
        3. 10.3.7.3 Tamaño del mercado y estimaciones por tamaño de la organización, 2023-2032
        4. 10.3.7.4 Tamaño del mercado y estimaciones por sector industrial, 2023-2032
      8. 10.3.8 Francia
        1. 10.3.8.1 Tamaño del mercado y estimaciones por implementación, 2023-2032
        2. 10.3.8.2 Tamaño del mercado y Estimaciones por precio, 2023-2032
        3. 10.3.8.3 Tamaño del mercado y estimaciones por tamaño de la organización, 2023-2032
        4. 10.3.8.4 Tamaño del mercado y estimaciones por sector industrial, 2023-2032
      9. 10.3.9 Resto de Europa
        1. 10.3.9.1 Tamaño del mercado y estimaciones por implementación, 2023-2032
        2. 10.3.9.2 Tamaño del mercado y estimaciones por precio, 2023-2032
        3. 10.3.9.3 Tamaño del mercado y estimaciones por tamaño de la organización, 2023-2032
        4. 10.3.9.4 Tamaño del mercado y estimaciones por sector industrial, 2023-2032
    4. 10.4 Asia-Pacífico
      1. 10.4.1 Tamaño del mercado y estimaciones, por país, 2023-2032
      2. 10.4.2 Tamaño del mercado y estimaciones, por implementación, 2023-2032
      3. 10.4.3 Tamaño del mercado y estimaciones, por precio, 2023-2032
      4. 10.4.4 Tamaño del mercado y estimaciones, por tamaño de la organización, 2023-2032
      5. 10.4.5 Tamaño del mercado y estimaciones, por sector industrial, 2023-2032
      6. 10.4.6 China
        1. 10.4.6.1 Tamaño del mercado y estimaciones, por implementación, 2023-2032
        2. 10.4.6.2 Tamaño del mercado y Estimaciones por precio, 2023-2032
        3. 10.4.6.3 Tamaño del mercado y estimaciones por tamaño de la organización, 2023-2032
        4. 10.4.6.4 Tamaño del mercado y estimaciones por sector industrial, 2023-2032
      7. 10.4.7 Japón
        1. 10.4.7.1 Tamaño del mercado y estimaciones por implementación, 2023-2032
        2. 10.4.7.2 Tamaño del mercado y estimaciones por precio, 2023-2032
        3. 10.4.7.3 Tamaño del mercado y estimaciones por tamaño de la organización, 2023-2032
        4. 10.4.7.4 Tamaño del mercado y Estimaciones por sector industrial, 2023-2032
      8. 10.4.8 India
        1. 10.4.8.1 Tamaño del mercado y estimaciones por implementación, 2023-2032
        2. 10.4.8.2 Tamaño del mercado y estimaciones por precio, 2023-2032
        3. 10.4.8.3 Tamaño del mercado y estimaciones por tamaño de la organización, 2023-2032
        4. 10.4.8.4 Tamaño del mercado y estimaciones por sector industrial, 2023-2032
      9. 10.4.9 Resto de Asia-Pacífico
        1. 10.4.9.1 Tamaño del mercado y estimaciones por implementación, 2023-2032
        2. 10.4.9.2 Tamaño del mercado y Estimaciones por precio, 2023-2032
        3. 10.4.9.3 Tamaño del mercado y estimaciones por tamaño de la organización, 2023-2032
        4. 10.4.9.4 Tamaño del mercado y estimaciones por sector industrial, 2023-2032
    5. 10.5 Oriente Medio y África
      1. 10.5.1 Tamaño del mercado y estimaciones por implementación, 2023-2032
      2. 10.5.2 Tamaño del mercado y estimaciones por precio, 2023-2032
      3. 10.5.3 Tamaño del mercado y estimaciones por tamaño de la organización, 2023-2032
      4. 10.5.4 Tamaño del mercado y estimaciones por sector industrial, 2023-2032
    6. 10.6 Sudamérica
      1. 10.6.1 Tamaño del mercado y estimaciones, por implementación, 2023-2032
      2. 10.6.2 Tamaño del mercado y estimaciones, por precio, 2023-2032
      3. 10.6.3 Tamaño del mercado y estimaciones, por tamaño de organización, 2023-2032
      4. 10.6.4 Tamaño del mercado y estimaciones, por sector industrial, 2023-2032
  11. 11 PANORAMA COMPETITIVO
    1. 11.1 Introducción
    2. 11.2 Análisis de la cuota de mercado de los actores clave, 2020 (%)
    3. 11.3 Benchmarking competitivo
    4. 11.4 Panel de competidores
    5. 11.5 Principal estrategia de crecimiento en el mercado
    6. 11.6 Desarrollos clave y estrategias de crecimiento
      1. 11.6.1 Desarrollo de nuevos productos
      2. 11.6.2 Fusiones y adquisiciones
      3. 11.6.3 Contratos y acuerdos
  12. 12 PERFILES DE EMPRESAS
    1. 12.1 IBM (EE. UU.)
      1. 12.1.1 Descripción general de la empresa
      2. 12.1.2 Descripción financiera
      3. 12.1.3 Software/soluciones ofrecidas
      4. 12.1.4 Desarrollos clave
      5. 12.1.5 Análisis FODA
      6. 12.1.6 Estrategias clave
    2. 12.2 National Instruments (EE. UU.)
      1. 12.2.1 Descripción general de la empresa
      2. 12.2.2 Descripción financiera
      3. 12.2.3 Software/soluciones ofrecidas
      4. 12.2.4 Desarrollos clave
      5. 12.2.5 Análisis FODA
      6. 12.2.6 Estrategias Clave
    3. 12.3 Zephyr (SmartBear) (EE. UU.)
      1. 12.3.1 Descripción General de la Empresa
      2. 12.3.2 Descripción Financiera
      3. 12.3.3 Software/Soluciones Ofrecidas
      4. 12.3.4 Desarrollos Clave
      5. 12.3.5 Análisis FODA
    4. 12.4 Jama Software (EE. UU.)
      1. 12.4.1 Descripción General de la Empresa
      2. 12.4.2 Descripción Financiera
      3. 12.4.3 Software/Soluciones Ofrecidas
      4. 12.4.4 Desarrollos Clave
      5. 12.4.5 Análisis FODA
      6. 12.4.6 Estrategias Clave
    5. 12.5 XQual (Francia)
      1. 12.5.1 Descripción General de la Empresa
      2. 12.5.2 Descripción Financiera
      3. 12.5.3 Software/Soluciones ofrecidas
      4. 12.5.4 Desarrollos clave
      5. 12.5.5 Análisis FODA
      6. 12.5.6 Estrategias clave
    6. 12.6 TestCaseLab (Ucrania)
      1. 12.6.1 Descripción general de la empresa
      2. 12.6.2 Panorama financiero
      3. 12.6.3 Software/Soluciones ofrecidas
      4. 12.6.4 Desarrollos clave
      5. 12.6.5 Análisis FODA
      6. 12.6.6 Estrategias clave
    7. 12.7 Adaptavist (Reino Unido)
      1. 12.7.1 Descripción general de la empresa
      2. 12.7.2 Panorama financiero
      3. 12.7.3 Software/Soluciones ofrecidas
      4. 12.7.4 Desarrollos clave
      5. 12.7.5 Análisis FODA
      6. 12.7.6 Estrategias Clave
    8. 12.8 Tricentis (EE. UU.)
      1. 12.8.1 Descripción General de la Empresa
      2. 12.8.2 Descripción Financiera
      3. 12.8.3 Software/Soluciones Ofrecidas
      4. 12.8.4 Desarrollos Clave
      5. 12.8.5 Análisis FODA
      6. 12.8.6 Estrategias Clave
    9. 12.9 PractiTest (Israel)
      1. 12.9.1 Descripción General de la Empresa
      2. 12.9.2 Descripción Financiera
      3. 12.9.3 Software/Soluciones Ofrecidas
      4. 12.9.4 Desarrollos Clave
      5. 12.9.5 Análisis FODA
      6. 12.9.6 Estrategias Clave
    10. 12.10 Plutora Test (EE. UU.)
      1. 12.10.1 Descripción General de la Empresa
      2. 12.10.2 Resumen financiero
      3. 12.10.3 Software/Soluciones ofrecidas
      4. 12.10.4 Desarrollos clave
      5. 12.10.5 Análisis FODA
      6. 12.10.6 Estrategias clave
    11. 12.11 Inflectra (EE. UU.)
      1. 12.11.1 Resumen de la empresa
      2. 12.11.2 Resumen financiero
      3. 12.11.3 Software/Soluciones ofrecidas
      4. 12.11.4 Desarrollos clave
      5. 12.11.5 Análisis FODA
      6. 12.11.6 Estrategias clave
    12. 12.12 Test Collab (Canadá)
      1. 12.12.1 Resumen de la empresa
      2. 12.12.2 Resumen financiero
      3. 12.12.3 Software/Soluciones ofrecidas
      4. 12.12.4 Desarrollos Clave
      5. 12.12.5 Análisis FODA
      6. 12.12.6 Estrategias Clave
    13. 12.13 Quentic GmbH (Alemania)
      1. 12.13.1 Descripción General de la Empresa
      2. 12.13.2 Descripción Financiera
      3. 12.13.3 Software/Soluciones Ofrecidas
      4. 12.13.4 Desarrollos Clave
      5. 12.13.5 Análisis FODA
      6. 12.13.6 Estrategias Clave
    14. 12.14 QACoverage (EE. UU.)
      1. 12.14.1 Descripción General de la Empresa
      2. 12.14.2 Descripción Financiera
      3. 12.14.3 Software/Soluciones Ofrecidas
      4. 12.14.4 Desarrollos Clave
      5. 12.14.5 Análisis FODA
      6. 12.14.6 Estrategias Clave
    15. 12.15 Meliora Testlab (Finlandia)
      1. 12.15.1 Descripción General de la Empresa
      2. 12.15.2 Resumen Financiero
      3. 12.15.3 Software/Soluciones Ofrecidas
      4. 12.15.4 Desarrollos Clave
      5. 12.15.5 Análisis FODA
      6. 12.15.6 Estrategias clave
    16. LISTA DE TABLAS
    17. TABLA 1 LISTA DE SUPUESTOS
    18. TABLA 2 MERCADO GLOBAL DE SOFTWARE DE GESTIÓN DE PRUEBAS, POR IMPLEMENTACIÓN, 2023-2032 (MILLONES DE USD)
    19. TABLA 3 MERCADO GLOBAL DE SOFTWARE DE GESTIÓN DE PRUEBAS, POR PRECIOS, 2023-2032 (MILLONES DE USD)
    20. TABLA 4 MERCADO GLOBAL DE SOFTWARE DE GESTIÓN DE PRUEBAS, POR TAMAÑO DE LA ORGANIZACIÓN, 2023-2032 (MILLONES DE USD)
    21. TABLA 5 MERCADO GLOBAL DE SOFTWARE DE GESTIÓN DE PRUEBAS, POR VERTICAL DE LA INDUSTRIA, 2023-2032 (MILLONES DE USD)
    22. TABLA 6 MERCADO GLOBAL DE SOFTWARE DE GESTIÓN DE PRUEBAS, POR REGIÓN, 2023-2032 (MILLONES DE USD) MILLONES)
    23. TABLA 7 MERCADO DE SOFTWARE DE GESTIÓN DE NORTH AMERICATEST, POR PAÍS, 2023-2032 (MILLONES DE USD)
    24. TABLA 8 MERCADO DE SOFTWARE DE GESTIÓN DE NORTH AMERICATEST, POR IMPLEMENTACIÓN, 2023-2032 (MILLONES DE USD)
    25. TABLA 9 MERCADO DE SOFTWARE DE GESTIÓN DE NORTH AMERICATEST, POR PRECIO, 2023-2032 (MILLONES DE USD)
    26. TABLA 10 MERCADO DE SOFTWARE DE GESTIÓN DE NORTH AMERICATEST, POR TAMAÑO DE LA ORGANIZACIÓN, 2023-2032 (MILLONES DE USD)
    27. TABLA 11 MERCADO DE SOFTWARE DE GESTIÓN DE PRUEBAS EN AMÉRICA DEL NORTE, POR VERTICAL DE LA INDUSTRIA, 2023-2032 (MILLONES DE USD)
    28. TABLA 12 MERCADO DE SOFTWARE DE GESTIÓN DE PRUEBAS, POR IMPLEMENTACIÓN, 2023-2032 (MILLONES DE USD)
    29. TABLA 13 MERCADO DE SOFTWARE DE GESTIÓN DE PRUEBAS, POR PRECIOS, 2023-2032 (MILLONES DE USD)
    30. TABLA 14 MERCADO DE SOFTWARE DE GESTIÓN DE PRUEBAS, POR TAMAÑO DE LA ORGANIZACIÓN, 2023-2032 (MILLONES DE USD)
    31. TABLA 15 MERCADO DE SOFTWARE DE GESTIÓN DE PRUEBAS, POR VERTICAL DE LA INDUSTRIA, 2023-2032 (MILLONES DE USD)
    32. TABLA 16 MERCADO DE SOFTWARE DE GESTIÓN DE PRUEBAS EN CANADÁ, POR IMPLEMENTACIÓN, 2023-2032 (USD MILLONES)
    33. TABLA 17 MERCADO DE SOFTWARE DE GESTIÓN DE PRUEBAS DE CANADÁ, POR PRECIOS, 2023-2032 (USD MILLONES)
    34. TABLA 18 MERCADO DE SOFTWARE DE GESTIÓN DE PRUEBAS DE CANADÁ, POR TAMAÑO DE LA ORGANIZACIÓN, 2023-2032 (USD MILLONES)
    35. TABLA 19 MERCADO DE SOFTWARE DE GESTIÓN DE PRUEBAS DE CANADÁ, POR VERTICAL DE LA INDUSTRIA, 2023-2032 (USD MILLONES)
    36. TABLA 20 MERCADO DE SOFTWARE DE GESTIÓN DE PRUEBAS DE MÉXICO, POR IMPLEMENTACIÓN, 2023-2032 (USD MILLONES)
    37. TABLA 21 MERCADO DE SOFTWARE DE GESTIÓN DE PRUEBAS DE MÉXICO, POR PRECIOS, 2023-2032 (USD MILLONES)
    38. TABLA 22 MERCADO DE SOFTWARE DE GESTIÓN DE PRUEBAS EN MÉXICO, POR TAMAÑO DE ORGANIZACIÓN, 2023-2032 (MILLONES DE USD)
    39. TABLA 23 MERCADO DE SOFTWARE DE GESTIÓN DE PRUEBAS EN MÉXICO, POR VERTICAL DE LA INDUSTRIA, 2023-2032 (MILLONES DE USD)
    40. TABLA 24 MERCADO DE SOFTWARE DE GESTIÓN DE PRUEBAS EN EUROPA, POR PAÍS, 2023-2032 (MILLONES DE USD)
    41. TABLA 25 MERCADO DE SOFTWARE DE GESTIÓN DE PRUEBAS EN EUROPA, POR IMPLEMENTACIÓN, 2023-2032 (MILLONES DE USD)
    42. TABLA 26 MERCADO DE SOFTWARE DE GESTIÓN DE PRUEBAS EN EUROPA, POR PRECIOS, 2023-2032 (MILLONES DE USD)
    43. TABLA 27 MERCADO DE SOFTWARE DE GESTIÓN DE PRUEBAS EN EUROPA, POR TAMAÑO DE ORGANIZACIÓN, 2023-2032 (USD MILLONES)
    44. TABLA 28 MERCADO EUROPEO DE SOFTWARE DE GESTIÓN DE PRUEBAS, POR SECTOR VERTICAL, 2023-2032 (USD MILLONES)
    45. TABLA 29 MERCADO ALEMANO DE SOFTWARE DE GESTIÓN DE PRUEBAS, POR IMPLEMENTACIÓN, 2023-2032 (USD MILLONES)
    46. TABLA 30 MERCADO ALEMANO DE SOFTWARE DE GESTIÓN DE PRUEBAS, POR PRECIOS, 2023-2032 (USD MILLONES)
    47. TABLA 31 MERCADO ALEMANO DE SOFTWARE DE GESTIÓN DE PRUEBAS, POR TAMAÑO DE LA ORGANIZACIÓN, 2023-2032 (USD MILLONES)
    48. TABLA 32 MERCADO ALEMANO DE SOFTWARE DE GESTIÓN DE PRUEBAS, POR SECTOR VERTICAL, 2023-2032 (USD MILLONES)
    49. TABLA 33 MERCADO DE SOFTWARE DE GESTIÓN DE PRUEBAS DEL REINO UNIDO, POR IMPLEMENTACIÓN, 2023-2032 (MILLONES DE USD)
    50. TABLA 34 MERCADO DE SOFTWARE DE GESTIÓN DE PRUEBAS DEL REINO UNIDO, POR PRECIOS, 2023-2032 (MILLONES DE USD)
    51. TABLA 35 MERCADO DE SOFTWARE DE GESTIÓN DE PRUEBAS DEL REINO UNIDO, POR TAMAÑO DE LA ORGANIZACIÓN, 2023-2032 (MILLONES DE USD)
    52. TABLA 36 MERCADO DE SOFTWARE DE GESTIÓN DE PRUEBAS DEL REINO UNIDO, POR VERTICAL DE LA INDUSTRIA, 2023-2032 (MILLONES DE USD)
    53. TABLA 37 MERCADO DE SOFTWARE DE GESTIÓN DE PRUEBAS DE FRANCIA, POR IMPLEMENTACIÓN, 2023-2032 (MILLONES DE USD)
    54. TABLA 38 MERCADO DE SOFTWARE DE GESTIÓN DE PRUEBAS DE FRANCIA, POR PRECIOS, 2023-2032 (USD MILLONES)
    55. TABLA 39 MERCADO DE SOFTWARE DE GESTIÓN DE PRUEBAS EN FRANCIA, POR TAMAÑO DE LA ORGANIZACIÓN, 2023-2032 (USD MILLONES)
    56. TABLA 40 MERCADO DE SOFTWARE DE GESTIÓN DE PRUEBAS EN FRANCIA, POR SECTOR VERTICAL, 2023-2032 (USD MILLONES)
    57. TABLA 41 MERCADO DE SOFTWARE DE GESTIÓN DE PRUEBAS EN EL RESTO DE EUROPA, POR IMPLEMENTACIÓN, 2023-2032 (USD MILLONES)
    58. TABLA 42 MERCADO DE SOFTWARE DE GESTIÓN DE PRUEBAS EN EL RESTO DE EUROPA, POR PRECIOS, 2023-2032 (USD MILLONES)
    59. TABLA 43 MERCADO DE SOFTWARE DE GESTIÓN DE PRUEBAS EN EL RESTO DE EUROPA, POR TAMAÑO DE LA ORGANIZACIÓN, 2023-2032 (USD MILLONES)
    60. TABLA 44 RESTO DE EUROPA MERCADO DE SOFTWARE DE GESTIÓN DE PRUEBAS, POR SECTOR VERTICAL, 2023-2032 (MILLONES DE USD)
    61. TABLA 45 MERCADO DE SOFTWARE DE GESTIÓN DE PRUEBAS DE ASIA-PACÍFICO, POR PAÍS, 2023-2032 (MILLONES DE USD)
    62. TABLA 46 MERCADO DE SOFTWARE DE GESTIÓN DE PRUEBAS DE ASIA-PACÍFICO, POR IMPLEMENTACIÓN, 2023-2032 (MILLONES DE USD)
    63. TABLA 47 MERCADO DE SOFTWARE DE GESTIÓN DE PRUEBAS DE ASIA-PACÍFICO, POR PRECIO, 2023-2032 (MILLONES DE USD)
    64. TABLA 48 MERCADO DE SOFTWARE DE GESTIÓN DE PRUEBAS DE ASIA-PACÍFICO, POR TAMAÑO DE LA ORGANIZACIÓN, 2023-2032 (MILLONES DE USD)
    65. TABLA 49 MERCADO DE SOFTWARE DE GESTIÓN DE PRUEBAS DE ASIA-PACÍFICO, POR VERTICAL DE LA INDUSTRIA, 2023-2032 (MILLONES DE USD)
    66. TABLA 50 MERCADO DE SOFTWARE DE GESTIÓN DE PRUEBAS DE CHINA, POR IMPLEMENTACIÓN, 2023-2032 (MILLONES DE USD)
    67. TABLA 51 MERCADO DE SOFTWARE DE GESTIÓN DE PRUEBAS DE CHINA, POR PRECIOS, 2023-2032 (MILLONES DE USD)
    68. TABLA 52 MERCADO DE SOFTWARE DE GESTIÓN DE PRUEBAS DE CHINA, POR TAMAÑO DE LA ORGANIZACIÓN, 2023-2032 (MILLONES DE USD)
    69. TABLA 53 MERCADO DE SOFTWARE DE GESTIÓN DE PRUEBAS DE CHINA, POR VERTICAL DE LA INDUSTRIA, 2023-2032 (MILLONES DE USD)
    70. TABLA 54 MERCADO DE SOFTWARE DE GESTIÓN DE PRUEBAS DE INDIA, POR IMPLEMENTACIÓN, 2023-2032 (USD MILLONES)
    71. TABLA 55 MERCADO DE SOFTWARE DE GESTIÓN DE PRUEBAS DE LA INDIA, POR PRECIOS, 2023-2032 (USD MILLONES)
    72. TABLA 56 MERCADO DE SOFTWARE DE GESTIÓN DE PRUEBAS DE LA INDIA, POR TAMAÑO DE LA ORGANIZACIÓN, 2023-2032 (USD MILLONES)
    73. TABLA 57 MERCADO DE SOFTWARE DE GESTIÓN DE PRUEBAS DE LA INDIA, POR VERTICAL DE LA INDUSTRIA, 2023-2032 (USD MILLONES)
    74. TABLA 58 MERCADO DE SOFTWARE DE GESTIÓN DE PRUEBAS DE JAPÓN, POR IMPLEMENTACIÓN, 2023-2032 (USD MILLONES)
    75. TABLA 59 MERCADO DE SOFTWARE DE GESTIÓN DE PRUEBAS DE JAPÓN, POR PRECIOS, 2023-2032 (USD MILLONES)
    76. TABLA 60 PRUEBAS DE JAPÓN MERCADO DE SOFTWARE DE GESTIÓN, POR TAMAÑO DE ORGANIZACIÓN, 2023-2032 (MILLONES DE USD)
    77. TABLA 61 MERCADO DE SOFTWARE DE GESTIÓN DE PRUEBAS EN JAPÓN, POR VERTICAL DE LA INDUSTRIA, 2023-2032 (MILLONES DE USD)
    78. TABLA 62 RESTO DE ASIA-PACÍFICO MERCADO DE SOFTWARE DE GESTIÓN DE PRUEBAS, POR IMPLEMENTACIÓN, 2023-2032 (MILLONES DE USD)
    79. TABLA 63 RESTO DE ASIA-PACÍFICO MERCADO DE SOFTWARE DE GESTIÓN DE PRUEBAS, POR PRECIO, 2023-2032 (MILLONES DE USD)
    80. TABLA 64 RESTO DE ASIA-PACÍFICO MERCADO DE SOFTWARE DE GESTIÓN DE PRUEBAS, POR TAMAÑO DE ORGANIZACIÓN, 2023-2032 (MILLONES DE USD)
    81. TABLA 65 RESTO DE ASIA-PACÍFICO MERCADO DE SOFTWARE DE GESTIÓN, POR SECTOR VERTICAL, 2023-2032 (USD MILLONES)
    82. TABLA 66 MERCADO DE SOFTWARE DE GESTIÓN DE PRUEBAS DE ORIENTE MEDIO Y ÁFRICA, POR IMPLEMENTACIÓN, 2023-2032 (USD MILLONES)
    83. TABLA 67 MERCADO DE SOFTWARE DE GESTIÓN DE PRUEBAS DE ORIENTE MEDIO Y ÁFRICA, POR PRECIOS, 2023-2032 (USD MILLONES)
    84. TABLA 68 MERCADO DE SOFTWARE DE GESTIÓN DE PRUEBAS DE ORIENTE MEDIO Y ÁFRICA, POR TAMAÑO DE LA ORGANIZACIÓN, 2023-2032 (USD MILLONES)
    85. TABLA 69 MERCADO DE SOFTWARE DE GESTIÓN DE PRUEBAS DE ORIENTE MEDIO Y ÁFRICA, POR SECTOR VERTICAL, 2023-2032 (USD MILLONES)
    86. TABLA 70 MERCADO DE SOFTWARE DE GESTIÓN DE PRUEBAS DE SUDAMÉRICA, POR IMPLEMENTACIÓN, 2023-2032 (MILLONES DE USD)
    87. TABLA 71 MERCADO DE SOFTWARE DE GESTIÓN DE PRUEBAS DE SUDAMÉRICA, POR PRECIOS, 2023-2032 (MILLONES DE USD)
    88. TABLA 72 MERCADO DE SOFTWARE DE GESTIÓN DE PRUEBAS DE SUDAMÉRICA, POR TAMAÑO DE ORGANIZACIÓN, 2023-2032 (MILLONES DE USD)
    89. TABLA 73 MERCADO DE SOFTWARE DE GESTIÓN DE PRUEBAS DE SUDAMÉRICA, POR VERTICAL DE LA INDUSTRIA, 2023-2032 (MILLONES DE USD)
    90. ?
    91. ?
    92. LISTA DE FIGURAS
    93. FIGURA 1 SINOPSIS DEL MERCADO
    94. FIGURA 2 PROCESO DE INVESTIGACIÓN DE MRFR
    95. FIGURA 3 ENFOQUE DE ARRIBA HACIA ABAJO Y DE ABAJO HACIA ARRIBA
    96. FIGURA 4 MERCADO GLOBAL DE SOFTWARE DE GESTIÓN DE PRUEBAS, POR IMPLEMENTACIÓN, 2023-2032 (MILLONES DE USD)
    97. FIGURA 5 MERCADO GLOBAL DE SOFTWARE DE GESTIÓN DE PRUEBAS, POR PRECIOS, 2023-2032 (MILLONES DE USD)
    98. FIGURA 6 MERCADO GLOBAL DE SOFTWARE DE GESTIÓN DE PRUEBAS, POR TAMAÑO DE LA ORGANIZACIÓN, 2023-2032 (MILLONES DE USD)
    99. FIGURA 7 MERCADO GLOBAL DE SOFTWARE DE GESTIÓN DE PRUEBAS, POR VERTICAL DE LA INDUSTRIA, 2023-2032 (MILLONES DE USD)
    100. FIGURA 8 MERCADO GLOBAL DE SOFTWARE DE GESTIÓN DE PRUEBAS, POR REGIÓN, 2023-2032 (MILLONES DE USD) MILLONES)
    101. FIGURA 9 MERCADO DE SOFTWARE DE GESTIÓN DE NORTH AMERICATEST, POR PAÍS, 2023-2032 (MILLONES DE USD)
    102. FIGURA 10 MERCADO DE SOFTWARE DE GESTIÓN DE NORTH AMERICATEST, POR IMPLEMENTACIÓN, 2023-2032 (MILLONES DE USD)
    103. FIGURA 11 MERCADO DE SOFTWARE DE GESTIÓN DE NORTH AMERICATEST, POR PRECIO, 2023-2032 (MILLONES DE USD)
    104. FIGURA 12 MERCADO DE SOFTWARE DE GESTIÓN DE NORTH AMERICATEST, POR TAMAÑO DE LA ORGANIZACIÓN, 2023-2032 (MILLONES DE USD)
    105. FIGURA 13 MERCADO DE SOFTWARE DE GESTIÓN DE NORTH AMERICATEST, POR VERTICAL DE LA INDUSTRIA, 2023-2032 (MILLONES DE USD) MILLONES)
    106. FIGURA 14 MERCADO DE SOFTWARE DE GESTIÓN DE PRUEBAS, POR IMPLEMENTACIÓN, 2023-2032 (MILLONES DE USD)
    107. FIGURA 15 MERCADO DE SOFTWARE DE GESTIÓN DE PRUEBAS, POR PRECIOS, 2023-2032 (MILLONES DE USD)
    108. FIGURA 16 MERCADO DE SOFTWARE DE GESTIÓN DE PRUEBAS, POR TAMAÑO DE LA ORGANIZACIÓN, 2023-2032 (MILLONES DE USD)
    109. FIGURA 17 MERCADO DE SOFTWARE DE GESTIÓN DE PRUEBAS, POR VERTICAL DE LA INDUSTRIA, 2023-2032 (MILLONES DE USD)
    110. FIGURA 18 MERCADO DE SOFTWARE DE GESTIÓN DE PRUEBAS DE CANADÁ, POR IMPLEMENTACIÓN, 2023-2032 (MILLONES DE USD)
    111. FIGURA 19 SOFTWARE DE GESTIÓN DE PRUEBAS DE CANADÁ MERCADO, POR PRECIOS, 2023-2032 (USD MILLONES)
    112. FIGURA 20 MERCADO DE SOFTWARE DE GESTIÓN DE PRUEBAS DE CANADÁ, POR TAMAÑO DE ORGANIZACIÓN, 2023-2032 (USD MILLONES)
    113. FIGURA 21 MERCADO DE SOFTWARE DE GESTIÓN DE PRUEBAS DE CANADÁ, POR VERTICAL DE LA INDUSTRIA, 2023-2032 (USD MILLONES)
    114. FIGURA 22 MERCADO DE SOFTWARE DE GESTIÓN DE PRUEBAS DE MÉXICO, POR IMPLEMENTACIÓN, 2023-2032 (USD MILLONES)
    115. FIGURA 23 MERCADO DE SOFTWARE DE GESTIÓN DE PRUEBAS DE MÉXICO, POR PRECIOS, 2023-2032 (USD MILLONES)
    116. FIGURA 24 MERCADO DE SOFTWARE DE GESTIÓN DE PRUEBAS DE MÉXICO, POR TAMAÑO DE ORGANIZACIÓN, 2023-2032 (USD MILLONES)
    117. FIGURA 25 MERCADO DE SOFTWARE DE GESTIÓN DE PRUEBAS DE MÉXICO, POR VERTICAL DE LA INDUSTRIA, 2023-2032 (USD MILLONES)
    118. FIGURA 26 MERCADO DE SOFTWARE DE GESTIÓN DE PRUEBAS DE EUROPA, POR PAÍS, 2023-2032 (USD MILLONES)
    119. FIGURA 27 MERCADO DE SOFTWARE DE GESTIÓN DE PRUEBAS DE EUROPA, POR IMPLEMENTACIÓN, 2023-2032 (USD MILLONES)
    120. FIGURA 28 MERCADO DE SOFTWARE DE GESTIÓN DE PRUEBAS DE EUROPA, POR PRECIOS, 2023-2032 (USD MILLONES)
    121. FIGURA 29 MERCADO DE SOFTWARE DE GESTIÓN DE PRUEBAS DE EUROPA, POR TAMAÑO DE LA ORGANIZACIÓN, 2023-2032 (USD MILLONES)
    122. FIGURA 30 MERCADO EUROPEO DE SOFTWARE DE GESTIÓN DE PRUEBAS, POR SECTOR VERTICAL, 2023-2032 (MILLONES DE USD)
    123. FIGURA 31 MERCADO ALEMANO DE SOFTWARE DE GESTIÓN DE PRUEBAS, POR IMPLEMENTACIÓN, 2023-2032 (MILLONES DE USD)
    124. FIGURA 32 MERCADO ALEMANO DE SOFTWARE DE GESTIÓN DE PRUEBAS, POR PRECIO, 2023-2032 (MILLONES DE USD)
    125. FIGURA 33 MERCADO ALEMANO DE SOFTWARE DE GESTIÓN DE PRUEBAS, POR TAMAÑO DE ORGANIZACIÓN, 2023-2032 (MILLONES DE USD)
    126. FIGURA 34 MERCADO ALEMANO DE SOFTWARE DE GESTIÓN DE PRUEBAS, POR SECTOR VERTICAL, 2023-2032 (MILLONES DE USD)
    127. FIGURA 35 REINO UNIDO MERCADO DE SOFTWARE DE GESTIÓN DE PRUEBAS, POR IMPLEMENTACIÓN, 2023-2032 (MILLONES DE USD)
    128. FIGURA 36 MERCADO DE SOFTWARE DE GESTIÓN DE PRUEBAS DEL REINO UNIDO, POR PRECIOS, 2023-2032 (MILLONES DE USD)
    129. FIGURA 37 MERCADO DE SOFTWARE DE GESTIÓN DE PRUEBAS DEL REINO UNIDO, POR TAMAÑO DE LA ORGANIZACIÓN, 2023-2032 (MILLONES DE USD)
    130. FIGURA 38 MERCADO DE SOFTWARE DE GESTIÓN DE PRUEBAS DEL REINO UNIDO, POR VERTICAL DE LA INDUSTRIA, 2023-2032 (MILLONES DE USD)
    131. FIGURA 39 MERCADO DE SOFTWARE DE GESTIÓN DE PRUEBAS DE FRANCIA, POR IMPLEMENTACIÓN, 2023-2032 (MILLONES DE USD)
    132. FIGURA 40 MERCADO DE SOFTWARE DE GESTIÓN DE PRUEBAS DE FRANCIA, POR PRECIOS, 2023-2032 (USD MILLONES)
    133. FIGURA 41 MERCADO DE SOFTWARE DE GESTIÓN DE PRUEBAS EN FRANCIA, POR TAMAÑO DE LA ORGANIZACIÓN, 2023-2032 (USD MILLONES)
    134. FIGURA 42 MERCADO DE SOFTWARE DE GESTIÓN DE PRUEBAS EN FRANCIA, POR SECTOR VERTICAL, 2023-2032 (USD MILLONES)
    135. FIGURA 43 MERCADO DE SOFTWARE DE GESTIÓN DE PRUEBAS EN EL RESTO DE EUROPA, POR IMPLEMENTACIÓN, 2023-2032 (USD MILLONES)
    136. FIGURA 44 MERCADO DE SOFTWARE DE GESTIÓN DE PRUEBAS EN EL RESTO DE EUROPA, POR PRECIOS, 2023-2032 (USD MILLONES)
    137. FIGURA 45 MERCADO DE SOFTWARE DE GESTIÓN DE PRUEBAS EN EL RESTO DE EUROPA, POR TAMAÑO DE LA ORGANIZACIÓN, 2023-2032 (USD MILLONES)
    138. FIGURA 46 RESTO DE EUROPA MERCADO DE SOFTWARE DE GESTIÓN DE PRUEBAS, POR SECTOR VERTICAL, 2023-2032 (USD MILLONES)
    139. FIGURA 47 ASIA-PACÍFICO MERCADO DE SOFTWARE DE GESTIÓN DE PRUEBAS, POR PAÍS, 2023-2032 (USD MILLONES)
    140. FIGURA 48 ASIA-PACÍFICO MERCADO DE SOFTWARE DE GESTIÓN DE PRUEBAS, POR IMPLEMENTACIÓN, 2023-2032 (USD MILLONES)
    141. FIGURA 49 ASIA-PACÍFICO MERCADO DE SOFTWARE DE GESTIÓN DE PRUEBAS, POR PRECIO, 2023-2032 (USD MILLONES)
    142. FIGURA 50 ASIA-PACÍFICO MERCADO DE SOFTWARE DE GESTIÓN DE PRUEBAS, POR TAMAÑO DE LA ORGANIZACIÓN, 2023-2032 (USD FIGURA 51 MERCADO DE SOFTWARE DE GESTIÓN DE PRUEBAS DE ASIA-PACÍFICO, POR SECTOR VERTICAL, 2023-2032 (USD MILLONES) FIGURA 52 MERCADO DE SOFTWARE DE GESTIÓN DE PRUEBAS DE CHINA, POR IMPLEMENTACIÓN, 2023-2032 (USD MILLONES) FIGURA 53 MERCADO DE SOFTWARE DE GESTIÓN DE PRUEBAS DE CHINA, POR PRECIOS, 2023-2032 (USD MILLONES) FIGURA 54 MERCADO DE SOFTWARE DE GESTIÓN DE PRUEBAS DE CHINA, POR TAMAÑO DE LA ORGANIZACIÓN, 2023-2032 (USD MILLONES) FIGURA 55 MERCADO DE SOFTWARE DE GESTIÓN DE PRUEBAS DE CHINA, POR SECTOR VERTICAL, 2023-2032 (USD MILLONES) FIGURA 56 INDIA MERCADO DE SOFTWARE DE GESTIÓN DE PRUEBAS, POR IMPLEMENTACIÓN, 2023-2032 (MILLONES DE USD)
    143. FIGURA 57 MERCADO DE SOFTWARE DE GESTIÓN DE PRUEBAS DE INDIA, POR PRECIOS, 2023-2032 (MILLONES DE USD)
    144. FIGURA 58 MERCADO DE SOFTWARE DE GESTIÓN DE PRUEBAS DE INDIA, POR TAMAÑO DE LA ORGANIZACIÓN, 2023-2032 (MILLONES DE USD)
    145. FIGURA 59 MERCADO DE SOFTWARE DE GESTIÓN DE PRUEBAS DE INDIA, POR VERTICAL DE LA INDUSTRIA, 2023-2032 (MILLONES DE USD)
    146. FIGURA 60 MERCADO DE SOFTWARE DE GESTIÓN DE PRUEBAS DE JAPÓN, POR IMPLEMENTACIÓN, 2023-2032 (MILLONES DE USD)
    147. FIGURA 61 MERCADO DE SOFTWARE DE GESTIÓN DE PRUEBAS DE JAPÓN, POR PRECIOS, FIGURA 62 MERCADO DE SOFTWARE DE GESTIÓN DE PRUEBAS EN JAPÓN, POR TAMAÑO DE LA ORGANIZACIÓN, 2023-2032 (MILLONES DE USD) FIGURA 63 MERCADO DE SOFTWARE DE GESTIÓN DE PRUEBAS EN JAPÓN, POR SECTOR VERTICAL, 2023-2032 (MILLONES DE USD) FIGURA 64 RESTO DE ASIA-PACÍFICO MERCADO DE SOFTWARE DE GESTIÓN DE PRUEBAS, POR IMPLEMENTACIÓN, 2023-2032 (MILLONES DE USD)FIGURA 65 RESTO DEL MERCADO DE SOFTWARE DE GESTIÓN DE PRUEBAS DE ASIA-PACÍFICO, POR PRECIOS, 2023-2032 (MILLONES DE USD)
    148. FIGURA 66 RESTO DEL MERCADO DE SOFTWARE DE GESTIÓN DE PRUEBAS DE ASIA-PACÍFICO, POR TAMAÑO DE LA ORGANIZACIÓN, 2023-2032 (MILLONES DE USD)
    149. FIGURA 67 RESTO DEL MERCADO DE SOFTWARE DE GESTIÓN DE PRUEBAS DE ASIA-PACÍFICO, POR VERTICAL DE LA INDUSTRIA, 2023-2032 (MILLONES DE USD)
    150. FIGURA 68 MERCADO DE SOFTWARE DE GESTIÓN DE PRUEBAS DE ORIENTE MEDIO Y ÁFRICA, POR IMPLEMENTACIÓN, 2023-2032 (MILLONES DE USD)
    151. FIGURA 69 ORIENTE MEDIO Y MERCADO DE SOFTWARE DE GESTIÓN DE PRUEBAS EN ÁFRICA, POR PRECIOS, 2023-2032 (MILLONES DE USD)
    152. FIGURA 70 MERCADO DE SOFTWARE DE GESTIÓN DE PRUEBAS EN ORIENTE MEDIO Y ÁFRICA, POR TAMAÑO DE LA ORGANIZACIÓN, 2023-2032 (MILLONES DE USD)
    153. FIGURA 71 ORIENTE MEDIO Y ÁFRICA, POR TAMAÑO DE LA ORGANIZACIÓN, 2023-2032 (MILLONES DE USD) MERCADO DE SOFTWARE DE GESTIÓN DE PRUEBAS EN ÁFRICA, POR SECTOR VERTICAL, 2023-2032 (MILLONES DE USD)
    154. FIGURA 72 MERCADO DE SOFTWARE DE GESTIÓN DE PRUEBAS EN SUDAMÉRICA, POR IMPLEMENTACIÓN, 2023-2032 (MILLONES DE USD)
    155. FIGURA 73 MERCADO DE SOFTWARE DE GESTIÓN DE PRUEBAS EN SUDAMÉRICA, POR PRECIOS, 2023-2032 (MILLONES DE USD)
    156. FIGURA 74 MERCADO DE SOFTWARE DE GESTIÓN DE PRUEBAS EN SUDAMÉRICA, POR TAMAÑO DE LA ORGANIZACIÓN, 2023-2032 (MILLONES DE USD)
    157. FIGURA 75 MERCADO DE SOFTWARE DE GESTIÓN DE PRUEBAS EN SUDAMÉRICA, POR SECTOR VERTICAL, 2023-2032 (MILLONES DE USD)

Segmentación del mercado de software de gestión de pruebas

Perspectiva de implementación de software de gestión de pruebas (miles de millones de USD, 2018-2032)

  • Local

  • Nube

Perspectiva de precios de software de gestión de pruebas (miles de millones de USD, 2018-2032)

  • Mensual

  • Anual

  • Licencia única

Perspectiva del tamaño de la organización de software de gestión de pruebas (miles de millones de USD, 2018-2032)

  • PYMES

  • Grandes Empresas

Perspectiva vertical del software de gestión de pruebas (miles de millones de USD, 2018-2032)

  • BFSI

  • TI y telecomunicaciones

  • Manufactura

  • Energía y servicios públicos

  • Salud y ciencias de la vida

  • Educación

  • Aeroespacial y defensa

  • Otros

Perspectiva regional del software de gestión de pruebas (miles de millones de USD, 2018-2032)

  • Perspectivas para Norteamérica (miles de millones de USD, 2018-2032)

    • Software de gestión de pruebas en Norteamérica por implementación

      • Local

      • Nube

    • Software de gestión de pruebas en Norteamérica por precio

      • Mensual

      • Anual

      • Licencia única

    • Software de gestión de pruebas en Norteamérica por tamaño de organización

      • PYMES

      • Grandes Empresas

    • Software de gestión de pruebas en Norteamérica por sector vertical

      • BFSI

      • TI y telecomunicaciones

      • Fabricación

      • Energía y servicios públicos

      • Salud y ciencias de la vida

      • Educación

      • Aeroespacial y Defensa

      • Otros

    • Perspectiva de EE. UU. (miles de millones de USD, 2018-2032)

    • Software de gestión de pruebas en EE. UU. por implementación

      • Local

      • Nube

    • Software de gestión de pruebas en EE. UU. por precio

      • Mensual

      • Anual

      • Licencia única

    • Software de gestión de pruebas en EE. UU. por organización Tamaño

      • PYMES

      • Grandes empresas

    • Software de gestión de pruebas de EE. UU. por vertical

      • BFSI

      • TI y telecomunicaciones

      • Fabricación

      • Energía y servicios públicos

      • Salud y ciencias de la vida

      • Educación

      • Aeroespacial y Defensa

      • Otros

    • Perspectivas de Canadá (miles de millones de USD, 2018-2032)

    • Software de gestión de pruebas de Canadá por implementación

      • Local

      • Nube

    • Software de gestión de pruebas de Canadá por precio

      • Mensual

      • Anual

      • Licencia única

    • Software de gestión de pruebas de Canadá por organización Tamaño

      • PYMES

      • Grandes empresas

    • Software de gestión de pruebas de CANADÁ por vertical

      • BFSI

      • TI y telecomunicaciones

      • Manufactura

      • Energía y servicios públicos

      • Salud y ciencias de la vida

      • Educación

      • Aeroespacial y Defensa

      • Otros

  • Perspectivas en Europa (miles de millones de USD, 2018-2032)

    • Software de gestión de pruebas en Europa por implementación

      • Local

      • Nube

    • Software de gestión de pruebas en Europa por precio

      • Mensual

      • Anual

      • Licencia única

    • Gestión de pruebas en Europa Software por tamaño de organización

      • PYMES

      • Grandes empresas

    • Software de gestión de pruebas en Europa por vertical

      • BFSI

      • TI y telecomunicaciones

      • Fabricación

      • Energía y servicios públicos

      • Salud y ciencias de la vida, educación

      • Aeroespacial y Defensa

      • Otros

    • Alemania Perspectivas (miles de millones de USD, 2018-2032)

    • Software de gestión de pruebas en Alemania por implementación

      • Local

      • Nube

    • Software de gestión de pruebas en Alemania por precio

      • Mensual

      • Anual

      • Licencia única

    • Software de gestión de pruebas en Alemania por organización Tamaño

      • PYME

      • Grandes empresas

    • Software de gestión de pruebas en Alemania por vertical

      • BFSI

      • TI y telecomunicaciones

      • Fabricación

      • Energía y servicios públicos

      • Salud y ciencias de la vida

      • Educación

      • Aeroespacial y Defensa

      • Otros

    • Perspectivas para Francia (miles de millones de USD, 2018-2032)

    • Software de gestión de pruebas en Francia por implementación

      • Local

      • Nube

    • Software de gestión de pruebas en Francia por precio

      • Mensual

      • Anual

      • Licencia única

    • Software de gestión de pruebas en Francia por organización Tamaño

      • PYME

      • Grandes empresas

    • Software de gestión de pruebas en Francia por vertical

      • BFSI

      • TI y telecomunicaciones

      • Fabricación

      • Energía y servicios públicos

      • Salud y ciencias de la vida

      • Educación

      • Aeroespacial y Defensa

      • Otros

    • Perspectivas para el Reino Unido (miles de millones de USD, 2018-2032)

    • Software de gestión de pruebas en el Reino Unido por implementación

      • Local

      • Nube

    • Software de gestión de pruebas en el Reino Unido por precio

      • Mensual

      • Anual

      • Licencia única

    • Software de gestión de pruebas en el Reino Unido por organización Tamaño

      • PYMES

      • Grandes empresas

    • Software de gestión de pruebas del Reino Unido por vertical

      • BFSI

      • TI y telecomunicaciones

      • Fabricación

      • Energía y servicios públicos

      • Salud y ciencias de la vida

      • Educación

      • Aeroespacial y Defensa

      • Otros

    • Perspectivas de ITALIA (miles de millones de USD, 2018-2032)

    • Software de gestión de pruebas en ITALIA por implementación

      • Local

      • Nube

    • Software de gestión de pruebas en ITALIA por precio

      • Mensual

      • Anual

      • Licencia única

    • Software de gestión de pruebas en ITALIA por organización Tamaño

      • PYMES

      • Grandes empresas

    • ITALIA Software de gestión de pruebas por vertical

      • BFSI

      • TI y telecomunicaciones

      • Fabricación

      • Energía y servicios públicos

      • Salud y ciencias de la vida

      • Educación

      • Aeroespacial y Defensa

      • Otros

    • Perspectivas para España (miles de millones de USD, 2018-2032)

    • Software de gestión de pruebas en España por implementación

      • Local

      • Nube

    • Software de gestión de pruebas en España por precio

      • Mensual

      • Anual

      • Licencia única

    • Software de gestión de pruebas en España por organización Tamaño

      • PYMES

      • Grandes empresas

    • Software de gestión de pruebas en España por vertical

      • BFSI

      • TI y telecomunicaciones

      • Fabricación

      • Energía y servicios públicos

      • Salud y ciencias de la vida

      • Educación

      • Aeroespacial y Defensa

      • Otros

    • Perspectivas para el resto de Europa (miles de millones de USD, 2018-2032)

    • Software de gestión de pruebas para el resto de Europa por implementación

      • Local

      • Nube

    • Software de gestión de pruebas para el resto de Europa por precio

      • Mensual

      • Anual

      • Licencia única

    • Software de gestión de pruebas para el resto de Europa por organización Tamaño

      • PYMES

      • Grandes empresas

    • RESTO DE EUROPA Software de gestión de pruebas por vertical

      • BFSI

      • TI y telecomunicaciones

      • Fabricación

      • Energía y servicios públicos

      • Salud y ciencias de la vida

      • Educación

      • Aeroespacial y Defensa

      • Otros

  • Perspectivas de Asia-Pacífico (miles de millones de USD, 2018-2032)

    • Software de gestión de pruebas en Asia-Pacífico por implementación

      • Local

      • Nube

    • Software de gestión de pruebas en Asia-Pacífico por precio

      • Mensual

      • Anual

      • Pago único Licencia

    • Software de gestión de pruebas en Asia-Pacífico por tamaño de organización

      • PYMES

      • Grandes empresas

    • Software de gestión de pruebas en Asia-Pacífico por sector vertical

      • BFSI

      • TI y telecomunicaciones

      • Fabricación

      • Energía y servicios públicos

      • Salud y ciencias de la vida

      • Educación

      • Aeroespacial y Defensa

      • Otros

    • Perspectivas de China (miles de millones de USD, 2018-2032)

    • Software de gestión de pruebas en China por implementación

      • Local

      • Nube

    • Software de gestión de pruebas en China por precio

      • Mensual

      • Anual

      • Licencia única

    • Software de gestión de pruebas en China por organización Tamaño

      • PYME

      • Grandes empresas

    • Software de gestión de pruebas en China por vertical

      • BFSI

      • TI y telecomunicaciones

      • Fabricación

      • Energía y servicios públicos

      • Salud y ciencias de la vida

      • Educación

      • Aeroespacial y Defensa

      • Otros

    • Perspectivas para Japón (miles de millones de USD, 2018-2032)

    • Software de gestión de pruebas en Japón por implementación

      • Local

      • Nube

    • Software de gestión de pruebas en Japón por precio

      • Mensual

      • Anual

      • Licencia única

    • Software de gestión de pruebas en Japón por organización Tamaño

      • PYME

      • Grandes empresas

    • Software de gestión de pruebas en Japón por vertical

      • BFSI

      • TI y telecomunicaciones

      • Fabricación

      • Energía y servicios públicos

      • Salud y ciencias de la vida

      • Educación

      • Aeroespacial y Defensa

      • Otros

    • Perspectivas para India (miles de millones de USD, 2018-2032)

    • Software de gestión de pruebas en India por implementación

      • Local

      • Nube

    • Software de gestión de pruebas en India por precio

      • Mensual

      • Anual

      • Licencia única

    • Software de gestión de pruebas en India por organización Tamaño

      • PYMES

      • Grandes empresas

    • Software de gestión de pruebas en India por vertical

      • BFSI

      • TI y telecomunicaciones

      • Fabricación

      • Energía y servicios públicos

      • Salud y ciencias de la vida

      • Educación

      • Aeroespacial y Defensa

      • Otros

    • Perspectivas para Australia (miles de millones de USD, 2018-2032)

    • Software de gestión de pruebas en Australia por implementación

      • Local

      • Nube

    • Software de gestión de pruebas en Australia por precio

      • Mensual

      • Anual

      • Licencia única

    • Software de gestión de pruebas en Australia por organización Tamaño

      • PYMES

      • Grandes empresas

    • Software de gestión de pruebas de Australia por vertical

      • BFSI

      • TI y telecomunicaciones

      • Fabricación

      • Energía y servicios públicos

      • Salud y ciencias de la vida

      • Educación

      • Aeroespacial y Defensa

      • Otros

    • Perspectivas para el resto de Asia-Pacífico (miles de millones de USD, 2018-2032)

    • Software de gestión de pruebas para el resto de Asia-Pacífico por implementación

      • Local

      • Nube

    • Software de gestión de pruebas para el resto de Asia-Pacífico por precio

      • Mensual

      • Anual

      • Pago único Licencia

    • Resto de software de gestión de pruebas de Asia-Pacífico por tamaño de organización

      • PYMES

      • Grandes empresas

    • Resto de software de gestión de pruebas de Asia-Pacífico por vertical

      • BFSI

      • TI y telecomunicaciones

      • Fabricación

      • Energía y servicios públicos

      • Salud y ciencias de la vida

      • Educación

      • Aeroespacial y Defensa

      • Otros

  • Perspectiva para el resto del mundo (miles de millones de USD, 2018-2032)

    • Software de gestión de pruebas para el resto del mundo por implementación

      • Local

      • Nube

    • Software de gestión de pruebas para el resto del mundo por precio

      • Mensual

      • Anual

      • Pago único Licencia

    • Software de gestión de pruebas en el resto del mundo por tamaño de organización

      • PYMES

      • Grandes empresas

    • Software de gestión de pruebas en el resto del mundo por vertical

      • BFSI

      • TI y telecomunicaciones

      • Fabricación

      • Energía y servicios públicos

      • Salud y ciencias de la vida

      • Educación

      • Aeroespacial y Defensa

      • Otros

    • Perspectivas para Oriente Medio (miles de millones de USD, 2018-2032)

    • Software de gestión de pruebas en Oriente Medio por implementación

      • Local

      • Nube

    • Software de gestión de pruebas en Oriente Medio por precio

      • Mensual

      • Anual

      • Licencia única

    • Software de gestión de pruebas en Oriente Medio por organización Tamaño

      • PYMES

    • Software de gestión de pruebas en Oriente Medio por vertical

      • BFSI

      • TI y telecomunicaciones

      • Fabricación

      • Energía y servicios públicos

      • Salud y ciencias de la vida

      • Educación

      • Aeroespacial y Defensa

      • Otros

    • Perspectivas de África (miles de millones de USD, 2018-2032)

    • Software de gestión de pruebas en África por implementación

      • Local

      • Nube

    • Software de gestión de pruebas en África por precio

      • Mensual

      • Anual

      • Licencia única

    • Software de gestión de pruebas en África por organización Tamaño

      • PYME

      • Grandes empresas

    • Software de gestión de pruebas en África por vertical

      • BFSI

      • TI y telecomunicaciones

      • Fabricación

      • Energía y servicios públicos

      • Salud y ciencias de la vida

      • Educación

      • Aeroespacial y Defensa

      • Otros

    • Perspectivas para América Latina (miles de millones de USD, 2018-2032)

    • Software de gestión de pruebas en América Latina por implementación

      • Local

      • Nube

    • Software de gestión de pruebas en América Latina por precio

      • Mensual

      • Anual

      • Licencia única

    • Software de gestión de pruebas en América Latina por organización Tamaño

      • PYMES

      • Grandes empresas

    • Software de gestión de pruebas en Latinoamérica por vertical

      • BFSI

      • TI y telecomunicaciones

      • Manufactura

      • Energía y servicios públicos

      • Salud y ciencias de la vida

      • Educación

      • Aeroespacial y defensa

      • Otros

Download PDF ×

We do not share your information with anyone. However, we may send you emails based on your report interest from time to time. You may contact us at any time to opt-out.