• Cat-intel
  • MedIntelliX
  • Resources
  • About Us
  • Request Free Sample

    ×

    Kindly complete the form below to receive a free sample of this Report

    Leading companies partner with us for data-driven Insights

    clients tt-cursor

    Software Testing Service Market

    ID: MRFR/ICT/36256-HCR
    100 Pages
    Aarti Dhapte
    September 2025

    Informe de investigación de mercado de servicios de pruebas de software por tipo de servicio (pruebas funcionales, pruebas de rendimiento, pruebas de automatización, pruebas de seguridad), por metodología de prueba (pruebas manuales, pruebas automatizadas), por tipo de implementación (local, basado en la nube), por industria de uso final (TI y telecomunicaciones, atención médica, banca, servicios financieros y seguros, comercio minorista, fabricación) y por región (América del Norte, Europa, América del Sur, Asia Pacífico, Medio Oriente y Áf...

    Share:

    Download PDF

    ×

    We do not share your information with anyone. However, we may send you emails based on your report interest from time to time. You may contact us at any time to opt-out.

    Software Testing Service Market Research Report — Global Forecast till 2032 Infographic
    $ 4.950,0
    $ 5.950,0
    $ 7.250,0
    Table of Contents

    Descripción general del mercado de servicios de pruebas de software

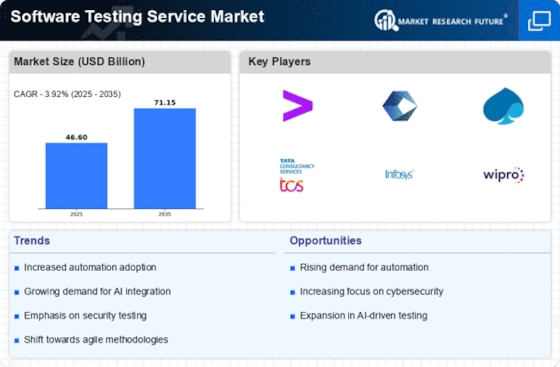
    Según el análisis de MRFR, el tamaño del mercado de servicios de pruebas de software se estimó en 41,52 (mil millones de dólares) en 2022 Se espera que la industria del mercado de servicios de pruebas de software crezca de 43,15 (miles de millones de dólares) en 2023 a 61,0 (miles de millones de dólares) en 2023. 2032. Se espera que la CAGR (tasa de crecimiento) del mercado de servicios de pruebas de software sea de alrededor del 3,92% durante el período de pronóstico (2024-2032).

    Se destacan las tendencias clave del mercado de servicios de pruebas de software

    El mercado de servicios de pruebas de software está experimentando un crecimiento significativo influenciado por varios impulsores del mercado. Uno de los factores clave es la creciente complejidad de las aplicaciones de software, que requiere pruebas rigurosas para garantizar la calidad y el rendimiento. A medida que las empresas adoptan metodologías ágiles y prácticas de DevOps, las pruebas continuas se han vuelto esenciales para satisfacer las demandas del rápido desarrollo e implementación de software. Además, el auge de la computación en la nube y las aplicaciones móviles ha generado una mayor necesidad de servicios de prueba integrales para abordar los desafíos funcionales, de compatibilidad y de seguridad. Las oportunidades en el mercado de pruebas de software son abundantes, particularmente con la integración de inteligencia artificial y herramientas de automatización.

    Estas tecnologías pueden mejorar la eficiencia y precisión de las pruebas, reducir el tiempo de comercialización y reducir los costos operativos. Las empresas pueden explorar el potencial de los marcos de automatización de pruebas y las soluciones de pruebas impulsadas por IA para optimizar sus procesos y mejorar la calidad general del software. Además, la creciente tendencia hacia el trabajo remoto ha generado la necesidad de soluciones de prueba efectivas que puedan acomodar equipos distribuidos y respaldar la colaboración. En los últimos tiempos, se ha prestado cada vez más atención a las pruebas y el cumplimiento de la seguridad, impulsado por el aumento de las amenazas cibernéticas y los requisitos normativos. Las empresas están dando prioridad a la implementación de medidas de seguridad sólidas dentro del ciclo de vida del desarrollo de software.

    La demanda de servicios de pruebas especializados, como pruebas de rendimiento y pruebas de experiencia del usuario, también está aumentando a medida que las organizaciones buscan mejorar la satisfacción y el compromiso del cliente. A medida que la transformación digital se acelera en todas las industrias, el mercado de pruebas de software seguirá evolucionando y desempeñará un papel crucial en la entrega exitosa de productos de software de alta calidad.

    Descripción general del mercado de servicios de pruebas de software

    Fuente: Investigación primaria, Investigación secundaria, Base de datos MRFR y revisión de analistas

    Impulsores del mercado de servicios de pruebas de software

    Creciente demanda de control de calidad del software

    El mercado de servicios de pruebas de software está presenciando un aumento significativo en la demanda de control de calidad del software, impulsado por la creciente dependencia de aplicaciones de software en diversas industrias. Ha habido una necesidad cada vez mayor de servicios de pruebas integrales a medida que las organizaciones se centran en el desarrollo y la implementación de soluciones eficaces. y software de alta calidad que puede aumentar su productividad y satisfacer las necesidades de los clientes. Esto es especialmente cierto en industrias como las más críticas, como la atención médica, las finanzas y el comercio electrónico, que son mucho más susceptibles a fallas de software y sus repercusiones.

    Tanto la influencia económica como la fraseología de los buenos rendimientos financieros del software garantizan una gran prominencia en las preferencias de los clientes. atención en la búsqueda de asistencia en servicios de prueba de software de alta calidad. También existen estándares y regulaciones que aumentan la atención sobre el tema de la calidad del software y requieren que las empresas empleen medidas efectivas de control de calidad. Por lo tanto, se prevé que la industria del mercado de servicios de pruebas de software sea testigo de un rápido crecimiento a medida que más empresas reconozcan la importancia de la calidad del software para garantizar el éxito de las operaciones comerciales.

    Crecimiento de las metodologías ágiles y DevOps

    El cambio hacia metodologías Agile y DevOps está revolucionando el ciclo de vida del desarrollo de software, creando una demanda sustancial de pruebas de software. servicios. Estos marcos priorizan el desarrollo rápido y la entrega continua, lo que requiere prácticas de prueba eficientes y efectivas que se alineen con la naturaleza acelerada del desarrollo de software moderno. Las organizaciones que adoptan estas metodologías reconocen la necesidad de una integración perfecta de los procesos de prueba dentro de sus procesos de desarrollo, impulsando así el crecimiento del mercado de servicios de pruebas de software. La industria del mercado de servicios de pruebas de software se beneficia de esta tendencia a medida que los servicios de pruebas se vuelven vitales para garantizar que se implemente el software. rápidamente sin comprometer la calidad.

    Importancia creciente de la automatización en las pruebas

    La automatización se está convirtiendo rápidamente en una piedra angular del panorama de las pruebas de software, impulsada por la necesidad de eficiencia y velocidad en el proceso de prueba. La creciente complejidad de las aplicaciones de software a menudo conduce a largos ciclos de prueba cuando se realizan manualmente. Las soluciones de pruebas automatizadas abordan este problema al permitir una ejecución de pruebas más rápida y precisa, lo que permite a las empresas acelerar su tiempo de comercialización. Además, a medida que las empresas adopten prácticas continuas de integración y entrega, es probable que aumente la demanda de servicios de pruebas automatizadas. Este cambio no solo agiliza los flujos de trabajo sino que también libera recursos para tareas más estratégicas dentro de las organizaciones. En consecuencia, el mercado de servicios de pruebas de software está preparado para beneficiarse significativamente de la creciente importancia de la automatización en las pruebas de software.

    Información sobre el segmento de mercado de servicios de pruebas de software

    Mercado de servicios de pruebas de software Información sobre tipos de servicios   >h4>

    Los ingresos del mercado de servicios de pruebas de software reflejan un panorama diverso segmentado por varios tipos de servicios, lo que ilustra una trayectoria de crecimiento sólida impulsado por la creciente demanda de soluciones de software de calidad. A partir de 2023, el mercado está valorado en aproximadamente 43,15 mil millones de dólares, y se prevé que aumentará significativamente para 2032. Dentro de este ámbito, se destaca las pruebas funcionales con una valoración de 12,5 mil millones de dólares en 2023, y se espera que alcance los 18,0 mil millones de dólares en 2032, destacando su participación mayoritaria garantiza que el software funcione según lo previsto, lo que lo hace fundamental para la satisfacción del usuario y la confiabilidad del sistema. Las pruebas de rendimiento, valoradas en 8 mil millones de dólares en 2023 con proyecciones de crecimiento a 12 mil millones de dólares en 2032, son importantes para las organizaciones que enfatizan la velocidad y la eficiencia en el rendimiento de las aplicaciones, vitales para conservar la ventaja competitiva en un mercado bullicioso. De manera similar, Automation Testing, que cuenta con una valoración de 11 mil millones de dólares en 2023 y prevé un crecimiento a 16,5 mil millones de dólares para 2032, refleja la tendencia de la industria hacia metodologías de prueba eficientes, donde los procesos automatizados reducen significativamente el tiempo y el error humano, aumentando así la productividad general. Las pruebas de seguridad también ocupan un lugar esencial en el mercado, comenzando con 11,65 mil millones de dólares en 2023 y se espera que alcancen los 14,5 mil millones de dólares en 2032; su creciente importancia subraya la necesidad de realizar pruebas rigurosas a medida que evoluciona el panorama de las amenazas cibernéticas. Cada tipo de prueba desempeña un papel único en la industria más amplia del mercado de servicios de pruebas de software, impulsando colectivamente el crecimiento del mercado y al mismo tiempo presenta distintas oportunidades y desafíos en la implementación. La segmentación del mercado muestra estadísticas clave que informan estrategias para compromisos futuros, lo que demuestra un panorama de innovación continua en metodologías, impulsando la evolución del ecosistema de servicios de prueba.

    Información sobre el tipo de servicio del mercado de servicios de pruebas de software

    Fuente: Investigación primaria, Investigación secundaria, Base de datos MRFR y revisión de analistas

    Servicio de pruebas de software Información sobre la metodología de pruebas del mercado   >h3>

    El mercado de servicios de pruebas de software, valorado en 43,15 mil millones de dólares en 2023, está experimentando un crecimiento notable, particularmente en el segmento de Metodología de Pruebas. Este segmento incluye principalmente pruebas manuales y pruebas automatizadas, las cuales son esenciales para garantizar la calidad y funcionalidad del software. Las pruebas manuales juegan un papel crucial, ya que permiten a los evaluadores evaluar aplicaciones desde la perspectiva del usuario, lo que las hace importantes para escenarios donde la experiencia del usuario es primordial. Por otro lado, las Pruebas Automatizadas están adquiriendo una importancia creciente debido a la eficiencia que ofrece en procesos de pruebas repetitivos, ayudando a las organizaciones a ahorrar tiempo y reducir los errores humanos. A medida que crece la demanda de lanzamientos de software más rápidos, se espera que las pruebas automatizadas dominen el mercado debido a su capacidad para manejar grandes volúmenes de pruebas de forma rápida y consistente. El crecimiento del mercado se ve respaldado aún más por la creciente complejidad de las aplicaciones y la necesidad de actualizaciones frecuentes, lo que crea amplias oportunidades para ambas metodologías. La segmentación del mercado de servicios de pruebas de software muestra la relevancia de estas metodologías para abordar distintas necesidades dentro del ciclo de vida del desarrollo de software y al mismo tiempo contribuir a mejorar la calidad general del producto.

    Información sobre el tipo de implementación del mercado de servicios de pruebas de software   >h3>

    El mercado de servicios de pruebas de software está experimentando un crecimiento significativo, con un valor de mercado de 43,15 mil millones de dólares en 2023. El segmento de tipo de implementación desempeña un papel crucial en este mercado, ya que abarca servicios de pruebas locales y basados ​​en la nube. Actualmente, las soluciones basadas en la nube están ganando terreno.ción debido a su escalabilidad, flexibilidad y rentabilidad, lo que los convierte en la opción preferida para muchas organizaciones. Esta tendencia muestra un cambio hacia metodologías de prueba más ágiles y adaptables, lo que subraya la importancia de las implementaciones basadas en la nube para satisfacer las demandas del desarrollo de software moderno. Alternativamente, los servicios locales continúan teniendo una participación significativa a medida que las organizaciones buscan un mayor control y seguridad sobre sus procesos de prueba. Este segmento es particularmente importante para sectores con requisitos regulatorios estrictos. A medida que las empresas adoptan cada vez más estrategias de transformación digital, se espera que la necesidad de soluciones de prueba de software eficientes en ambos tipos de implementación impulse el crecimiento dentro del mercado de servicios de prueba de software. En general, la segmentación del mercado de servicios de pruebas de software destaca el variado panorama de opciones de implementación, cada una de las cuales satisface las necesidades específicas de las empresas que se esfuerzan por garantizar la calidad de sus productos de software.

    Perspectivas de la industria sobre uso final del mercado de servicios de pruebas de software lapso>

    Se prevé que el mercado de servicios de pruebas de software alcance un valor de 43,15 mil millones de dólares en 2023, lo que refleja el crecimiento importancia de varias industrias de uso final para mejorar la calidad y confiabilidad del software. Cada industria aprovecha los servicios de prueba de software para garantizar la funcionalidad, la seguridad y el rendimiento de las aplicaciones. Los contribuyentes importantes, como TI y telecomunicaciones, requieren marcos de prueba sólidos para manejar las crecientes complejidades y los datos críticos. La atención médica, por otro lado, enfatiza el cumplimiento y la precisión, dando prioridad a los servicios de pruebas que salvaguardan la información del paciente. Mientras tanto, los sectores de Banca, Servicios Financieros y Seguros se centran en la seguridad y la gestión de riesgos, dada la sensibilidad de las transacciones financieras. Las entidades minoristas están adoptando cada vez más soluciones digitales y de automatización, lo que requiere procesos de prueba eficientes para mantener la experiencia del cliente. El sector manufacturero combina integraciones de hardware y software, destacando la necesidad de pruebas integrales que aseguren la calidad en todas las operaciones. Con el crecimiento previsto en estas industrias, la demanda de servicios de prueba de software eficaces continúa aumentando, impulsada por la necesidad de una mayor integración tecnológica y eficiencia operativa. Los datos del mercado de servicios de pruebas de software muestran un gran potencial, y las crecientes tendencias del mercado subrayan la importancia de las soluciones de pruebas especializadas para estos diversos sectores.

    Perspectivas regionales del mercado de servicios de pruebas de software

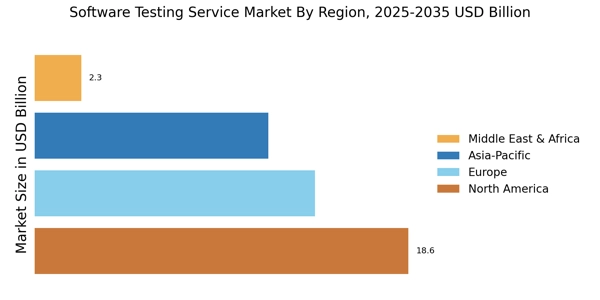
    Los ingresos del mercado de servicios de pruebas de software muestran un crecimiento significativo basado en la segmentación regional, con América del Norte a la cabeza. valorado en 20 mil millones de dólares en 2023. Esta región domina debido a su infraestructura tecnológica avanzada y su alta adopción de automatización en los servicios de prueba. Le sigue Europa con una valoración de 10.000 millones de dólares, lo que refleja su creciente énfasis en la calidad y el cumplimiento del software. La región APAC, valorada en 8 mil millones de dólares en 2023, se destaca por su panorama tecnológico en rápida expansión y su creciente demanda de software, lo que la convierte en un contribuyente importante al mercado. América del Sur, aunque más pequeña con 3.000 millones de dólares, está emergiendo con un enfoque en mejorar los servicios de TI y las capacidades de prueba. La región MEA, valorada en 2,15 mil millones de dólares, enfrenta desafíos pero ofrece oportunidades de crecimiento del mercado debido a las crecientes inversiones en tecnología. Las estadísticas del mercado de servicios de pruebas de software reflejan diversos factores de crecimiento en todas las regiones, incluida la transformación digital, la evolución de los estándares regulatorios y la creciente complejidad de los productos de software, lo que posiciona a estas regiones de manera única dentro del panorama general del mercado.

    Perspectivas regionales del mercado de servicios de pruebas de software

    Fuente: Investigación primaria, Investigación secundaria, Base de datos MRFR y revisión de analistas

    Servicio de pruebas de software Actores clave del mercado e información competitiva< /h3>

    El mercado de servicios de pruebas de software se caracteriza por una amplia gama de actores que ofrecen servicios vitales que garantizan los productos de software. cumplir con los estándares de calidad antes de llegar a los consumidores. Este mercado ha experimentado una expansión significativa, impulsada por la creciente demanda de aplicaciones de software en diversas industrias, incluidas la banca, las finanzas, la atención médica y el comercio minorista. Las empresas reconocen cada vez más la importancia de realizar pruebas sólidas de software para mitigar los riesgos asociados con las fallas del software y mejorar la satisfacción del usuario. El panorama competitivo está moldeado por los entrantes al mercado que aprovechan tecnologías innovadoras, como la inteligencia artificial y la automatización, para agilizar los procesos de prueba y mejorar la eficiencia. Este entorno dinámico requiere que los proveedores de servicios adapten continuamente sus estrategias para mantenerse a la vanguardia, centrándose en competencias como la automatización de pruebas, las pruebas en la nube y metodologías ágiles para satisfacer las necesidades cambiantes de sus clientes.

    IBM ocupa una posición destacada dentro del mercado de servicios de pruebas de software, mostrando una fuerte presencia en el mercado impulsada por su completa portafolio de servicios y soluciones. La experiencia de la empresa en pruebas de software abarca varias áreas clave, incluida la garantía de calidad de las aplicaciones, las pruebas de rendimiento y las pruebas continuas en entornos ágiles y DevOps. IBM se beneficia de sus amplias inversiones en investigación y desarrollo, lo que le permite integrar tecnologías emergentes en sus servicios de prueba. La fortaleza de IBM radica en su capacidad para aprovechar la inteligencia artificial, creando soluciones de prueba automatizadas que mejoran la eficiencia y la precisión. Además, el alcance global y los sólidos recursos técnicos de IBM le permiten satisfacer diversas necesidades de la industria, lo que la convierte en la opción preferida entre las empresas que se esfuerzan por mantener altos estándares de calidad de software.

    Wipro es otro competidor importante en el mercado de servicios de pruebas de software, reconocido por sus capacidades para ofrecer servicios de extremo a extremo. -servicios de pruebas finales. La fortaleza de la empresa radica en su amplia oferta de servicios que abarca pruebas funcionales, pruebas de seguridad y pruebas de cumplimiento, entre otras. Wipro enfatiza la integración de la automatización y la inteligencia artificial en sus procesos de prueba, lo que no solo acelera el cronograma de las pruebas sino que también aumenta la cobertura de las mismas. Además, el fuerte enfoque de Wipro en soluciones centradas en el cliente y su capacidad para adaptar los servicios de prueba para satisfacer los requisitos específicos del cliente mejoran su ventaja competitiva. El esfuerzo de Wipro por fomentar asociaciones y colaboraciones fortalece aún más su posición en el mercado, posicionándolo como un socio confiable para las organizaciones que buscan soluciones integrales de prueba de software que se alineen con sus objetivos comerciales.

    Las empresas clave en el mercado de servicios de pruebas de software incluyen< /h3>
    • IBM
    • Wipro
    • Telerik
    • Cognizant
    • Tecnologías HCL
    • Serco
    • Tecnología DXC
    • Capgemini
    • Qualitest
    • Atos
    • Mindtree
    • Tata Consultancy Services
    • Infosys
    • Accenture
    • Zensar Technologies

    Desarrollos de la industria del mercado de servicios de pruebas de software

    El mercado de servicios de pruebas de software ha experimentado actividades significativas en las últimas semanas, particularmente entre los principales actores como IBM, Wipro, Cognizant y Capgemini. IBM anunció recientemente mejoras en sus capacidades de prueba impulsadas por IA, cuyo objetivo es agilizar el proceso de prueba y mejorar la calidad del software. Wipro ha informado de una asociación estratégica con un proveedor líder en la nube para reforzar sus servicios de prueba para aplicaciones en la nube. En el ámbito de las fusiones y adquisiciones, Accenture ha adquirido con éxito una empresa especializada en pruebas de software, mejorando sus capacidades en soluciones de pruebas automatizadas. De manera similar, Tata Consultancy Services está en conversaciones sobre posibles colaboraciones para ampliar su cartera de servicios de prueba. El mercado ha experimentado una trayectoria de crecimiento positiva, impulsando una mayor demanda de servicios de prueba de software a medida que las empresas buscan garantizar la confiabilidad y el rendimiento de sus aplicaciones en medio de una rápida transformación digital. Jugadores como HCL Technologies e Infosys están ampliando sus operaciones para capitalizar esta tendencia ascendente, lo que refleja un panorama competitivo sólido centrado en la innovación, la eficiencia y la satisfacción del cliente. Se espera que las inversiones en tecnología y ofertas de servicios mejoradas impulsen aún más el crecimiento del mercado, impactando significativamente la forma en que las organizaciones abordan el desarrollo y las pruebas de software.

    Perspectivas de segmentación del mercado de servicios de pruebas de software

    • Servicio de pruebas de software Mercado Tipo de servicio Outlook
      • Pruebas funcionales
      • Pruebas de rendimiento
      • Pruebas de automatización
      • Pruebas de seguridad
    • Perspectivas de la metodología de pruebas del mercado del servicio de pruebas de software
      • Pruebas manuales
      • Pruebas automatizadas
    • Perspectiva del tipo de implementación del mercado del servicio de pruebas de software
      • On-Premises
      • Basado en la nube
    • Perspectivas de la industria de uso final del mercado de servicios de pruebas de software
      • TI y telecomunicaciones
      • Cuidado de la salud
      • Banca, servicios financieros y seguros
      • Venta minorista
      • Fabricación
    • Perspectiva regional del mercado de servicios de pruebas de software
      • América del Norte
      • Europa
      • América del Sur
      • Asia Pacífico
      • Medio Oriente y África
    ÍNDICE


    1. RESUMEN EJECUTIVO
    1.1. Descripción general del mercado
    1.2. Hallazgos clave
    1.3. Segmentación del mercado
    1.4. Panorama Competitivo
    1.5. Retos y Oportunidades
    1.6. Perspectivas futuras


    2. INTRODUCCIÓN AL MERCADO
    2.1. Definición
    2.2. Alcance del estudio
    2.2.1. Objetivo de la investigación
    2.2.2. Supuesto
    2.2.3. Limitaciones
    3. METODOLOGÍA DE LA INVESTIGACIÓN
    3.1. Descripción general
    3.2. Minería de datos
    3.3. Investigación Secundaria
    3.4. Investigación Primaria
    3.4.1. Entrevistas primarias y proceso de recopilación de información
    3.4.2. Desglose de los encuestados principales
    3.5. Modelo de previsión
    3.6. Estimación del tamaño del mercado
    3.6.1. Enfoque ascendente
    3.6.2. Enfoque de arriba hacia abajo
    3.7. Triangulación de datos
    3.8. Validación


    4. DINÁMICA DEL MERCADO
    4.1. Descripción general
    4.2. Conductores
    4.3. Restricciones
    4.4. Oportunidades
    5. ANÁLISIS DE FACTORES DE MERCADO
    5.1. Análisis de la cadena de valor
    5.2. Análisis de las cinco fuerzas de Porter
    5.2.1. Poder de negociación de los proveedores
    5.2.2. Poder de negociación de los compradores
    5.2.3. Amenaza de nuevos participantes
    5.2.4. Amenaza de sustitutos
    5.2.5. Intensidad de la rivalidad
    5.3. Análisis de impacto de COVID-19
    5.3.1. Análisis de Impacto en el Mercado
    5.3.2. Impacto Regional
    5.3.3. Análisis de oportunidades y amenazas


    6. MERCADO DE SERVICIOS DE PRUEBAS DE SOFTWARE, POR TIPO DE SERVICIO (MILLONES DE USD)
    6.1. Pruebas funcionales
    6.2. Pruebas de rendimiento
    6.3. Pruebas de automatización
    6.4. Pruebas de seguridad
    7. MERCADO DE SERVICIOS DE PRUEBAS DE SOFTWARE, POR METODOLOGÍA DE PRUEBAS (MILLONES DE USD)
    7.1. Pruebas manuales
    7.2. Pruebas automatizadas
    8. MERCADO DE SERVICIOS DE PRUEBAS DE SOFTWARE, POR TIPO DE IMPLEMENTACIÓN (MILLONES DE USD)
    8.1. Local
    8.2. Basado en la nube
    9. MERCADO DE SERVICIOS DE PRUEBAS DE SOFTWARE, POR INDUSTRIA DE USO FINAL (MILLONES DE USD)
    9.1. TI y Telecomunicaciones
    9.2. Atención sanitaria
    9.3. Banca, Servicios Financieros y Seguros
    9.4. Comercio minorista
    9.5. Fabricación
    10. MERCADO DE SERVICIOS DE PRUEBAS DE SOFTWARE, POR REGIONAL (MILLONES DE USD)
    10.1. América del Norte
    10.1.1. Estados Unidos
    10.1.2. Canadá
    10.2. Europa
    10.2.1. Alemania
    10.2.2. Reino Unido
    10.2.3. Francia
    10.2.4. Rusia
    10.2.5. Italia
    10.2.6. España
    10.2.7. Resto de Europa
    10.3. Asia Pacífico
    10.3.1. China
    10.3.2. India
    10.3.3. Japón
    10.3.4. Corea del Sur
    10.3.5. Malasia
    10.3.6. Tailandia
    10.3.7. Indonesia
    10.3.8. Resto de APAC
    10.4. América del Sur
    10.4.1. Brasil
    10.4.2. México
    10.4.3. Argentina
    10.4.4. Resto de Sudamérica
    10.5. AMUMA
    10.5.1. Países del CCG
    10.5.2. Sudáfrica
    10.5.3. Resto de MEA


    11. PANORAMA COMPETITIVO
    11.1. Descripción general
    11.2. Análisis Competitivo
    11.3. Análisis de cuota de mercado
    11.4. Importante estrategia de crecimiento en el mercado de servicios de pruebas de software
    11.5. Benchmarking competitivo
    11.6. Actores líderes en términos de número de desarrollos en el mercado de servicios de prueba de software
    11.7. Desarrollos clave y estrategias de crecimiento
    11.7.1. Lanzamiento de nuevos productos/implementación de servicios
    11.7.2. Fusión y Adquisiciones
    11.7.3. Empresas conjuntas
    11.8. Matriz financiera de los principales actores
    11.8.1. Ventas e ingresos operativos
    11.8.2. Gasto en I+D de los principales actores. 2023
    12. PERFILES DE LA EMPRESA
    12.1. IBM
    12.1.1. Panorama financiero
    12.1.2. Productos Ofrecidos
    12.1.3. Desarrollos clave
    12.1.4. Análisis FODA
    12.1.5. Estrategias clave
    12.2. Wipro
    12.2.1. Panorama financiero
    12.2.2. Productos Ofrecidos
    12.2.3. Desarrollos clave
    12.2.4. Análisis FODA
    12.2.5. Estrategias clave
    12.3. Telerik
    12.3.1. Panorama financiero
    12.3.2. Productos Ofrecidos
    12.3.3. Desarrollos clave
    12.3.4. Análisis FODA
    12.3.5. Estrategias clave
    12.4. Consciente
    12.4.1. Panorama financiero
    12.4.2. Productos Ofrecidos
    12.4.3. Desarrollos clave
    12.4.4. Análisis FODA
    12.4.5. Estrategias clave
    12.5. Tecnologías HCL
    12.5.1. Panorama financiero
    12.5.2. Productos ofrecidos
    12.5.3. Desarrollos clave
    12.5.4. Análisis FODA
    12.5.5. Estrategias clave
    12.6. Serco
    12.6.1. Panorama financiero
    12.6.2. Productos ofrecidos
    12.6.3. Desarrollos clave
    12.6.4. Análisis FODA
    12.6.5. Estrategias clave
    12.7. Tecnología DXC
    12.7.1. Panorama financiero
    12.7.2. Productos ofrecidos
    12.7.3. Desarrollos clave
    12.7.4. Análisis FODA
    12.7.5. Estrategias clave
    12.8. Capgemini
    12.8.1. Panorama financiero
    12.8.2. Productos ofrecidos
    12.8.3. Desarrollos clave
    12.8.4. Análisis FODA
    12.8.5. Estrategias clave
    12.9. Prueba de calidad
    12.9.1. Panorama financiero
    12.9.2. Productos ofrecidos
    12.9.3. Desarrollos clave
    12.9.4. Análisis FODA
    12.9.5. Estrategias clave
    12.10. Atos
    12.10.1. Panorama financiero
    12.10.2. Productos Ofrecidos
    12.10.3. Desarrollos clave
    12.10.4. Análisis FODA
    12.10.5. Estrategias clave
    12.11. Árbol mental
    12.11.1. Panorama financiero
    12.11.2. Productos Ofrecidos
    12.11.3. Desarrollos clave
    12.11.4. Análisis FODA
    12.11.5. Estrategias clave
    12.12. Servicios de consultoría Tata
    12.12.1. Panorama financiero
    12.12.2. Productos Ofrecidos
    12.12.3. Desarrollos clave
    12.12.4. Análisis FODA
    12.12.5. Estrategias clave
    12.13. Infosys
    12.13.1. Panorama financiero
    12.13.2. Productos Ofrecidos
    12.13.3. Desarrollos clave
    12.13.4. Análisis FODA
    12.13.5. Estrategias clave
    12.14. Accenture
    12.14.1. Panorama financiero
    12.14.2. Productos Ofrecidos
    12.14.3. Desarrollos clave
    12.14.4. Análisis FODA
    12.14.5. Estrategias clave
    12.15. Tecnologías Zensar
    12.15.1. Panorama financiero
    12.15.2. Productos ofrecidos
    12.15.3. Desarrollos clave
    12.15.4. Análisis FODA
    12.15.5. Estrategias clave
    13. APÉNDICE
    13.1. Referencias
    13.2. Informes relacionados
    LISTA DE TABLAS

    TABLA 1. LISTA DE SUPUESTOS
    TABLA 2. ESTIMACIONES Y ESTIMACIONES DEL TAMAÑO DEL MERCADO DE SERVICIOS DE PRUEBAS DE SOFTWARE DE AMÉRICA DEL NORTE. PRONÓSTICO, POR TIPO DE SERVICIO, 2019-2032 (MILES DE MILLONES DE USD)
    TABLA 3. ESTIMACIONES Y ESTIMACIONES DEL TAMAÑO DEL MERCADO DE SERVICIOS DE PRUEBAS DE SOFTWARE DE AMÉRICA DEL NORTE. PRONÓSTICO, POR METODOLOGÍA DE PRUEBAS, 2019-2032 (MILES DE MILLONES DE USD)
    TABLA 4. ESTIMACIONES Y ESTIMACIONES DEL TAMAÑO DEL MERCADO DE SERVICIOS DE PRUEBAS DE SOFTWARE DE AMÉRICA DEL NORTE. PRONÓSTICO, POR TIPO DE IMPLEMENTACIÓN, 2019-2032 (MILES DE MILLONES DE USD)
    TABLA 5. ESTIMACIONES Y ESTIMACIONES DEL TAMAÑO DEL MERCADO DE SERVICIOS DE PRUEBAS DE SOFTWARE DE AMÉRICA DEL NORTE. PRONÓSTICO, POR INDUSTRIA DE USO FINAL, 2019-2032 (MILES DE MILLONES DE USD)
    TABLA 6. ESTIMACIONES Y ESTIMACIONES DEL TAMAÑO DEL MERCADO DE SERVICIOS DE PRUEBAS DE SOFTWARE DE AMÉRICA DEL NORTE. PRONÓSTICO, POR REGIONAL, 2019-2032 (MILES DE MILLONES DE USD)
    TABLA 7. ESTIMACIONES Y PROYECTOS DEL TAMAÑO DEL MERCADO DE SERVICIOS DE PRUEBAS DE SOFTWARE DE EE. UU. PRONÓSTICO, POR TIPO DE SERVICIO, 2019-2032 (MILES DE MILLONES DE USD)
    TABLA 8. ESTIMACIONES Y PROYECTOS DEL TAMAÑO DEL MERCADO DE SERVICIOS DE PRUEBAS DE SOFTWARE DE EE. UU. PRONÓSTICO, POR METODOLOGÍA DE PRUEBAS, 2019-2032 (MILES DE MILLONES DE USD)
    TABLA 9. ESTIMACIONES Y PROYECTOS DEL TAMAÑO DEL MERCADO DE SERVICIOS DE PRUEBAS DE SOFTWARE DE EE. UU. PRONÓSTICO, POR TIPO DE IMPLEMENTACIÓN, 2019-2032 (MILES DE MILLONES DE USD)
    TABLA 10. ESTIMACIONES Y PROYECTOS DEL TAMAÑO DEL MERCADO DE SERVICIOS DE PRUEBAS DE SOFTWARE DE EE. UU. PRONÓSTICO, POR INDUSTRIA DE USO FINAL, 2019-2032 (MILES DE MILLONES DE USD)
    TABLA 11. ESTIMACIONES Y POTENCIA DEL TAMAÑO DEL MERCADO DE SERVICIOS DE PRUEBAS DE SOFTWARE DE EE. UU. PRONÓSTICO, POR REGIONAL, 2019-2032 (MILES DE MILLONES DE USD)
    TABLA 12. ESTIMACIONES Y POTENCIA DEL TAMAÑO DEL MERCADO DE SERVICIOS DE PRUEBAS DE SOFTWARE DE CANADÁ. PRONÓSTICO, POR TIPO DE SERVICIO, 2019-2032 (MILES DE MILLONES DE USD)
    TABLA 13. ESTIMACIONES Y POTENCIA DEL TAMAÑO DEL MERCADO DE SERVICIOS DE PRUEBAS DE SOFTWARE DE CANADÁ. PRONÓSTICO, POR METODOLOGÍA DE PRUEBAS, 2019-2032 (MILES DE MILLONES DE USD)
    TABLA 14. ESTIMACIONES Y PROYECTOS DEL TAMAÑO DEL MERCADO DE SERVICIOS DE PRUEBAS DE SOFTWARE DE CANADÁ. PRONÓSTICO, POR TIPO DE IMPLEMENTACIÓN, 2019-2032 (MILES DE MILLONES DE USD)
    TABLA 15. ESTIMACIONES Y POTENCIA DEL TAMAÑO DEL MERCADO DE SERVICIOS DE PRUEBAS DE SOFTWARE DE CANADÁ. PRONÓSTICO, POR INDUSTRIA DE USO FINAL, 2019-2032 (MILES DE MILLONES DE USD)
    TABLA 16. ESTIMACIONES Y POTENCIAS DEL TAMAÑO DEL MERCADO DE SERVICIOS DE PRUEBAS DE SOFTWARE DE CANADÁ. PRONÓSTICO, POR REGIONAL, 2019-2032 (MILES DE MILLONES DE USD)
    TABLA 17. ESTIMACIONES Y EMPRESAS DEL TAMAÑO DEL MERCADO DE SERVICIOS DE PRUEBAS DE SOFTWARE EN EUROPA. PRONÓSTICO, POR TIPO DE SERVICIO, 2019-2032 (MILES DE MILLONES DE USD)
    TABLA 18. ESTIMACIONES Y POTENCIA DEL TAMAÑO DEL MERCADO DE SERVICIOS DE PRUEBAS DE SOFTWARE EN EUROPA. PRONÓSTICO, POR METODOLOGÍA DE PRUEBAS, 2019-2032 (MILES DE MILLONES DE USD)
    TABLA 19. ESTIMACIONES Y POTENCIAS DEL TAMAÑO DEL MERCADO DE SERVICIOS DE PRUEBAS DE SOFTWARE EN EUROPA. PRONÓSTICO, POR TIPO DE IMPLEMENTACIÓN, 2019-2032 (MILES DE MILLONES DE USD)
    TABLA 20. ESTIMACIONES Y POTENCIA DEL TAMAÑO DEL MERCADO DE SERVICIOS DE PRUEBAS DE SOFTWARE EN EUROPA. PRONÓSTICO, POR INDUSTRIA DE USO FINAL, 2019-2032 (MILES DE MILLONES DE USD)
    TABLA 21. ESTIMACIONES Y POTENCIA DEL TAMAÑO DEL MERCADO DE SERVICIOS DE PRUEBAS DE SOFTWARE EN EUROPA. PRONÓSTICO, POR REGIONAL, 2019-2032 (MILES DE MILLONES DE USD)
    TABLA 22. ESTIMACIONES Y POTENCIA DEL TAMAÑO DEL MERCADO DE SERVICIOS DE PRUEBAS DE SOFTWARE DE ALEMANIA. PRONÓSTICO, POR TIPO DE SERVICIO, 2019-2032 (MILES DE MILLONES DE USD)
    TABLA 23. ESTIMACIONES Y PRONÓSTICOS DEL TAMAÑO DEL MERCADO DE SERVICIOS DE PRUEBAS DE SOFTWARE DE ALEMANIA. PRONÓSTICO, POR METODOLOGÍA DE PRUEBAS, 2019-2032 (MILES DE MILLONES DE USD)
    TABLA 24. ESTIMACIONES Y PROYECTOS DEL TAMAÑO DEL MERCADO DE SERVICIOS DE PRUEBAS DE SOFTWARE DE ALEMANIA. PRONÓSTICO, POR TIPO DE IMPLEMENTACIÓN, 2019-2032 (MILES DE MILLONES DE USD)
    TABLA 25. ESTIMACIONES Y EMPRESAS DEL TAMAÑO DEL MERCADO DE SERVICIOS DE PRUEBAS DE SOFTWARE DE ALEMANIA. PRONÓSTICO, POR INDUSTRIA DE USO FINAL, 2019-2032 (MILES DE MILLONES DE USD)
    TABLA 26. ESTIMACIONES Y EMPRESAS DEL TAMAÑO DEL MERCADO DE SERVICIOS DE PRUEBAS DE SOFTWARE DE ALEMANIA. PRONÓSTICO, POR REGIONAL, 2019-2032 (MILES DE MILLONES DE USD)
    TABLA 27. ESTIMACIONES Y POTENCIA DEL TAMAÑO DEL MERCADO DE SERVICIOS DE PRUEBAS DE SOFTWARE DEL REINO UNIDO. PRONÓSTICO, POR TIPO DE SERVICIO, 2019-2032 (MILES DE MILLONES DE USD)
    TABLA 28. ESTIMACIONES Y PREVISIÓN DEL TAMAÑO DEL MERCADO DE SERVICIOS DE PRUEBAS DE SOFTWARE DEL REINO UNIDO. PRONÓSTICO, POR METODOLOGÍA DE PRUEBAS, 2019-2032 (MILES DE MILLONES DE USD)
    TABLA 29. ESTIMACIONES Y POTENCIA DEL TAMAÑO DEL MERCADO DE SERVICIOS DE PRUEBAS DE SOFTWARE DEL REINO UNIDO. PRONÓSTICO, POR TIPO DE IMPLEMENTACIÓN, 2019-2032 (MILES DE MILLONES DE USD)
    TABLA 30. ESTIMACIONES Y POTENCIA DEL TAMAÑO DEL MERCADO DE SERVICIOS DE PRUEBAS DE SOFTWARE DEL REINO UNIDO. PRONÓSTICO, POR INDUSTRIA DE USO FINAL, 2019-2032 (MILES DE MILLONES DE USD)
    TABLA 31. ESTIMACIONES Y POTENCIA DEL TAMAÑO DEL MERCADO DE SERVICIOS DE PRUEBAS DE SOFTWARE DEL REINO UNIDO. PRONÓSTICO, POR REGIONAL, 2019-2032 (MILES DE MILLONES DE USD)
    TABLA 32. ESTIMACIONES Y EMPRESAS DEL TAMAÑO DEL MERCADO DE SERVICIOS DE PRUEBAS DE SOFTWARE EN FRANCIA. PRONÓSTICO, POR TIPO DE SERVICIO, 2019-2032 (MILES DE MILLONES DE USD)
    TABLA 33. ESTIMACIONES Y POTENCIA DEL TAMAÑO DEL MERCADO DE SERVICIOS DE PRUEBAS DE SOFTWARE EN FRANCIA. PRONÓSTICO, POR METODOLOGÍA DE PRUEBAS, 2019-2032 (MILES DE MILLONES DE USD)
    TABLA 34. ESTIMACIONES Y POTENCIA DEL TAMAÑO DEL MERCADO DE SERVICIOS DE PRUEBAS DE SOFTWARE EN FRANCIA. PRONÓSTICO, POR TIPO DE IMPLEMENTACIÓN, 2019-2032 (MILES DE MILLONES DE USD)
    TABLA 35. ESTIMACIONES Y EMPRESAS DEL TAMAÑO DEL MERCADO DE SERVICIOS DE PRUEBAS DE SOFTWARE EN FRANCIA. PRONÓSTICO, POR INDUSTRIA DE USO FINAL, 2019-2032 (MILES DE MILLONES DE USD)
    TABLA 36. ESTIMACIONES Y EMPRESAS DEL TAMAÑO DEL MERCADO DE SERVICIOS DE PRUEBAS DE SOFTWARE EN FRANCIA. PRONÓSTICO, POR REGIONAL, 2019-2032 (MILES DE MILLONES DE USD)
    TABLA 37. ESTIMACIONES Y POTENCIA DEL TAMAÑO DEL MERCADO DE SERVICIOS DE PRUEBAS DE SOFTWARE DE RUSIA. PRONÓSTICO, POR TIPO DE SERVICIO, 2019-2032 (MILES DE MILLONES DE USD)
    TABLA 38. ESTIMACIONES Y PRONÓSTICOS DEL TAMAÑO DEL MERCADO DE SERVICIOS DE PRUEBAS DE SOFTWARE DE RUSIA. PRONÓSTICO, POR METODOLOGÍA DE PRUEBAS, 2019-2032 (MILES DE MILLONES DE USD)
    TABLA 39. ESTIMACIONES Y PROYECTOS DEL TAMAÑO DEL MERCADO DE SERVICIOS DE PRUEBAS DE SOFTWARE DE RUSIA. PRONÓSTICO, POR TIPO DE IMPLEMENTACIÓN, 2019-2032 (MILES DE MILLONES DE USD)
    TABLA 40. ESTIMACIONES Y PROYECTOS DEL TAMAÑO DEL MERCADO DE SERVICIOS DE PRUEBAS DE SOFTWARE DE RUSIA. PRONÓSTICO, POR INDUSTRIA DE USO FINAL, 2019-2032 (MILES DE MILLONES DE USD)
    TABLA 41. ESTIMACIONES Y PROYECTOS DEL TAMAÑO DEL MERCADO DE SERVICIOS DE PRUEBAS DE SOFTWARE DE RUSIA. PRONÓSTICO, POR REGIONAL, 2019-2032 (MILES DE MILLONES DE USD)
    TABLA 42. ESTIMACIONES Y EMPRESAS DEL TAMAÑO DEL MERCADO DE SERVICIOS DE PRUEBAS DE SOFTWARE DE ITALIA. PRONÓSTICO, POR TIPO DE SERVICIO, 2019-2032 (MILES DE MILLONES DE USD)
    TABLA 43. ESTIMACIONES Y POTENCIA DEL TAMAÑO DEL MERCADO DE SERVICIOS DE PRUEBAS DE SOFTWARE DE ITALIA. PRONÓSTICO, POR METODOLOGÍA DE PRUEBAS, 2019-2032 (MILES DE MILLONES DE USD)
    TABLA 44. ESTIMACIONES Y PROYECTOS DEL TAMAÑO DEL MERCADO DE SERVICIOS DE PRUEBAS DE SOFTWARE DE ITALIA. PRONÓSTICO, POR TIPO DE IMPLEMENTACIÓN, 2019-2032 (MILES DE MILLONES DE USD)
    TABLA 45. ESTIMACIONES Y EMPRESAS DEL TAMAÑO DEL MERCADO DE SERVICIOS DE PRUEBAS DE SOFTWARE DE ITALIA. PRONÓSTICO, POR INDUSTRIA DE USO FINAL, 2019-2032 (MILES DE MILLONES DE USD)
    TABLA 46. ESTIMACIONES Y EMPRESAS DEL TAMAÑO DEL MERCADO DE SERVICIOS DE PRUEBAS DE SOFTWARE DE ITALIA. PRONÓSTICO, POR REGIONAL, 2019-2032 (MILES DE MILLONES DE USD)
    TABLA 47. ESTIMACIONES Y EMPRESAS DEL TAMAÑO DEL MERCADO DE SERVICIOS DE PRUEBAS DE SOFTWARE EN ESPAÑA. PRONÓSTICO, POR TIPO DE SERVICIO, 2019-2032 (MILES DE MILLONES DE USD)
    TABLA 48. ESTIMACIONES Y ESTIMACIONES DEL TAMAÑO DEL MERCADO DE SERVICIOS DE PRUEBAS DE SOFTWARE EN ESPAÑA. PRONÓSTICO, POR METODOLOGÍA DE PRUEBAS, 2019-2032 (MILES DE MILLONES DE USD)
    TABLA 49. ESTIMACIONES Y ESTIMACIONES DEL TAMAÑO DEL MERCADO DE SERVICIOS DE PRUEBAS DE SOFTWARE EN ESPAÑA. PRONÓSTICO, POR TIPO DE IMPLEMENTACIÓN, 2019-2032 (MILES DE MILLONES DE USD)
    TABLA 50. ESTIMACIONES Y EMPRESAS DEL TAMAÑO DEL MERCADO DE SERVICIOS DE PRUEBAS DE SOFTWARE EN ESPAÑA. PRONÓSTICO, POR INDUSTRIA DE USO FINAL, 2019-2032 (MILES DE MILLONES DE USD)
    TABLA 51. ESTIMACIONES Y EMPRESAS DEL TAMAÑO DEL MERCADO DE SERVICIOS DE PRUEBAS DE SOFTWARE EN ESPAÑA. PRONÓSTICO, POR REGIONAL, 2019-2032 (MILES DE MILLONES DE USD)
    TABLA 52. ESTIMACIONES Y ESTIMACIONES DEL TAMAÑO DEL MERCADO DE SERVICIOS DE PRUEBAS DE SOFTWARE PARA EL RESTO DE EUROPA. PRONÓSTICO, POR TIPO DE SERVICIO, 2019-2032 (MILES DE MILLONES DE USD)
    TABLA 53. ESTIMACIONES Y PROYECTOS DEL TAMAÑO DEL MERCADO DE SERVICIOS DE PRUEBAS DE SOFTWARE PARA EL RESTO DE EUROPA. PRONÓSTICO, POR METODOLOGÍA DE PRUEBAS, 2019-2032 (MILES DE MILLONES DE USD)
    TABLA 54. ESTIMACIONES Y PROYECTOS DEL TAMAÑO DEL MERCADO DE SERVICIOS DE PRUEBAS DE SOFTWARE DEL RESTO DE EUROPA. PRONÓSTICO, POR TIPO DE IMPLEMENTACIÓN, 2019-2032 (MILES DE MILLONES DE USD)
    TABLA 55. ESTIMACIONES Y PROYECTOS DEL TAMAÑO DEL MERCADO DE SERVICIOS DE PRUEBAS DE SOFTWARE PARA EL RESTO DE EUROPA. PRONÓSTICO, POR INDUSTRIA DE USO FINAL, 2019-2032 (MILES DE MILLONES DE USD)
    TABLA 56. ESTIMACIONES Y EMPRESAS DEL TAMAÑO DEL MERCADO DE SERVICIOS DE PRUEBAS DE SOFTWARE PARA EL RESTO DE EUROPA. PRONÓSTICO, POR REGIONAL, 2019-2032 (MILES DE MILLONES DE USD)
    TABLA 57. ESTIMACIONES Y PROYECTOS DEL TAMAÑO DEL MERCADO DE SERVICIOS DE PRUEBAS DE SOFTWARE DE APAC. PRONÓSTICO, POR TIPO DE SERVICIO, 2019-2032 (MILES DE MILLONES DE USD)
    TABLA 58. ESTIMACIONES Y POTENCIA DEL TAMAÑO DEL MERCADO DE SERVICIOS DE PRUEBAS DE SOFTWARE DE APAC. PRONÓSTICO, POR METODOLOGÍA DE PRUEBAS, 2019-2032 (MILES DE MILLONES DE USD)
    TABLA 59. ESTIMACIONES Y PRONÓSTICOS DEL TAMAÑO DEL MERCADO DE SERVICIOS DE PRUEBAS DE SOFTWARE DE APAC. PRONÓSTICO, POR TIPO DE IMPLEMENTACIÓN, 2019-2032 (MILES DE MILLONES DE USD)
    TABLA 60. ESTIMACIONES Y POTENCIA DEL TAMAÑO DEL MERCADO DE SERVICIOS DE PRUEBAS DE SOFTWARE DE APAC. PRONÓSTICO, POR INDUSTRIA DE USO FINAL, 2019-2032 (MILES DE MILLONES DE USD)
    TABLA 61. ESTIMACIONES Y POTENCIA DEL TAMAÑO DEL MERCADO DE SERVICIOS DE PRUEBAS DE SOFTWARE DE APAC. PRONÓSTICO, POR REGIONAL, 2019-2032 (MILES DE MILLONES DE USD)
    TABLA 62. ESTIMACIONES Y POTENCIA DEL TAMAÑO DEL MERCADO DE SERVICIOS DE PRUEBAS DE SOFTWARE DE CHINA. PRONÓSTICO, POR TIPO DE SERVICIO, 2019-2032 (MILES DE MILLONES DE USD)
    TABLA 63. ESTIMACIONES Y PRONÓSTICOS DEL TAMAÑO DEL MERCADO DE SERVICIOS DE PRUEBAS DE SOFTWARE DE CHINA. PRONÓSTICO, POR METODOLOGÍA DE PRUEBAS, 2019-2032 (MILES DE MILLONES DE USD)
    TABLA 64. ESTIMACIONES Y PROYECTOS DEL TAMAÑO DEL MERCADO DE SERVICIOS DE PRUEBAS DE SOFTWARE DE CHINA. PRONÓSTICO, POR TIPO DE IMPLEMENTACIÓN, 2019-2032 (MILES DE MILLONES DE USD)
    TABLA 65. ESTIMACIONES Y PROYECTOS DEL TAMAÑO DEL MERCADO DE SERVICIOS DE PRUEBAS DE SOFTWARE DE CHINA. PRONÓSTICO, POR INDUSTRIA DE USO FINAL, 2019-2032 (MILES DE MILLONES DE USD)
    TABLA 66. ESTIMACIONES Y POTENCIAS DEL TAMAÑO DEL MERCADO DE SERVICIOS DE PRUEBAS DE SOFTWARE DE CHINA. PRONÓSTICO, POR REGIONAL, 2019-2032 (MILES DE MILLONES DE USD)
    TABLA 67. ESTIMACIONES Y PROYECTOS DEL TAMAÑO DEL MERCADO DE SERVICIOS DE PRUEBAS DE SOFTWARE DE LA INDIA. PRONÓSTICO, POR TIPO DE SERVICIO, 2019-2032 (MILES DE MILLONES DE USD)
    TABLA 68. ESTIMACIONES Y POTENCIA DEL TAMAÑO DEL MERCADO DE SERVICIOS DE PRUEBAS DE SOFTWARE DE LA INDIA. PRONÓSTICO, POR METODOLOGÍA DE PRUEBAS, 2019-2032 (MILES DE MILLONES DE USD)
    TABLA 69. ESTIMACIONES Y PROYECTOS DEL TAMAÑO DEL MERCADO DE SERVICIOS DE PRUEBAS DE SOFTWARE DE LA INDIA. PRONÓSTICO, POR TIPO DE IMPLEMENTACIÓN, 2019-2032 (MILES DE MILLONES DE USD)
    TABLA 70. ESTIMACIONES Y POTENCIA DEL TAMAÑO DEL MERCADO DE SERVICIOS DE PRUEBAS DE SOFTWARE DE LA INDIA. PRONÓSTICO, POR INDUSTRIA DE USO FINAL, 2019-2032 (MILES DE MILLONES DE USD)
    TABLA 71. ESTIMACIONES Y POTENCIA DEL TAMAÑO DEL MERCADO DE SERVICIOS DE PRUEBAS DE SOFTWARE DE LA INDIA. PRONÓSTICO, POR REGIONAL, 2019-2032 (MILES DE MILLONES DE USD)
    TABLA 72. ESTIMACIONES Y POTENCIA DEL TAMAÑO DEL MERCADO DE SERVICIOS DE PRUEBAS DE SOFTWARE DE JAPÓN. PRONÓSTICO, POR TIPO DE SERVICIO, 2019-2032 (MILES DE MILLONES DE USD)
    TABLA 73. ESTIMACIONES Y PRONÓSTICOS DEL TAMAÑO DEL MERCADO DE SERVICIOS DE PRUEBAS DE SOFTWARE EN JAPÓN. PRONÓSTICO, POR METODOLOGÍA DE PRUEBAS, 2019-2032 (MILES DE MILLONES DE USD)
    TABLA 74. ESTIMACIONES Y POTENCIA DEL TAMAÑO DEL MERCADO DE SERVICIOS DE PRUEBAS DE SOFTWARE DE JAPÓN. PRONÓSTICO, POR TIPO DE IMPLEMENTACIÓN, 2019-2032 (MILES DE MILLONES DE USD)
    TABLA 75. ESTIMACIONES Y POTENCIA DEL TAMAÑO DEL MERCADO DE SERVICIOS DE PRUEBAS DE SOFTWARE EN JAPÓN. PRONÓSTICO, POR INDUSTRIA DE USO FINAL, 2019-2032 (MILES DE MILLONES DE USD)
    TABLA 76. ESTIMACIONES Y POTENCIA DEL TAMAÑO DEL MERCADO DE SERVICIOS DE PRUEBAS DE SOFTWARE DE JAPÓN. PRONÓSTICO, POR REGIONAL, 2019-2032 (MILES DE MILLONES DE USD)
    TABLA 77. ESTIMACIONES Y PROYECTOS DEL TAMAÑO DEL MERCADO DE SERVICIOS DE PRUEBAS DE SOFTWARE DE COREA DEL SUR. PRONÓSTICO, POR TIPO DE SERVICIO, 2019-2032 (MILES DE MILLONES DE USD)
    TABLA 78. ESTIMACIONES Y ESTIMACIONES DEL TAMAÑO DEL MERCADO DE SERVICIOS DE PRUEBAS DE SOFTWARE DE COREA DEL SUR. PRONÓSTICO, POR METODOLOGÍA DE PRUEBAS, 2019-2032 (MILES DE MILLONES DE USD)
    TABLA 79. ESTIMACIONES Y ESTIMACIONES DEL TAMAÑO DEL MERCADO DE SERVICIOS DE PRUEBAS DE SOFTWARE DE COREA DEL SUR. PRONÓSTICO, POR TIPO DE IMPLEMENTACIÓN, 2019-2032 (MILES DE MILLONES DE USD)
    TABLA 80. ESTIMACIONES Y ESTIMACIONES DEL TAMAÑO DEL MERCADO DE SERVICIOS DE PRUEBAS DE SOFTWARE DE COREA DEL SUR. PRONÓSTICO, POR INDUSTRIA DE USO FINAL, 2019-2032 (MILES DE MILLONES DE USD)
    TABLA 81. ESTIMACIONES Y ESTIMACIONES DEL TAMAÑO DEL MERCADO DE SERVICIOS DE PRUEBAS DE SOFTWARE DE COREA DEL SUR. PRONÓSTICO, POR REGIONAL, 2019-2032 (MILES DE MILLONES DE USD)
    TABLA 82. ESTIMACIONES Y PROYECTOS DEL TAMAÑO DEL MERCADO DE SERVICIOS DE PRUEBAS DE SOFTWARE DE MALASIA. PRONÓSTICO, POR TIPO DE SERVICIO, 2019-2032 (MILES DE MILLONES DE USD)
    TABLA 83. ESTIMACIONES Y PRONÓSTICOS DEL TAMAÑO DEL MERCADO DE SERVICIOS DE PRUEBAS DE SOFTWARE DE MALASIA. PRONÓSTICO, POR METODOLOGÍA DE PRUEBAS, 2019-2032 (MILES DE MILLONES DE USD)
    TABLA 84. ESTIMACIONES Y PROYECTOS DEL TAMAÑO DEL MERCADO DE SERVICIOS DE PRUEBAS DE SOFTWARE DE MALASIA. PRONÓSTICO, POR TIPO DE IMPLEMENTACIÓN, 2019-2032 (MILES DE MILLONES DE USD)
    TABLA 85. ESTIMACIONES Y ESTIMACIONES DEL TAMAÑO DEL MERCADO DE SERVICIOS DE PRUEBAS DE SOFTWARE DE MALASIA. PRONÓSTICO, POR INDUSTRIA DE USO FINAL, 2019-2032 (MILES DE MILLONES DE USD)
    TABLA 86. ESTIMACIONES Y PROYECTOS DEL TAMAÑO DEL MERCADO DE SERVICIOS DE PRUEBAS DE SOFTWARE DE MALASIA. PRONÓSTICO, POR REGIONAL, 2019-2032 (MILES DE MILLONES DE USD)
    TABLA 87. ESTIMACIONES Y POTENCIA DEL TAMAÑO DEL MERCADO DE SERVICIOS DE PRUEBAS DE SOFTWARE DE TAILANDIA. PRONÓSTICO, POR TIPO DE SERVICIO, 2019-2032 (MILES DE MILLONES DE USD)
    TABLA 88. ESTIMACIONES Y PRONÓSTICOS DEL TAMAÑO DEL MERCADO DE SERVICIOS DE PRUEBAS DE SOFTWARE DE TAILANDIA. PRONÓSTICO, POR METODOLOGÍA DE PRUEBAS, 2019-2032 (MILES DE MILLONES DE USD)
    TABLA 89. ESTIMACIONES Y PROYECTOS DEL TAMAÑO DEL MERCADO DE SERVICIOS DE PRUEBAS DE SOFTWARE DE TAILANDIA. PRONÓSTICO, POR TIPO DE IMPLEMENTACIÓN, 2019-2032 (MILES DE MILLONES DE USD)
    TABLA 90. ESTIMACIONES Y POTENCIA DEL TAMAÑO DEL MERCADO DE SERVICIOS DE PRUEBAS DE SOFTWARE DE TAILANDIA. PRONÓSTICO, POR INDUSTRIA DE USO FINAL, 2019-2032 (MILES DE MILLONES DE USD)
    TABLA 91. ESTIMACIONES Y EMPRESAS DEL TAMAÑO DEL MERCADO DE SERVICIOS DE PRUEBAS DE SOFTWARE DE TAILANDIA. PRONÓSTICO, POR REGIONAL, 2019-2032 (MILES DE MILLONES DE USD)
    TABLA 92. ESTIMACIONES Y POTENCIA DEL TAMAÑO DEL MERCADO DE SERVICIOS DE PRUEBAS DE SOFTWARE DE INDONESIA. PRONÓSTICO, POR TIPO DE SERVICIO, 2019-2032 (MILES DE MILLONES DE USD)
    TABLA 93. ESTIMACIONES Y ESTIMACIONES DEL TAMAÑO DEL MERCADO DE SERVICIOS DE PRUEBAS DE SOFTWARE DE INDONESIA. PRONÓSTICO, POR METODOLOGÍA DE PRUEBAS, 2019-2032 (MILES DE MILLONES DE USD)
    TABLA 94. ESTIMACIONES Y ESTIMACIONES DEL TAMAÑO DEL MERCADO DE SERVICIOS DE PRUEBAS DE SOFTWARE DE INDONESIA. PRONÓSTICO, POR TIPO DE IMPLEMENTACIÓN, 2019-2032 (MILES DE MILLONES DE USD)
    TABLA 95. ESTIMACIONES Y ESTIMACIONES DEL TAMAÑO DEL MERCADO DE SERVICIOS DE PRUEBAS DE SOFTWARE DE INDONESIA. PRONÓSTICO, POR INDUSTRIA DE USO FINAL, 2019-2032 (MILES DE MILLONES DE USD)
    TABLA 96. ESTIMACIONES Y POTENCIA DEL TAMAÑO DEL MERCADO DE SERVICIOS DE PRUEBAS DE SOFTWARE DE INDONESIA. PRONÓSTICO, POR REGIONAL, 2019-2032 (MILES DE MILLONES DE USD)
    TABLA 97. ESTIMACIONES Y PRESIONES DEL TAMAÑO DEL MERCADO DE SERVICIOS DE PRUEBAS DE SOFTWARE DEL RESTO DE APAC. PRONÓSTICO, POR TIPO DE SERVICIO, 2019-2032 (MILES DE MILLONES DE USD)
    TABLA 98. ESTIMACIONES Y PREVISIÓN DEL TAMAÑO DEL MERCADO DE SERVICIOS DE PRUEBAS DE SOFTWARE DEL RESTO DE APAC. PRONÓSTICO, POR METODOLOGÍA DE PRUEBAS, 2019-2032 (MILES DE MILLONES DE USD)
    TABLA 99. ESTIMACIONES Y PROYECTOS DEL TAMAÑO DEL MERCADO DE SERVICIOS DE PRUEBAS DE SOFTWARE DEL RESTO DE APAC. PRONÓSTICO, POR TIPO DE IMPLEMENTACIÓN, 2019-2032 (MILES DE MILLONES DE USD)
    TABLA 100. ESTIMACIONES Y ESTIMACIONES DEL TAMAÑO DEL MERCADO DE SERVICIOS DE PRUEBAS DE SOFTWARE DEL RESTO DE APAC. PRONÓSTICO, POR INDUSTRIA DE USO FINAL, 2019-2032 (MILES DE MILLONES DE USD)
    TABLA 101. ESTIMACIONES Y PROYECTOS DEL TAMAÑO DEL MERCADO DE SERVICIOS DE PRUEBAS DE SOFTWARE DEL RESTO DE APAC. PRONÓSTICO, POR REGIONAL, 2019-2032 (MILES DE MILLONES DE USD)
    TABLA 102. ESTIMACIONES Y PROYECTOS DEL TAMAÑO DEL MERCADO DE SERVICIOS DE PRUEBAS DE SOFTWARE DE AMÉRICA DEL SUR. PRONÓSTICO, POR TIPO DE SERVICIO, 2019-2032 (MILES DE MILLONES DE USD)
    TABLA 103. ESTIMACIONES Y ESTIMACIONES DEL TAMAÑO DEL MERCADO DE SERVICIOS DE PRUEBAS DE SOFTWARE DE AMÉRICA DEL SUR. PRONÓSTICO, POR METODOLOGÍA DE PRUEBAS, 2019-2032 (MILES DE MILLONES DE USD)
    TABLA 104. ESTIMACIONES Y ESTIMACIONES DEL TAMAÑO DEL MERCADO DE SERVICIOS DE PRUEBAS DE SOFTWARE DE AMÉRICA DEL SUR. PRONÓSTICO, POR TIPO DE IMPLEMENTACIÓN, 2019-2032 (MILES DE MILLONES DE USD)
    TABLA 105. ESTIMACIONES Y ESTIMACIONES DEL TAMAÑO DEL MERCADO DE SERVICIOS DE PRUEBAS DE SOFTWARE DE AMÉRICA DEL SUR. PRONÓSTICO, POR INDUSTRIA DE USO FINAL, 2019-2032 (MILES DE MILLONES DE USD)
    TABLA 106. ESTIMACIONES Y ESTIMACIONES DEL TAMAÑO DEL MERCADO DE SERVICIOS DE PRUEBAS DE SOFTWARE DE AMÉRICA DEL SUR. PRONÓSTICO, POR REGIONAL, 2019-2032 (MILES DE MILLONES DE USD)
    TABLA 107. ESTIMACIONES Y EMPRESAS DEL TAMAÑO DEL MERCADO DE SERVICIOS DE PRUEBAS DE SOFTWARE DE BRASIL. PRONÓSTICO, POR TIPO DE SERVICIO, 2019-2032 (MILES DE MILLONES DE USD)
    TABLA 108. ESTIMACIONES Y EMPRESAS DEL TAMAÑO DEL MERCADO DE SERVICIOS DE PRUEBAS DE SOFTWARE DE BRASIL. PRONÓSTICO, POR METODOLOGÍA DE PRUEBAS, 2019-2032 (MILES DE MILLONES DE USD)
    TABLA 109. ESTIMACIONES Y EMPRESAS DEL TAMAÑO DEL MERCADO DE SERVICIOS DE PRUEBAS DE SOFTWARE DE BRASIL. PRONÓSTICO, POR TIPO DE IMPLEMENTACIÓN, 2019-2032 (MILES DE MILLONES DE USD)
    TABLA 110. ESTIMACIONES Y EMPRESAS DEL TAMAÑO DEL MERCADO DE SERVICIOS DE PRUEBAS DE SOFTWARE DE BRASIL. PRONÓSTICO, POR INDUSTRIA DE USO FINAL, 2019-2032 (MILES DE MILLONES DE USD)
    TABLA 111. ESTIMACIONES Y EMPRESAS DEL TAMAÑO DEL MERCADO DE SERVICIOS DE PRUEBAS DE SOFTWARE DE BRASIL. PRONÓSTICO, POR REGIONAL, 2019-2032 (MILES DE MILLONES DE USD)
    TABLA 112. ESTIMACIONES Y POTENCIA DEL TAMAÑO DEL MERCADO DE SERVICIOS DE PRUEBAS DE SOFTWARE EN MÉXICO. PRONÓSTICO, POR TIPO DE SERVICIO, 2019-2032 (MILES DE MILLONES DE USD)
    TABLA 113. ESTIMACIONES Y POTENCIA DEL TAMAÑO DEL MERCADO DE SERVICIOS DE PRUEBAS DE SOFTWARE EN MÉXICO. PRONÓSTICO, POR METODOLOGÍA DE PRUEBAS, 2019-2032 (MILES DE MILLONES DE USD)
    TABLA 114. ESTIMACIONES Y PROYECTOS DEL TAMAÑO DEL MERCADO DE SERVICIOS DE PRUEBAS DE SOFTWARE EN MÉXICO. PRONÓSTICO, POR TIPO DE IMPLEMENTACIÓN, 2019-2032 (MILES DE MILLONES DE USD)
    TABLA 115. ESTIMACIONES Y PROYECTOS DEL TAMAÑO DEL MERCADO DE SERVICIOS DE PRUEBAS DE SOFTWARE EN MÉXICO. PRONÓSTICO, POR INDUSTRIA DE USO FINAL, 2019-2032 (MILES DE MILLONES DE USD)
    TABLA 116. ESTIMACIONES Y POTENCIA DEL TAMAÑO DEL MERCADO DE SERVICIOS DE PRUEBAS DE SOFTWARE EN MÉXICO. PRONÓSTICO, POR REGIONAL, 2019-2032 (MILES DE MILLONES DE USD)
    TABLA 117. ESTIMACIONES Y PROYECTOS DEL TAMAÑO DEL MERCADO DE SERVICIOS DE PRUEBAS DE SOFTWARE DE ARGENTINA. PRONÓSTICO, POR TIPO DE SERVICIO, 2019-2032 (MILES DE MILLONES DE USD)
    TABLA 118. ESTIMACIONES Y PRONÓSTICOS DEL TAMAÑO DEL MERCADO DE SERVICIOS DE PRUEBAS DE SOFTWARE DE ARGENTINA. PRONÓSTICO, POR METODOLOGÍA DE PRUEBAS, 2019-2032 (MILES DE MILLONES DE USD)
    TABLA 119. ESTIMACIONES Y ESTIMACIONES DEL TAMAÑO DEL MERCADO DE SERVICIOS DE PRUEBAS DE SOFTWARE DE ARGENTINA. PRONÓSTICO, POR TIPO DE IMPLEMENTACIÓN, 2019-2032 (MILES DE MILLONES DE USD)
    TABLA 120. ESTIMACIONES Y PROYECTOS DEL TAMAÑO DEL MERCADO DE SERVICIOS DE PRUEBAS DE SOFTWARE DE ARGENTINA. PRONÓSTICO, POR INDUSTRIA DE USO FINAL, 2019-2032 (MILES DE MILLONES DE USD)
    TABLA 121. ESTIMACIONES Y POTENCIA DEL TAMAÑO DEL MERCADO DE SERVICIOS DE PRUEBAS DE SOFTWARE DE ARGENTINA. PRONÓSTICO, POR REGIONAL, 2019-2032 (MILES DE MILLONES DE USD)
    TABLA 122. ESTIMACIONES Y ESTIMACIONES DEL TAMAÑO DEL MERCADO DE SERVICIOS DE PRUEBAS DE SOFTWARE PARA EL RESTO DE SUDAMÉRICA. PRONÓSTICO, POR TIPO DE SERVICIO, 2019-2032 (MILES DE MILLONES DE USD)
    TABLA 123. ESTIMACIONES Y ESTIMACIONES DEL TAMAÑO DEL MERCADO DE SERVICIOS DE PRUEBAS DE SOFTWARE PARA EL RESTO DE SUDAMÉRICA. PRONÓSTICO, POR METODOLOGÍA DE PRUEBAS, 2019-2032 (MILES DE MILLONES DE USD)
    TABLA 124. ESTIMACIONES Y ESTIMACIONES DEL TAMAÑO DEL MERCADO DE SERVICIOS DE PRUEBAS DE SOFTWARE PARA EL RESTO DE SUDAMÉRICA. PRONÓSTICO, POR TIPO DE IMPLEMENTACIÓN, 2019-2032 (MILES DE MILLONES DE USD)
    TABLA 125. ESTIMACIONES Y ESTIMACIONES DEL TAMAÑO DEL MERCADO DE SERVICIOS DE PRUEBAS DE SOFTWARE PARA EL RESTO DE SUDAMÉRICA. PRONÓSTICO, POR INDUSTRIA DE USO FINAL, 2019-2032 (MILES DE MILLONES DE USD)
    TABLA 126. ESTIMACIONES Y ESTIMACIONES DEL TAMAÑO DEL MERCADO DE SERVICIOS DE PRUEBAS DE SOFTWARE PARA EL RESTO DE SUDAMÉRICA. PRONÓSTICO, POR REGIONAL, 2019-2032 (MILES DE MILLONES DE USD)
    TABLA 127. ESTIMACIONES Y PROYECTOS DEL TAMAÑO DEL MERCADO DEL SERVICIO DE PRUEBAS DE SOFTWARE DE MEA. PRONÓSTICO, POR TIPO DE SERVICIO, 2019-2032 (MILES DE MILLONES DE USD)
    TABLA 128. ESTIMACIONES Y PRONÓSTICOS DEL TAMAÑO DEL MERCADO DEL SERVICIO DE PRUEBAS DE SOFTWARE DE MEA. PRONÓSTICO, POR METODOLOGÍA DE PRUEBAS, 2019-2032 (MILES DE MILLONES DE USD)
    TABLA 129. ESTIMACIONES Y PROYECTOS DEL TAMAÑO DEL MERCADO DEL SERVICIO DE PRUEBAS DE SOFTWARE DE MEA. PRONÓSTICO, POR TIPO DE IMPLEMENTACIÓN, 2019-2032 (MILES DE MILLONES DE USD)
    TABLA 130. ESTIMACIONES Y POTENCIA DEL TAMAÑO DEL MERCADO DEL SERVICIO DE PRUEBAS DE SOFTWARE DE MEA. PRONÓSTICO, POR INDUSTRIA DE USO FINAL, 2019-2032 (MILES DE MILLONES DE USD)
    TABLA 131. ESTIMACIONES Y POTENCIA DEL TAMAÑO DEL MERCADO DEL SERVICIO DE PRUEBAS DE SOFTWARE DE MEA. PRONÓSTICO, POR REGIONAL, 2019-2032 (MILES DE MILLONES DE USD)
    TABLA 132. ESTIMACIONES Y ESTIMACIONES DEL TAMAÑO DEL MERCADO DE SERVICIOS DE PRUEBAS DE SOFTWARE DE LOS PAÍSES DEL CCG. PRONÓSTICO, POR TIPO DE SERVICIO, 2019-2032 (MILES DE MILLONES DE USD)
    TABLA 133. ESTIMACIONES Y PROYECTOS DEL TAMAÑO DEL MERCADO DE SERVICIOS DE PRUEBAS DE SOFTWARE DE LOS PAÍSES DEL CCG. PRONÓSTICO, POR METODOLOGÍA DE PRUEBAS, 2019-2032 (MILES DE MILLONES DE USD)
    TABLA 134. ESTIMACIONES Y ESTIMACIONES DEL TAMAÑO DEL MERCADO DE SERVICIOS DE PRUEBAS DE SOFTWARE DE LOS PAÍSES DEL CCG. PRONÓSTICO, POR TIPO DE IMPLEMENTACIÓN, 2019-2032 (MILES DE MILLONES DE USD)
    TABLA 135. ESTIMACIONES Y ESTIMACIONES DEL TAMAÑO DEL MERCADO DE SERVICIOS DE PRUEBAS DE SOFTWARE DE LOS PAÍSES DEL CCG. PRONÓSTICO, POR INDUSTRIA DE USO FINAL, 2019-2032 (MILES DE MILLONES DE USD)
    TABLA 136. ESTIMACIONES Y EMPRESAS DEL TAMAÑO DEL MERCADO DE SERVICIOS DE PRUEBAS DE SOFTWARE DE LOS PAÍSES DEL CCG. PRONÓSTICO, POR REGIONAL, 2019-2032 (MILES DE MILLONES DE USD)
    TABLA 137. ESTIMACIONES Y POTENCIA DEL TAMAÑO DEL MERCADO DE SERVICIOS DE PRUEBAS DE SOFTWARE DE SUDÁFRICA. PRONÓSTICO, POR TIPO DE SERVICIO, 2019-2032 (MILES DE MILLONES DE USD)
    TABLA 138. ESTIMACIONES Y ESTIMACIONES DEL TAMAÑO DEL MERCADO DE SERVICIOS DE PRUEBAS DE SOFTWARE DE SUDÁFRICA. PRONÓSTICO, POR METODOLOGÍA DE PRUEBAS, 2019-2032 (MILES DE MILLONES DE USD)
    TABLA 139. ESTIMACIONES Y ESTIMACIONES DEL TAMAÑO DEL MERCADO DE SERVICIOS DE PRUEBAS DE SOFTWARE DE SUDÁFRICA. PRONÓSTICO, POR TIPO DE IMPLEMENTACIÓN, 2019-2032 (MILES DE MILLONES DE USD)
    TABLA 140. ESTIMACIONES Y ESTIMACIONES DEL TAMAÑO DEL MERCADO DE SERVICIOS DE PRUEBAS DE SOFTWARE DE SUDÁFRICA. PRONÓSTICO, POR INDUSTRIA DE USO FINAL, 2019-2032 (MILES DE MILLONES DE USD)
    TABLA 141. ESTIMACIONES Y POTENCIA DEL TAMAÑO DEL MERCADO DE SERVICIOS DE PRUEBAS DE SOFTWARE DE SUDÁFRICA. PRONÓSTICO, POR REGIONAL, 2019-2032 (MILES DE MILLONES DE USD)
    TABLA 142. ESTIMACIONES Y PROYECTOS DEL TAMAÑO DEL MERCADO DEL RESTO DE SERVICIOS DE PRUEBAS DE SOFTWARE DE MEA. PRONÓSTICO, POR TIPO DE SERVICIO, 2019-2032 (MILES DE MILLONES DE USD)
    TABLA 143. ESTIMACIONES Y PRONÓSTICOS DEL TAMAÑO DEL MERCADO DEL RESTO DE LOS SERVICIOS DE PRUEBAS DE SOFTWARE DE MEA. PRONÓSTICO, POR METODOLOGÍA DE PRUEBAS, 2019-2032 (MILES DE MILLONES DE USD)
    TABLA 144. ESTIMACIONES Y PROYECTOS DEL TAMAÑO DEL MERCADO DEL RESTO DE SERVICIOS DE PRUEBAS DE SOFTWARE DE MEA. PRONÓSTICO, POR TIPO DE IMPLEMENTACIÓN, 2019-2032 (MILES DE MILLONES DE USD)
    TABLA 145. ESTIMACIONES Y PROYECTOS DEL TAMAÑO DEL MERCADO DEL RESTO DEL SERVICIO DE PRUEBAS DE SOFTWARE DE MEA. PRONÓSTICO, POR INDUSTRIA DE USO FINAL, 2019-2032 (MILES DE MILLONES DE USD)
    TABLA 146. ESTIMACIONES Y PROYECTOS DEL TAMAÑO DEL MERCADO DEL RESTO DEL SERVICIO DE PRUEBAS DE SOFTWARE DE MEA. PRONÓSTICO, POR REGIONAL, 2019-2032 (MILES DE MILLONES DE USD)
    TABLA 147. LANZAMIENTO/DESARROLLO/APROBACIÓN DE PRODUCTOS
    TABLA 148. ADQUISICIÓN/ASOCIACIÓN


    LISTA DE CIFRAS

    FIGURA 1. SINOPSIS DEL MERCADO
    FIGURA 2. ANÁLISIS DEL MERCADO DE SERVICIOS DE PRUEBAS DE SOFTWARE DE AMÉRICA DEL NORTE
    FIGURA 3. EE.UU. ANÁLISIS DEL MERCADO DE SERVICIOS DE PRUEBAS DE SOFTWARE POR TIPO DE SERVICIO
    FIGURA 4. ANÁLISIS DEL MERCADO DE SERVICIOS DE PRUEBAS DE SOFTWARE DE EE. UU. MEDIANTE METODOLOGÍA DE PRUEBA
    FIGURA 5. ANÁLISIS DEL MERCADO DE SERVICIOS DE PRUEBAS DE SOFTWARE DE EE. UU. POR TIPO DE IMPLEMENTACIÓN
    FIGURA 6. PRUEBAS DE SOFTWARE DE EE. UU. ANÁLISIS DEL MERCADO DE SERVICIOS POR FINAL INDUSTRIA DE USO
    FIGURA 7. ANÁLISIS DEL MERCADO DE SERVICIOS DE PRUEBAS DE SOFTWARE DE EE. UU. POR REGIONAL
    FIGURA 8. ANÁLISIS DEL MERCADO DE SERVICIOS DE PRUEBAS DE SOFTWARE DE CANADÁ POR TIPO DE SERVICIO
    FIGURA 9. ANÁLISIS DEL MERCADO DE SERVICIOS DE PRUEBAS DE SOFTWARE DE CANADÁ POR METODOLOGÍA DE PRUEBAs < br />FIGURA 10. CANADÁ ANÁLISIS DEL MERCADO DE SERVICIOS DE PRUEBAS DE SOFTWARE POR TIPO DE IMPLEMENTACIÓN
    FIGURA 11. ANÁLISIS DEL MERCADO DE SERVICIOS DE PRUEBAS DE SOFTWARE DE CANADÁ POR INDUSTRIA DE USO FINAL
    FIGURA 12. ANÁLISIS DEL MERCADO DE SERVICIOS DE PRUEBAS DE SOFTWARE DE CANADÁ POR REGIONAL
    FIGURA 13. PRUEBAS DE SOFTWARE EN EUROPA MERCADO DE SERVICIOS ANÁLISIS
    FIGURA 14. ANÁLISIS DEL MERCADO DE SERVICIOS DE PRUEBAS DE SOFTWARE EN ALEMANIA POR TIPO DE SERVICIO
    FIGURA 15. ANÁLISIS DEL MERCADO DE SERVICIOS DE PRUEBAS DE SOFTWARE EN ALEMANIA POR METODOLOGÍA DE PRUEBAS
    FIGURA 16. ANÁLISIS DEL MERCADO DE SERVICIOS DE PRUEBAS DE SOFTWARE EN ALEMANIA POR TIPO DE IMPLEMENTACIÓN < hermano />FIGURA 17. ANÁLISIS DEL MERCADO DE SERVICIOS DE PRUEBAS DE SOFTWARE EN ALEMANIA POR INDUSTRIA DE USO FINAL
    FIGURA 18. ANÁLISIS DEL MERCADO DE SERVICIOS DE PRUEBAS DE SOFTWARE EN ALEMANIA POR REGIONAL
    FIGURA 19. ANÁLISIS DEL MERCADO DE SERVICIOS DE PRUEBAS DE SOFTWARE DEL REINO UNIDO POR TIPO DE SERVICIO
    FIGURA 20. SOFTWARE DEL REINO UNIDO ANÁLISIS DEL MERCADO DE SERVICIOS DE PRUEBAS MEDIANTE METODOLOGÍA DE PRUEBAS
    FIGURA 21. ANÁLISIS DEL MERCADO DE SERVICIOS DE PRUEBAS DE SOFTWARE DEL REINO UNIDO POR TIPO DE IMPLEMENTACIÓN
    FIGURA 22. ANÁLISIS DEL MERCADO DE SERVICIOS DE PRUEBAS DE SOFTWARE DEL REINO UNIDO POR INDUSTRIA DE USO FINAL
    FIGURA 23. PRUEBAS DE SOFTWARE DEL REINO UNIDO ANÁLISIS DEL MERCADO DE SERVICIOS POR REGIONAL
    FIGURA 24. ANÁLISIS DEL MERCADO DE SERVICIOS DE PRUEBAS DE SOFTWARE DE FRANCIA POR TIPO DE SERVICIO
    FIGURA 25. ANÁLISIS DEL MERCADO DE SERVICIOS DE PRUEBAS DE SOFTWARE DE FRANCIA POR METODOLOGÍA DE PRUEBAS
    FIGURA 26. ANÁLISIS DEL MERCADO DE SERVICIOS DE PRUEBAS DE SOFTWARE DE FRANCIA POR TIPO DE IMPLEMENTACIÓN
    FIGURA 27. ANÁLISIS DEL MERCADO DE SERVICIOS DE PRUEBAS DE SOFTWARE DE FRANCIA POR INDUSTRIA DE USO FINAL
    FIGURA 28. ANÁLISIS DEL MERCADO DE SERVICIOS DE PRUEBAS DE SOFTWARE DE FRANCIA POR REGIONAL
    FIGURA 29. ANÁLISIS DEL MERCADO DE SERVICIOS DE PRUEBAS DE SOFTWARE DE RUSIA POR TIPO DE SERVICIO
    FIGURA 30. SOFTWARE DE RUSIA ANÁLISIS DEL MERCADO DE SERVICIOS DE PRUEBAS POR METODOLOGÍA DE PRUEBAS
    FIGURA 31. ANÁLISIS DEL MERCADO DE SERVICIOS DE PRUEBAS DE SOFTWARE DE RUSIA POR TIPO DE IMPLEMENTACIÓN
    FIGURA 32. ANÁLISIS DEL MERCADO DE SERVICIOS DE PRUEBAS DE SOFTWARE DE RUSIA POR INDUSTRIA DE USO FINAL
    FIGURA 33. SOFTWARE DE RUSIA ANÁLISIS DEL MERCADO DE SERVICIOS DE PRUEBAS POR REGIONAL
    FIGURA 34. ANÁLISIS DEL MERCADO DE SERVICIOS DE PRUEBAS DE SOFTWARE DE ITALIA POR TIPO DE SERVICIO
    FIGURA 35. ANÁLISIS DEL MERCADO DE SERVICIOS DE PRUEBAS DE SOFTWARE DE ITALIA POR METODOLOGÍA DE PRUEBAS
    FIGURA 36. MERCADO DE SERVICIOS DE PRUEBAS DE SOFTWARE DE ITALIA ANÁLISIS POR TIPO DE IMPLEMENTACIÓN
    FIGURA 37. ANÁLISIS DEL MERCADO DE SERVICIOS DE PRUEBAS DE SOFTWARE DE ITALIA POR INDUSTRIA DE USO FINAL
    FIGURA 38. ANÁLISIS DEL MERCADO DE SERVICIOS DE PRUEBAS DE SOFTWARE DE ITALIA POR REGIONAL
    FIGURA 39. ANÁLISIS DEL MERCADO DE SERVICIOS DE PRUEBAS DE SOFTWARE DE ESPAÑA POR TIPO DE SERVICIO
    FIGURA 40. ANÁLISIS DEL MERCADO DE SERVICIOS DE PRUEBAS DE SOFTWARE EN ESPAÑA POR METODOLOGÍA DE PRUEBAS
    FIGURA 41. ANÁLISIS DEL MERCADO DE SERVICIOS DE PRUEBAS DE SOFTWARE EN ESPAÑA POR TIPO DE IMPLEMENTACIÓN
    FIGURA 42. ANÁLISIS DEL MERCADO DE SERVICIOS DE PRUEBAS DE SOFTWARE EN ESPAÑA POR INDUSTRIA DE USO FINAL
    FIGURA 43 . ESPAÑA ANÁLISIS DEL MERCADO DE SERVICIOS DE PRUEBAS DE SOFTWARE POR REGIONAL
    FIGURA 44. ANÁLISIS DEL MERCADO DE SERVICIOS DE PRUEBAS DE SOFTWARE DEL RESTO DE EUROPA POR TIPO DE SERVICIO
    FIGURA 45. ANÁLISIS DEL MERCADO DE SERVICIOS DE PRUEBAS DE SOFTWARE DEL RESTO DE EUROPA POR METODOLOGÍA DE PRUEBAS
    FIGURA 46. PRUEBAS DE SOFTWARE DEL RESTO DE EUROPA ANÁLISIS DEL MERCADO DE SERVICIOS POR TIPO DE IMPLEMENTACIÓN
    FIGURA 47. ANÁLISIS DEL MERCADO DE SERVICIOS DE PRUEBAS DE SOFTWARE DEL RESTO DE EUROPA POR INDUSTRIA DE USO FINAL
    FIGURA 48. ANÁLISIS DEL MERCADO DE SERVICIOS DE PRUEBAS DE SOFTWARE DEL RESTO DE EUROPA POR REGIONAL
    FIGURA 49. APAC MERCADO DE SERVICIOS DE PRUEBAS DE SOFTWARE ANÁLISIS
    FIGURA 50. ANÁLISIS DEL MERCADO DE SERVICIOS DE PRUEBAS DE SOFTWARE DE CHINA POR TIPO DE SERVICIO
    FIGURA 51. ANÁLISIS DEL MERCADO DE SERVICIOS DE PRUEBAS DE SOFTWARE DE CHINA POR METODOLOGÍA DE PRUEBAS
    FIGURA 52. ANÁLISIS DEL MERCADO DE SERVICIOS DE PRUEBAS DE SOFTWARE DE CHINA POR TIPO DE IMPLEMENTACIÓN < br />FIGURA 53. ANÁLISIS DEL MERCADO DE SERVICIOS DE PRUEBAS DE SOFTWARE DE CHINA POR INDUSTRIA DE USO FINAL
    FIGURA 54. ANÁLISIS DEL MERCADO DE SERVICIOS DE PRUEBAS DE SOFTWARE DE CHINA POR TIPO DE SERVICIO
    FIGURA 56. SERVICIO DE PRUEBAS DE SOFTWARE DE INDIA ANÁLISIS DE MERCADO MEDIANTE METODOLOGÍA DE PRUEBAS
    FIGURA 57. ANÁLISIS DEL MERCADO DE SERVICIOS DE PRUEBAS DE SOFTWARE DE LA INDIA POR TIPO DE IMPLEMENTACIÓN
    FIGURA 58. ANÁLISIS DEL MERCADO DE SERVICIOS DE PRUEBAS DE SOFTWARE DE LA INDIA POR INDUSTRIA DE USO FINAL
    FIGURA 59. MERCADO DE SERVICIOS DE PRUEBAS DE SOFTWARE DE LA INDIA ANÁLISIS POR REGIONAL
    FIGURA 60. ANÁLISIS DEL MERCADO DE SERVICIOS DE PRUEBAS DE SOFTWARE DE JAPÓN POR TIPO DE SERVICIO
    FIGURA 61. ANÁLISIS DEL MERCADO DE SERVICIOS DE PRUEBAS DE SOFTWARE DE JAPÓN POR METODOLOGÍA DE PRUEBAS
    FIGURA 62. ANÁLISIS DEL MERCADO DE SERVICIOS DE PRUEBAS DE SOFTWARE DE JAPÓN POR TIPO DE IMPLEMENTACIÓN < br />FIGURA 63. ANÁLISIS DEL MERCADO DE SERVICIOS DE PRUEBAS DE SOFTWARE DE JAPÓN POR INDUSTRIA DE USO FINAL
    FIGURA 64. ANÁLISIS DEL MERCADO DE SERVICIOS DE PRUEBAS DE SOFTWARE DE JAPÓN POR REGIONAL
    FIGURA 65. ANÁLISIS DEL MERCADO DE SERVICIOS DE PRUEBAS DE SOFTWARE DE COREA DEL SUR POR TIPO DE SERVICIO
    FIGURA 66 SOFTWARE DE COREA DEL SUR ANÁLISIS DEL MERCADO DE SERVICIOS DE PRUEBAS POR METODOLOGÍA DE PRUEBAS
    FIGURA 67. ANÁLISIS DEL MERCADO DE SERVICIOS DE PRUEBAS DE SOFTWARE DE COREA DEL SUR POR TIPO DE IMPLEMENTACIÓN
    FIGURA 68. ANÁLISIS DEL MERCADO DE SERVICIOS DE PRUEBAS DE SOFTWARE DE COREA DEL SUR POR INDUSTRIA DE USO FINAL
    FIGURA 69. SUR COREA ANÁLISIS DEL MERCADO DE SERVICIOS DE PRUEBAS DE SOFTWARE POR REGIONAL
    FIGURA 70. ANÁLISIS DEL MERCADO DE SERVICIOS DE PRUEBAS DE SOFTWARE DE MALASIA POR TIPO DE SERVICIO
    FIGURA 71. ANÁLISIS DEL MERCADO DE SERVICIOS DE PRUEBAS DE SOFTWARE DE MALASIA POR METODOLOGÍA DE PRUEBAS
    FIGURA 72. SERVICIO DE PRUEBAS DE SOFTWARE DE MALASIA ANÁLISIS DE MERCADO POR TIPO DE IMPLEMENTACIÓN
    FIGURA 73. ANÁLISIS DEL MERCADO DE SERVICIOS DE PRUEBAS DE SOFTWARE DE MALASIA POR INDUSTRIA DE USO FINAL
    FIGURA 74. ANÁLISIS DEL MERCADO DE SERVICIOS DE PRUEBAS DE SOFTWARE DE MALASIA POR REGIONAL
    FIGURA 75. ANÁLISIS DEL MERCADO DE SERVICIOS DE PRUEBAS DE SOFTWARE DE TAILANDIA POR TIPO DE SERVICIO
    FIGURA 76. ANÁLISIS DEL MERCADO DE SERVICIOS DE PRUEBAS DE SOFTWARE DE TAILANDIA POR METODOLOGÍA DE PRUEBAS
    FIGURA 77. ANÁLISIS DEL MERCADO DE SERVICIOS DE PRUEBAS DE SOFTWARE DE TAILANDIA POR TIPO DE IMPLEMENTACIÓN
    FIGURA 78. ANÁLISIS DEL MERCADO DE SERVICIOS DE PRUEBAS DE SOFTWARE DE TAILANDIA POR USO FINAL INDUSTRIA
    FIGURA 79. ANÁLISIS DEL MERCADO DE SERVICIOS DE PRUEBAS DE SOFTWARE DE TAILANDIA POR TIPO DE SERVICIO
    FIGURA 81. ANÁLISIS DEL MERCADO DE SERVICIOS DE PRUEBAS DE SOFTWARE DE INDONESIA POR TIPO DE SERVICIO
    FIGURA 81. ANÁLISIS DEL MERCADO DE SERVICIOS DE PRUEBAS DE SOFTWARE DE INDONESIA POR METODOLOGÍA DE PRUEBAs
    FIGURA 82. ANÁLISIS DEL MERCADO DE SERVICIOS DE PRUEBAS DE SOFTWARE DE INDONESIA POR TIPO DE IMPLEMENTACIÓN
    FIGURA 83. ANÁLISIS DEL MERCADO DE SERVICIOS DE PRUEBAS DE SOFTWARE DE INDONESIA POR INDUSTRIA DE USO FINAL
    FIGURA 84. ANÁLISIS DEL MERCADO DE SERVICIOS DE PRUEBAS DE SOFTWARE DE INDONESIA POR REGIONAL
    FIGURA 85. RESTO DE Asia Pacífico ANÁLISIS DEL MERCADO DE SERVICIOS DE PRUEBAS DE SOFTWARE POR TIPO DE SERVICIO
    FIGURA 86. RESTO DEL ANÁLISIS DEL MERCADO DE SERVICIOS DE PRUEBAS DE SOFTWARE DE APAC POR METODOLOGÍA DE PRUEBAS
    FIGURA 87. ANÁLISIS DEL MERCADO DEL RESTO DE SERVICIOS DE PRUEBAS DE SOFTWARE DE APAC POR TIPO DE IMPLEMENTACIÓN
    FIGURA 88 RESTO DE APAC. ANÁLISIS DEL MERCADO DE SERVICIOS DE PRUEBAS DE SOFTWARE POR INDUSTRIA DE USO FINAL
    FIGURA 89. ANÁLISIS DEL MERCADO DE SERVICIOS DE PRUEBAS DE SOFTWARE DEL RESTO DE APAC POR REGIONAL
    FIGURA 90. ANÁLISIS DEL MERCADO DE SERVICIOS DE PRUEBAS DE SOFTWARE DE AMÉRICA DEL SUR
    FIGURA 91. PRUEBAS DE SOFTWARE EN BRASIL MERCADO DE SERVICIOS ANÁLISIS POR TIPO DE SERVICIO
    FIGURA 92. ANÁLISIS DEL MERCADO DE SERVICIOS DE PRUEBAS DE SOFTWARE DE BRASIL POR METODOLOGÍA DE PRUEBAS
    FIGURA 93. ANÁLISIS DEL MERCADO DE SERVICIOS DE PRUEBAS DE SOFTWARE DE BRASIL POR TIPO DE IMPLEMENTACIÓN
    FIGURA 94. ANÁLISIS DEL MERCADO DE SERVICIOS DE PRUEBAS DE SOFTWARE DE BRASIL POR TIPO DE IMPLEMENTACIÓN USO FINAL INDUSTRIA
    FIGURA 95. ANÁLISIS DEL MERCADO DE SERVICIOS DE PRUEBAS DE SOFTWARE EN BRASIL POR TIPO DE SERVICIO
    FIGURA 97. ANÁLISIS DEL MERCADO DE SERVICIOS DE PRUEBAS DE SOFTWARE EN MÉXICO POR METODOLOGÍA DE PRUEBAS
    />FIGURA 98. ANÁLISIS DEL MERCADO DE SERVICIOS DE PRUEBAS DE SOFTWARE EN MÉXICO POR TIPO DE IMPLEMENTACIÓN
    FIGURA 99. ANÁLISIS DEL MERCADO DE SERVICIOS DE PRUEBAS DE SOFTWARE EN MÉXICO POR INDUSTRIA DE USO FINAL
    FIGURA 100. ANÁLISIS DEL MERCADO DE SERVICIOS DE PRUEBAS DE SOFTWARE EN MÉXICO POR REGIONAL
    FIGURA 101. ARGENTINA ANÁLISIS DEL MERCADO DE SERVICIOS DE PRUEBAS DE SOFTWARE POR TIPO DE SERVICIO
    FIGURA 102. ANÁLISIS DEL MERCADO DE SERVICIOS DE PRUEBAS DE SOFTWARE DE ARGENTINA POR METODOLOGÍA DE PRUEBAS
    FIGURA 103. ANÁLISIS DEL MERCADO DE SERVICIOS DE PRUEBAS DE SOFTWARE DE ARGENTINA POR TIPO DE IMPLEMENTACIÓN
    FIGURA 104. ARGENTINA ANÁLISIS DEL MERCADO DE SERVICIOS DE PRUEBAS DE SOFTWARE POR INDUSTRIA DE USO FINAL
    FIGURA 105. ANÁLISIS DEL MERCADO DE SERVICIOS DE PRUEBAS DE SOFTWARE DE ARGENTINA POR REGIONAL
    FIGURA 106. ANÁLISIS DEL MERCADO DE SERVICIOS DE PRUEBAS DE SOFTWARE DEL RESTO DE SUDAMÉRICA POR TIPO DE SERVICIO
    FIGURA 107. RESTO DEL SUR ANÁLISIS DEL MERCADO DE SERVICIOS DE PRUEBAS DE SOFTWARE EN AMÉRICA POR METODOLOGÍA DE PRUEBAS
    FIGURA 108. ANÁLISIS DEL MERCADO DE SERVICIOS DE PRUEBAS DE SOFTWARE DEL RESTO DE SUDAMÉRICA POR TIPO DE IMPLEMENTACIÓN
    FIGURA 109. ANÁLISIS DEL MERCADO DE SERVICIOS DE PRUEBAS DE SOFTWARE DEL RESTO DE SUDAMÉRICA POR INDUSTRIA DE USO FINAL
    FIGURA 110. ANÁLISIS DEL MERCADO DE SERVICIOS DE PRUEBAS DE SOFTWARE DEL RESTO DE SUDAMÉRICA POR REGIONAL
    FIGURA 111. ANÁLISIS DEL MERCADO DE SERVICIOS DE PRUEBAS DE SOFTWARE DE MEA
    FIGURA 112. ANÁLISIS DEL MERCADO DE SERVICIOS DE PRUEBAS DE SOFTWARE DE LOS PAÍSES DEL CCG POR TIPO DE SERVICIO
    FIGURA 113. CCG ANÁLISIS DEL MERCADO DE SERVICIOS DE PRUEBAS DE SOFTWARE DE LOS PAÍSES POR METODOLOGÍA DE PRUEBA
    FIGURA 114. ANÁLISIS DEL MERCADO DE SERVICIOS DE PRUEBAS DE SOFTWARE DE LOS PAÍSES DEL CCG POR TIPO DE IMPLEMENTACIÓN
    FIGURA 115. ANÁLISIS DEL MERCADO DE SERVICIOS DE PRUEBAS DE SOFTWARE DE LOS PAÍSES DEL CCG POR INDUSTRIA DE USO FINAL
    FIGURA 116. ANÁLISIS DEL MERCADO DE SERVICIOS DE PRUEBAS DE SOFTWARE DE LOS PAÍSES DEL CCG POR REGIONAL
    FIGURA 117. ANÁLISIS DEL MERCADO DE SERVICIOS DE PRUEBAS DE SOFTWARE DE SUDÁFRICA POR TIPO DE SERVICIO
    FIGURA 118. ANÁLISIS DEL MERCADO DE SERVICIOS DE PRUEBAS DE SOFTWARE DE SUDÁFRICA POR METODOLOGÍA DE PRUEBA
    FIGURA 119. ANÁLISIS DEL MERCADO DE SERVICIOS DE PRUEBAS DE SOFTWARE DE SUDÁFRICA POR TIPO DE IMPLEMENTACIÓN
    FIGURA 120. ANÁLISIS DEL MERCADO DE SERVICIOS DE PRUEBAS DE SOFTWARE DE SUDÁFRICA POR INDUSTRIA DE USO FINAL
    FIGURA 121. ANÁLISIS DEL MERCADO DE SERVICIOS DE PRUEBAS DE SOFTWARE DE SUDÁFRICA POR REGIONAL
    CIFRA 122. RESTO DEL SERVICIO DE PRUEBAS DE SOFTWARE DE MEAANÁLISIS DE MERCADO POR TIPO DE SERVICIO
    FIGURA 123. RESTO DE SERVICIOS DE PRUEBAS DE SOFTWARE DE MEA ANÁLISIS DE MERCADO POR METODOLOGÍA DE PRUEBAS
    FIGURA 124. RESTO DE SERVICIOS DE PRUEBAS DE SOFTWARE DE MEA ANÁLISIS DE MERCADO POR TIPO DE IMPLEMENTACIÓN
    FIGURA 125. RESTO DE PRUEBAS DE SOFTWARE MEA ANÁLISIS DEL MERCADO DE SERVICIOS POR INDUSTRIA DE USO FINAL
    FIGURA 126. RESTO DE MEA ANÁLISIS DEL MERCADO DE SERVICIOS DE PRUEBAS DE SOFTWARE POR REGIONAL
    FIGURA 127. CRITERIOS CLAVE DE COMPRA DEL MERCADO DE SERVICIOS DE PRUEBAS DE SOFTWARE
    FIGURA 128. PROCESO DE INVESTIGACIÓN DE MRFR
    FIGURA 129. ANÁLISIS DRO DEL MERCADO DE SERVICIOS DE PRUEBAS DE SOFTWARE
    FIGURA 130. ANÁLISIS DE IMPACTO DE LOS IMPULSORES: MERCADO DE SERVICIOS DE PRUEBAS DE SOFTWARE
    FIGURA 131. ANÁLISIS DE IMPACTO DE LAS RESTRICCIONES: MERCADO DE SERVICIOS DE PRUEBAS DE SOFTWARE
    FIGURA 132. CADENA DE SUMINISTRO / VALOR : PRUEBAS DE SOFTWARE MERCADO DE SERVICIOS
    FIGURA 133. MERCADO DE SERVICIOS DE PRUEBAS DE SOFTWARE, POR TIPO DE SERVICIO, 2024 (% DE PARTICIPACIÓN)
    FIGURA 134. MERCADO DE SERVICIOS DE PRUEBAS DE SOFTWARE, POR TIPO DE SERVICIO, 2019 A 2032 (Miles de millones de USD)
    GRÁFICO 135. MERCADO DE SERVICIOS DE PRUEBAS DE SOFTWARE, POR PRUEBAS METODOLOGÍA, 2024 (% DE PARTICIPACIÓN)
    FIGURA 136. MERCADO DE SERVICIOS DE PRUEBAS DE SOFTWARE, POR METODOLOGÍA DE PRUEBAS, 2019 A 2032 (Miles de millones de USD)
    FIGURA 137. MERCADO DE SERVICIOS DE PRUEBAS DE SOFTWARE, POR TIPO DE IMPLEMENTACIÓN, 2024 (% DE PARTICIPACIÓN) )
    FIGURA 138. MERCADO DE SERVICIOS DE PRUEBAS DE SOFTWARE, POR TIPO DE IMPLEMENTACIÓN, 2019 A 2032 (Miles de millones de USD)
    FIGURA 139. MERCADO DE SERVICIOS DE PRUEBAS DE SOFTWARE, POR INDUSTRIA DE USO FINAL, 2024 (% DE PARTICIPACIÓN)
    FIGURA 140. SERVICIO DE PRUEBAS DE SOFTWARE MERCADO, POR USO FINAL INDUSTRIA, 2019 A 2032 (Miles de millones de USD)
    FIGURA 141. MERCADO DE SERVICIOS DE PRUEBAS DE SOFTWARE, POR REGIONAL, 2024 (PARTICIPACIÓN)
    FIGURA 142. MERCADO DE SERVICIOS DE PRUEBAS DE SOFTWARE, POR REGIONAL, 2019 A 2032 (Miles de millones de USD) )
    FIGURA 143. Evaluación comparativa de los principales competidores

    Segmentación del mercado de servicios de pruebas de software


    • Mercado de servicios de pruebas de software por tipo de servicio (miles de millones de dólares, 2019-2032)

      • Pruebas funcionales

      • Pruebas de rendimiento

      • Pruebas de automatización

      • Pruebas de seguridad


    • Mercado de servicios de prueba de software por metodología de prueba (miles de millones de dólares, 2019-2032)

      • Pruebas manuales

      • Pruebas automatizadas


    • Mercado de servicios de pruebas de software por tipo de implementación (miles de millones de dólares, 2019-2032)

      • En las instalaciones

      • Basado en la nube


    • Mercado de servicios de pruebas de software por industria de uso final (miles de millones de dólares, 2019-2032)

      • TI y Telecomunicaciones

      • Cuidado de la salud

      • Banca, servicios financieros y seguros

      • Venta al por menor

      • Fabricación


    • Mercado de servicios de pruebas de software por región (miles de millones de dólares, 2019-2032)

      • América del Norte

      • Europa

      • América del Sur

      • Asia Pacífico

      • Oriente Medio y África


    Perspectiva regional del mercado de servicios de pruebas de software (miles de millones de dólares, 2019-2032)


    • Perspectivas de América del Norte (miles de millones de dólares, 2019-2032)

      • Mercado de servicios de pruebas de software de América del Norte por tipo de servicio

        • Pruebas funcionales

        • Pruebas de rendimiento

        • Pruebas de automatización

        • Pruebas de seguridad

      • Mercado de servicios de pruebas de software de América del Norte por tipo de metodología de prueba

        • Pruebas manuales

        • Pruebas automatizadas

      • Mercado de servicios de pruebas de software de América del Norte por tipo de implementación

        • En las instalaciones

        • Basado en la nube

      • Mercado de servicios de pruebas de software de América del Norte por tipo de industria de uso final

        • TI y Telecomunicaciones

        • Cuidado de la salud

        • Banca, servicios financieros y seguros

        • Venta al por menor

        • Fabricación

      • Mercado de servicios de pruebas de software de América del Norte por tipo regional

        • EE.UU.

        • Canadá

      • Perspectivas de EE. UU. (miles de millones de dólares, 2019-2032)

      • Mercado de servicios de pruebas de software de EE. UU. por tipo de servicio

        • Pruebas funcionales

        • Pruebas de rendimiento

        • Pruebas de automatización

        • Pruebas de seguridad

      • Mercado de servicios de pruebas de software de EE. UU. por tipo de metodología de prueba

        • Pruebas manuales

        • Pruebas automatizadas

      • Mercado de servicios de pruebas de software de EE. UU. por tipo de implementación

        • En las instalaciones

        • Basado en la nube

      • Mercado de servicios de pruebas de software de EE. UU. por tipo de industria de uso final

        • TI y Telecomunicaciones

        • Cuidado de la salud

        • Banca, servicios financieros y seguros

        • Venta al por menor

        • Fabricación

      • Perspectivas de CANADÁ (miles de millones de dólares, 2019-2032)

      • Mercado de servicios de pruebas de software de CANADÁ por tipo de servicio

        • Pruebas funcionales

        • Pruebas de rendimiento

        • Pruebas de automatización

        • Pruebas de seguridad

      • Mercado de servicios de pruebas de software de CANADÁ por tipo de metodología de prueba

        • Pruebas manuales

        • Pruebas automatizadas

      • Mercado de servicios de pruebas de software de CANADÁ por tipo de implementación

        • En las instalaciones

        • Basado en la nube

      • Mercado de servicios de pruebas de software de CANADÁ por tipo de industria de uso final

        • TI y Telecomunicaciones

        • Cuidado de la salud

        • Banca, servicios financieros y seguros

        • Venta al por menor

        • Fabricación

    • Perspectivas de Europa (miles de millones de dólares, 2019-2032)

      • Mercado europeo de servicios de pruebas de software por tipo de servicio

        • Pruebas funcionales

        • Pruebas de rendimiento

        • Pruebas de automatización

        • Pruebas de seguridad

      • Mercado europeo de servicios de pruebas de software por tipo de metodología de prueba

        • Pruebas manuales

        • Pruebas automatizadas

      • Mercado europeo de servicios de pruebas de software por tipo de implementación

        • En las instalaciones

        • Basado en la nube

      • Mercado europeo de servicios de pruebas de software por tipo de industria de uso final

        • TI y Telecomunicaciones

        • Cuidado de la salud

        • Banca, servicios financieros y seguros

        • Venta al por menor

        • Fabricación

      • Mercado europeo de servicios de pruebas de software por tipo regional

        • Alemania

        • Reino Unido

        • Francia

        • Rusia

        • Italia

        • España

        • Resto de Europa

      • Perspectivas de ALEMANIA (miles de millones de dólares, 2019-2032)

      • Mercado de servicios de pruebas de software en ALEMANIA por tipo de servicio

        • Pruebas funcionales

        • Pruebas de rendimiento

        • Pruebas de automatización

        • Pruebas de seguridad

      • Mercado de servicios de pruebas de software de ALEMANIA por tipo de metodología de prueba

        • Pruebas manuales

        • Pruebas automatizadas

      • Mercado de servicios de pruebas de software de ALEMANIA por tipo de implementación

        • En las instalaciones

        • Basado en la nube

      • Mercado de servicios de pruebas de software de ALEMANIA por tipo de industria de uso final

        • TI y Telecomunicaciones

        • Cuidado de la salud

        • Banca, servicios financieros y seguros

        • Venta al por menor

        • Fabricación

      • Perspectivas del Reino Unido (miles de millones de dólares, 2019-2032)

      • Mercado de servicios de pruebas de software del Reino Unido por tipo de servicio

        • Pruebas funcionales

        • Pruebas de rendimiento

        • Pruebas de automatización

        • Pruebas de seguridad

      • Mercado de servicios de pruebas de software del Reino Unido por tipo de metodología de prueba

        • Pruebas manuales

        • Pruebas automatizadas

      • Mercado de servicios de pruebas de software del Reino Unido por tipo de implementación

        • En las instalaciones

        • Basado en la nube

      • Mercado de servicios de pruebas de software del Reino Unido por tipo de industria de uso final

        • TI y Telecomunicaciones

        • Cuidado de la salud

        • Banca, servicios financieros y seguros

        • Venta al por menor

        • Fabricación

      • Perspectivas de FRANCIA (miles de millones de dólares, 2019-2032)

      • Mercado de servicios de pruebas de software de FRANCIA por tipo de servicio

        • Pruebas funcionales

        • Pruebas de rendimiento

        • Pruebas de automatización

        • Pruebas de seguridad

      • Mercado de servicios de pruebas de software de FRANCIA por tipo de metodología de prueba

        • Pruebas manuales

        • Pruebas automatizadas

      • Mercado de servicios de pruebas de software de FRANCIA por tipo de implementación

        • En las instalaciones

        • Basado en la nube

      • Mercado de servicios de pruebas de software de FRANCIA por tipo de industria de uso final

        • TI y Telecomunicaciones

        • Cuidado de la salud

        • Banca, servicios financieros y seguros

        • Venta al por menor

        • Fabricación

      • Perspectivas de RUSIA (miles de millones de dólares, 2019-2032)

      • Mercado de servicios de pruebas de software de RUSIA por tipo de servicio

        • Pruebas funcionales

        • Pruebas de rendimiento

        • Pruebas de automatización

        • Pruebas de seguridad

      • Mercado de servicios de pruebas de software de Rusia por tipo de metodología de prueba

        • Pruebas manuales

        • Pruebas automatizadas

      • Mercado de servicios de pruebas de software de Rusia por tipo de implementación

        • En las instalaciones

        • Basado en la nube

      • Mercado de servicios de pruebas de software de Rusia por tipo de industria de uso final

        • TI y Telecomunicaciones

        • Cuidado de la salud

        • Banca, servicios financieros y seguros

        • Venta al por menor

        • Fabricación

      • Perspectivas de ITALIA (miles de millones de dólares, 2019-2032)

      • Mercado de servicios de pruebas de software de ITALIA por tipo de servicio

        • Pruebas funcionales

        • Pruebas de rendimiento

        • Pruebas de automatización

        • Pruebas de seguridad

      • Mercado de servicios de pruebas de software de ITALIA por tipo de metodología de prueba

        • Pruebas manuales

        • Pruebas automatizadas

      • Mercado de servicios de pruebas de software de ITALIA por tipo de implementación

        • En las instalaciones

        • Basado en la nube

      • Mercado de servicios de pruebas de software de ITALIA por tipo de industria de uso final

        • TI y Telecomunicaciones

        • Cuidado de la salud

        • Banca, servicios financieros y seguros

        • Venta al por menor

        • Fabricación

      • Perspectivas de ESPAÑA (Miles de millones de dólares, 2019-2032)

      • Mercado de servicios de pruebas de software en ESPAÑA por tipo de servicio

        • Pruebas funcionales

        • Pruebas de rendimiento

        • Pruebas de automatización

        • Pruebas de seguridad

      • Mercado de servicios de pruebas de software en ESPAÑA por tipo de metodología de prueba

        • Pruebas manuales

        • Pruebas automatizadas

      • Mercado de servicios de pruebas de software en ESPAÑA por tipo de implementación

        • En las instalaciones

        • Basado en la nube

      • Mercado de servicios de pruebas de software en España por tipo de industria de uso final

        • TI y Telecomunicaciones

        • Cuidado de la salud

        • Banca, servicios financieros y seguros

        • Venta al por menor

        • Fabricación

      • Perspectivas DEL RESTO DE EUROPA (Miles de millones de dólares, 2019-2032)

      • Mercado de servicios de pruebas de software del RESTO DE EUROPA por tipo de servicio

        • Pruebas funcionales

        • Pruebas de rendimiento

        • Pruebas de automatización

        • Pruebas de seguridad

      • Mercado de servicios de pruebas de software del RESTO DE EUROPA por tipo de metodología de prueba

        • Pruebas manuales

        • Pruebas automatizadas

      • RESTO DE EUROPAMercado de servicios de pruebas de software por tipo de implementación

        • En las instalaciones

        • Basado en la nube

      • Mercado de servicios de pruebas de software del RESTO DE EUROPA por tipo de industria de uso final

        • TI y Telecomunicaciones

        • Cuidado de la salud

        • Banca, servicios financieros y seguros

        • Venta al por menor

        • Fabricación

    • Perspectivas de Asia Pacífico (miles de millones de dólares, 2019-2032)

      • Mercado de servicios de pruebas de software de APAC por tipo de servicio

        • Pruebas funcionales

        • Pruebas de rendimiento

        • Pruebas de automatización

        • Pruebas de seguridad

      • Mercado de servicios de pruebas de software de APAC por tipo de metodología de prueba

        • Pruebas manuales

        • Pruebas automatizadas

      • Mercado de servicios de pruebas de software de APAC por tipo de implementación

        • En las instalaciones

        • Basado en la nube

      • Mercado de servicios de pruebas de software de APAC por tipo de industria de uso final

        • TI y Telecomunicaciones

        • Cuidado de la salud

        • Banca, servicios financieros y seguros

        • Venta al por menor

        • Fabricación

      • Mercado de servicios de pruebas de software de APAC por tipo regional

        • China

        • India

        • Japón

        • Corea del Sur

        • Malasia

        • Tailandia

        • Indonesia

        • Resto de APAC

      • Perspectivas de CHINA (miles de millones de dólares, 2019-2032)

      • Mercado de servicios de pruebas de software de CHINA por tipo de servicio

        • Pruebas funcionales

        • Pruebas de rendimiento

        • Pruebas de automatización

        • Pruebas de seguridad

      • Mercado de servicios de pruebas de software de CHINA por tipo de metodología de prueba

        • Pruebas manuales

        • Pruebas automatizadas

      • Mercado de servicios de pruebas de software de CHINA por tipo de implementación

        • En las instalaciones

        • Basado en la nube

      • Mercado de servicios de pruebas de software de CHINA por tipo de industria de uso final

        • TI y Telecomunicaciones

        • Cuidado de la salud

        • Banca, servicios financieros y seguros

        • Venta al por menor

        • Fabricación

      • Perspectivas de la INDIA (miles de millones de dólares, 2019-2032)

      • Mercado de servicios de pruebas de software de INDIA por tipo de servicio

        • Pruebas funcionales

        • Pruebas de rendimiento

        • Pruebas de automatización

        • Pruebas de seguridad

      • Mercado de servicios de prueba de software de INDIA por tipo de metodología de prueba

        • Pruebas manuales

        • Pruebas automatizadas

      • Mercado de servicios de pruebas de software de INDIA por tipo de implementación

        • En las instalaciones

        • Basado en la nube

      • Mercado de servicios de pruebas de software de INDIA por tipo de industria de uso final

        • TI y Telecomunicaciones

        • Cuidado de la salud

        • Banca, servicios financieros y seguros

        • Venta al por menor

        • Fabricación

      • Perspectivas de JAPÓN (miles de millones de dólares, 2019-2032)

      • Mercado de servicios de pruebas de software de Japón por tipo de servicio

        • Pruebas funcionales

        • Pruebas de rendimiento

        • Pruebas de automatización

        • Pruebas de seguridad

      • Mercado de servicios de pruebas de software de Japón por tipo de metodología de prueba

        • Pruebas manuales

        • Pruebas automatizadas

      • Mercado de servicios de pruebas de software de Japón por tipo de implementación

        • En las instalaciones

        • Basado en la nube

      • Mercado de servicios de pruebas de software de Japón por tipo de industria de uso final

        • TI y Telecomunicaciones

        • Cuidado de la salud

        • Banca, servicios financieros y seguros

        • Venta al por menor

        • Fabricación

      • Perspectivas de COREA DEL SUR (miles de millones de dólares, 2019-2032)

      • Mercado de servicios de pruebas de software de COREA DEL SUR por tipo de servicio

        • Pruebas funcionales

        • Pruebas de rendimiento

        • Pruebas de automatización

        • Pruebas de seguridad

      • Mercado de servicios de pruebas de software de COREA DEL SUR por tipo de metodología de prueba

        • Pruebas manuales

        • Pruebas automatizadas

      • Mercado de servicios de pruebas de software de COREA DEL SUR por tipo de implementación

        • En las instalaciones

        • Basado en la nube

      • Mercado de servicios de pruebas de software de COREA DEL SUR por tipo de industria de uso final

        • TI y Telecomunicaciones

        • Cuidado de la salud

        • Banca, servicios financieros y seguros

        • Venta al por menor

        • Fabricación

      • Perspectivas de MALASIA (miles de millones de dólares, 2019-2032)

      • Mercado de servicios de pruebas de software de MALASIA por tipo de servicio

        • Pruebas funcionales

        • Pruebas de rendimiento

        • Pruebas de automatización

        • Pruebas de seguridad

      • Mercado de servicios de pruebas de software de MALASIA por tipo de metodología de prueba

        • Pruebas manuales

        • Pruebas automatizadas

      • Mercado de servicios de pruebas de software de MALASIA por tipo de implementación

        • En las instalaciones

        • Basado en la nube

      • Mercado de servicios de pruebas de software de MALASIA por tipo de industria de uso final

        • TI y Telecomunicaciones

        • Cuidado de la salud

        • Banca, servicios financieros y seguros

        • Venta al por menor

        • Fabricación

      • Perspectivas de TAILANDIA (miles de millones de dólares, 2019-2032)

      • Mercado de servicios de pruebas de software de TAILANDIA por tipo de servicio

        • Pruebas funcionales

        • Pruebas de rendimiento

        • Pruebas de automatización

        • Pruebas de seguridad

      • Mercado de servicios de pruebas de software de TAILANDIA por tipo de metodología de prueba

        • Pruebas manuales

        • Pruebas automatizadas

      • Mercado de servicios de pruebas de software de TAILANDIA por tipo de implementación

        • En las instalaciones

        • Basado en la nube

      • Mercado de servicios de pruebas de software de TAILANDIA por tipo de industria de uso final

        • TI y Telecomunicaciones

        • Cuidado de la salud

        • Banca, servicios financieros y seguros

        • Venta al por menor

        • Fabricación

      • Perspectivas de INDONESIA (miles de millones de dólares, 2019-2032)

      • Mercado de servicios de pruebas de software de INDONESIA por tipo de servicio

        • Pruebas funcionales

        • Pruebas de rendimiento

        • Pruebas de automatización

        • Pruebas de seguridad

      • Mercado de servicios de pruebas de software de INDONESIA por tipo de metodología de prueba

        • Pruebas manuales

        • Pruebas automatizadas

      • Mercado de servicios de pruebas de software de INDONESIA por tipo de implementación

        • En las instalaciones

        • Basado en la nube

      • Mercado de servicios de pruebas de software de INDONESIA por tipo de industria de uso final

        • TI y Telecomunicaciones

        • Cuidado de la salud

        • Banca, servicios financieros y seguros

        • Venta al por menor

        • Fabricación

      • Perspectivas del RESTO DE APAC (miles de millones de dólares, 2019-2032)

      • RESTO DEL Mercado de Servicios de Pruebas de Software de APAC por tipo de servicio

        • Pruebas funcionales

        • Pruebas de rendimiento

        • Pruebas de automatización

        • Pruebas de seguridad

      • RESTO DEL MERCADO DE SERVICIOS DE PRUEBAS DE SOFTWARE DE APAC POR TIPO DE METODOLOGÍA DE PRUEBA

        • Pruebas manuales

        • Pruebas automatizadas

      • RESTO DEL Mercado de Servicios de Pruebas de Software de APAC por tipo de implementación

        • En las instalaciones

        • Basado en la nube

      • RESTO DEL Mercado de Servicios de Pruebas de Software de APAC por tipo de industria de uso final

        • TI y Telecomunicaciones

        • Cuidado de la salud

        • Banca, servicios financieros y seguros

        • Venta al por menor

        • Fabricación

    • Perspectivas de América del Sur (miles de millones de dólares, 2019-2032)

      • Mercado de servicios de pruebas de software de América del Sur por tipo de servicio

        • Pruebas funcionales

        • Pruebas de rendimiento

        • Pruebas de automatización

        • Pruebas de seguridad

      • Mercado de servicios de pruebas de software de América del Sur por tipo de metodología de prueba

        • Pruebas manuales

        • Pruebas automatizadas

      • Mercado de servicios de pruebas de software de América del Sur por tipo de implementación

        • En las instalaciones

        • Basado en la nube

      • Mercado de servicios de pruebas de software de América del Sur por tipo de industria de uso final

        • TI y Telecomunicaciones

        • Cuidado de la salud

        • Banca, servicios financieros y seguros

        • Venta al por menor

        • Fabricación

      • Mercado de servicios de pruebas de software de América del Sur por tipo regional

        • Brasil

        • México

        • Argentina

        • Resto de Sudamérica

      • Perspectivas de BRASIL (miles de millones de dólares, 2019-2032)

      • Mercado de servicios de pruebas de software de BRASIL por tipo de servicio

        • Pruebas funcionales

        • Pruebas de rendimiento

        • Pruebas de automatización

        • Pruebas de seguridad

      • Mercado de servicios de pruebas de software de BRASIL por tipo de metodología de prueba

        • Pruebas manuales

        • Pruebas automatizadas

      • Mercado de servicios de pruebas de software de BRASIL por tipo de implementación

        • En las instalaciones

        • Basado en la nube

      • Mercado de servicios de pruebas de software de BRASIL por tipo de industria de uso final

        • TI y Telecomunicaciones

        • Cuidado de la salud

        • Banca, servicios financieros y seguros

        • Venta al por menor

        • Fabricación

      • Perspectivas de MÉXICO (Miles de millones de dólares, 2019-2032)

      • Mercado de servicios de pruebas de software en MÉXICO por tipo de servicio

        • Pruebas funcionales

        • Pruebas de rendimiento

        • Pruebas de automatización

        • Pruebas de seguridad

      • Mercado de servicios de pruebas de software en MÉXICO por tipo de metodología de prueba

        • Pruebas manuales

        • Pruebas automatizadas

      • Mercado de servicios de pruebas de software en MÉXICO por tipo de implementación

        • Premises

        • Basado en la nube

      • Mercado de servicios de pruebas de software en MÉXICO por tipo de industria de uso final

        • TI y Telecomunicaciones

        • Cuidado de la salud

        • Banca, servicios financieros y seguros

        • Venta al por menor

        • Fabricación

      • Perspectivas de ARGENTINA (Miles de millones de dólares, 2019-2032)

      • Mercado ARGENTINA de servicios de pruebas de software por tipo de servicio

        • Pruebas funcionales

        • Pruebas de rendimiento

        • Pruebas de automatización

        • Pruebas de seguridad

      • Mercado ARGENTINA de servicios de pruebas de software por tipo de metodología de prueba

        • Pruebas manuales

        • Pruebas automatizadas

      • Mercado ARGENTINA de servicios de pruebas de software por tipo de implementación

        • En las instalaciones

        • Basado en la nube

      • Mercado ARGENTINA de servicios de pruebas de software por tipo de industria de uso final

        • TI y Telecomunicaciones

        • Cuidado de la salud

        • Banca, servicios financieros y seguros

        • Venta al por menor

        • Fabricación

      • Perspectivas RESTO DE AMÉRICA DEL SUR (Miles de millones de dólares, 2019-2032)

      • RESTO DE AMÉRICA DEL SUR Mercado de servicios de pruebas de software por tipo de servicio

        • Pruebas funcionales

        • Pruebas de rendimiento

        • Pruebas de automatización

        • Pruebas de seguridad

      • Mercado de servicios de pruebas de software del RESTO DE AMÉRICA del SUR por tipo de metodología de prueba

        • Pruebas manuales

        • Pruebas automatizadas

      • RESTO DE AMÉRICA DEL SUR Mercado de servicios de pruebas de software por tipo de implementación

        • En las instalaciones

        • Basado en la nube

      • Mercado de servicios de pruebas de software del RESTO DE AMÉRICA del SUR por tipo de industria de uso final

        • TI y Telecomunicaciones

        • Cuidado de la salud

        • Banca, servicios financieros y seguros

        • Venta al por menor

        • Fabricación

    • Perspectivas MEA (miles de millones de dólares, 2019-2032)

      • Mercado de servicios de pruebas de software de MEA por tipo de servicio

        • Pruebas funcionales

        • Pruebas de rendimiento

        • Pruebas de automatización

        • Pruebas de seguridad

      • Mercado de servicios de prueba de software de MEA por tipo de metodología de prueba

        • Pruebas manuales

        • Pruebas automatizadas

      • Mercado de servicios de pruebas de software de MEA por tipo de implementación

        • En las instalaciones

        • Basado en la nube

      • Mercado de servicios de pruebas de software de MEA por tipo de industria de uso final

        • TI y Telecomunicaciones

        • Cuidado de la salud

        • Banca, servicios financieros y seguros

        • Venta al por menor

        • Fabricación

      • Mercado de servicios de pruebas de software de MEA por tipo regional

        • Países del CCG

        • Sudáfrica

        • Resto de MEA

      • Perspectivas de los PAÍSES del CCG (miles de millones de dólares, 2019-2032)

      • Mercado de servicios de pruebas de software de los PAÍSES del CCG por tipo de servicio

        • Pruebas funcionales

        • Pruebas de rendimiento

        • Pruebas de automatización

        • Pruebas de seguridad

      • Mercado de servicios de prueba de software de los países del CCG por tipo de metodología de prueba

        • Pruebas manuales

        • Pruebas automatizadas

      • Mercado de servicios de pruebas de software de los países del CCG por tipo de implementación

        • En las instalaciones

        • Basado en la nube

      • Mercado de servicios de pruebas de software de los países del CCG por tipo de industria de uso final

        • TI y Telecomunicaciones

        • Cuidado de la salud

        • Banca, servicios financieros y seguros

        • Venta al por menor

        • Fabricación

      • Perspectivas de SUDÁFRICA (miles de millones de dólares, 2019-2032)

      • Mercado de servicios de pruebas de software de SUDÁFRICA por tipo de servicio

        • Pruebas funcionales

        • Pruebas de rendimiento

        • Pruebas de automatización

        • Pruebas de seguridad

      • Mercado de servicios de pruebas de software de SUDÁFRICA por tipo de metodología de prueba

        • Pruebas manuales

        • Pruebas automatizadas

      • Mercado de servicios de pruebas de software de SUDÁFRICA por tipo de implementación

        • En las instalaciones

        • Basado en la nube

      • Mercado de servicios de pruebas de software de SUDÁFRICA por tipo de industria de uso final

        • TI y Telecomunicaciones

        • Cuidado de la salud

        • Banca, servicios financieros y seguros

        • Venta al por menor

        • Fabricación

      • Perspectivas del RESTO DE MEA (miles de millones de dólares, 2019-2032)

      • RESTO DEL Mercado de Servicios de Pruebas de Software de MEA por Tipo de Servicio

        • Pruebas funcionales

        • Pruebas de rendimiento

        • Pruebas de automatización

        • Pruebas de seguridad

      • RESTO DEL Mercado de Servicios de Pruebas de Software de MEA por Tipo de Metodología de Prueba

        • Pruebas manuales

        • Pruebas automatizadas

      • RESTO DEL Mercado de Servicios de Pruebas de Software de MEA por tipo de implementación

        • En las instalaciones

        • Basado en la nube

      • RESTO DEL Mercado de Servicios de Pruebas de Software de MEA por tipo de industria de uso final

        • TI y Telecomunicaciones

        • Cuidado de la salud

        • Banca, servicios financieros y seguros

        • Venta al por menor

        • Fabricación

    Report Infographic

    Free Sample Request

    Kindly complete the form below to receive a free sample of this Report

    Customer Strories

    “I am very pleased with how market segments have been defined in a relevant way for my purposes (such as "Portable Freezers & refrigerators" and "last-mile"). In general the report is well structured. Thanks very much for your efforts.”

    Victoria Milne

    Founder
    Case Study

    Chemicals and Materials