Request Free Sample ×

Kindly complete the form below to receive a free sample of this Report

* Please use a valid business email

Leading companies partner with us for data-driven Insights

clients tt-cursor
Hero Background

Retail E-commerce Packaging Market

ID: MRFR/PCM/1359-CR
111 Pages
Snehal Singh
Last Updated: February 10, 2026

Informe de investigación de mercado de embalajes para comercio electrónico minorista: pronóstico hasta 2032

Compartir
Download PDF ×

We do not share your information with anyone. However, we may send you emails based on your report interest from time to time. You may contact us at any time to opt-out.

Retail E-commerce Packaging Market Infographic
Purchase Options
  1. 1 Resumen ejecutivo
  2. 2 Introducción
    1. 2.1 Definición 15
    2. 2.2 Alcance del estudio 15
    3. 2.3 Supuestos 15
    4. 2.4 Estructura del mercado 16
  3. 3 Metodología de la investigación
    1. 3.1 Proceso de investigación 17
    2. 3.2 Investigación primaria 18
    3. 3.3 Investigación secundaria 18
    4. 3.4 Estimación del tamaño del mercado 18
    5. 3.5 Modelo de pronóstico 20
  4. 4 Dinámica del mercado
    1. 4.1 Impulsores 22
      1. 4.1.1 Aumento del mercado de compras en línea 22
      2. 4.1.2 Creciente demanda de alimentos envasados ​​22
      3. 4.1.3 Crecimiento rápido del sector electrónico 23
    2. 4.2 Restricciones 24
      1. 4.2.1 Regulación gubernamental para embalajes de cartón corrugado 24
      2. 4.2.2 Aumento de la seguridad ambiental 24
    3. 4.3 Oportunidad 24
      1. 4.3.1 Creciente demanda de embalajes protectores 24
      2. 4.3.2 Aumento de la renta disponible en los países en desarrollo 24
  5. 5 Análisis de factores de mercado
    1. 5.1 Análisis de las 5 fuerzas de Porter 26
      1. 5.1.1 Amenaza de nuevos participantes 26
      2. 5.1.2 Poder de negociación de los proveedores 27
      3. 5.1.3 Poder de negociación de los compradores 27
      4. 5.1.4 Amenaza de sustitutos 27
      5. 5.1.5 Rivalidad 27
    2. 5.2 Análisis de la cadena de valor 28
  6. 6 Comercio electrónico minorista global Mercado de embalajes, por material
    1. 6.1 Descripción general 30
      1. 6.1.1 Embalaje protector 32
      2. 6.1.2 Cajas de cartón corrugado 32
      3. 6.1.3 Sobres de seguridad 32
      4. 6.1.4 Cintas y etiquetas 32
      5. 6.1.5 Otros 32
  7. 7 Mercado global de embalajes para comercio electrónico minorista, por aplicación
    1. 7.1 Descripción general 34
      1. 7.1.1 Electrónica y bienes de consumo 36
      2. 7.1.2 Ropa y accesorios 36
      3. 7.1.3 Decoración del hogar 36
      4. 7.1.4 Autopartes 36
      5. 7.1.5 Alimentos y bebidas 36
      6. 7.1.6 Atención médica y Cuidado personal 37
      7. 7.1.7 Otros 37
  8. 8 Mercado global de embalajes para comercio electrónico minorista, por región
    1. 8.1 Introducción 39
    2. 8.2 Norteamérica 40
      1. 8.2.1 EE. UU. 43
      2. 8.2.2 Canadá 46
    3. 8.3 Europa 48
      1. 8.3.1 Alemania 51
      2. 8.3.2 Reino Unido 54
      3. 8.3.3 Francia 56
      4. 8.3.4 España 58
      5. 8.3.5 Resto de Europa 60
    4. 8.4 Asia-Pacífico 62
      1. 8.4.1 China 65
      2. 8.4.2 Japón 67
      3. 8.4.3 India 69
      4. 8.4.4 Resto de Asia-Pacífico 71
    5. 8.5 Resto del mundo 73
      1. 8.5.1 Oriente Medio y África 76
      2. 8.5.2 Sudamérica 78
  9. 9 Escenario competitivo
    1. 9.1 Descripción general 81
      1. 9.1.1 Fusiones y adquisiciones 83
  10. 10 Perfiles de empresas
    1. 10.1 International Paper Company 84
      1. 10.1.1 Descripción general de la empresa 84
      2. 10.1.2 Descripción financiera 85
      3. 10.1.3 Oferta de productos/servicios 86
      4. 10.1.4 Estrategia 86
      5. 10.1.5 Estrategia clave (2022-2022) 86
      6. 10.1.6 International Paper Company: Análisis FODA 87
    2. 10.2 Nippon Paper Industries Co. Ltd. 88
      1. 10.2.1 Descripción general de la empresa 88
      2. 10.2.2 Resumen financiero 88
      3. 10.2.3 Oferta de productos/servicios 89
      4. 10.2.4 Estrategia 89
      5. 10.2.5 NIPPON PAPER INDUSTRIES CO. LTD.: Análisis FODA 90
    3. 10.3 Smurfit Kappa Group 91
      1. 10.3.1 Resumen de la empresa 91
      2. 10.3.2 Resumen financiero 91
      3. 10.3.3 Oferta de productos/servicios 92
      4. 10.3.4 Estrategia 92
      5. 10.3.5 Smurfit Kappa Group: Análisis FODA 93
    4. 10.4 Mondi Group 94
      1. 10.4.1 Resumen de la empresa 94
      2. 10.4.2 Resumen financiero 94
      3. 10.4.3 Oferta de productos/servicios 95
      4. 10.4.4 Estrategia 96
      5. 10.4.5 Mondi Group: Análisis FODA 97
    5. 10.5 DS Smith Plc. 98
      1. 10.5.1 Descripción general de la empresa 98
      2. 10.5.2 Descripción financiera 98
      3. 10.5.3 Oferta de productos/servicios 99
      4. 10.5.4 Estrategia 99
      5. 10.5.5 D.S Smith: Análisis FODA 100
    6. 10.6 Packaging Corporation of America 101
      1. 10.6.1 Descripción general de la empresa 101
      2. 10.6.2 Descripción financiera 101
      3. 10.6.3 Oferta de productos/servicios 102
      4. 10.6.4 Estrategia 102
      5. 10.6.5 Packaging Corporation of America: Análisis FODA 103
    7. 10.7 Rengo Co. Ltd 104
      1. 10.7.1 Descripción general de la empresa 104
      2. 10.7.2 Resumen financiero 104
      3. 10.7.3 Oferta de productos/servicios 105
      4. 10.7.4 Estrategia 105
      5. 10.7.5 Rengo Co. Ltd: Análisis FODA 106
    8. 10.8 Orora Packaging Australia Pty Ltd. 107
      1. 10.8.1 Resumen de la empresa 107
      2. 10.8.2 Resumen financiero 107
      3. 10.8.3 Oferta de productos/servicios 108
      4. 10.8.4 Estrategia 108
      5. 10.8.5 Orora Packaging: Análisis FODA 109
    9. 10.9 Klabin S.A. 110
      1. 10.9.1 Resumen de la empresa 110
      2. 10.9.2 Resumen financiero 110
      3. 10.9.3 Oferta de productos/servicios 111
      4. 10.9.4 Estrategia 112
      5. 10.9.5 Klabin S.A.: Análisis FODA 113
    10. 10.10 Georgia-Pacific LLC 114
      1. 10.10.1 Descripción general de la empresa 114
      2. 10.10.2 Descripción general financiera 114
      3. 10.10.3 Oferta de productos/servicios 114
      4. 10.10.4 Estrategia 115
      5. 10.10.5 Georgia-Pacific LLC: Análisis FODA 116
  11. 11 Lista de tablas
    1. TABLA 1 SINOPSIS DEL MERCADO 14
    2. TABLA 2 PIB PER CÁPITA EN PAÍSES EN DESARROLLO (USD) 25
    3. TABLA 3 MERCADO MUNDIAL DE EMBALAJES PARA COMERCIO ELECTRÓNICO MINORISTA, POR MATERIAL, 2022-2030 (MILLONES DE USD) 31
    4. TABLA 4 MERCADO MUNDIAL DE EMBALAJES PARA COMERCIO ELECTRÓNICO MINORISTA, POR APLICACIÓN, 2022-2030 (MILLONES DE USD) 35
    5. TABLA 5 MERCADO MUNDIAL DE EMBALAJES PARA COMERCIO ELECTRÓNICO MINORISTA, POR REGIÓN, 2022-2030 (MILLONES DE USD) 40
    6. TABLA 6 AMÉRICA DEL NORTE: MERCADO DE EMBALAJES PARA COMERCIO ELECTRÓNICO MINORISTA, POR PAÍS, 2022-2030 (MILLONES DE USD) 41
    7. TABLA 7 AMÉRICA DEL NORTE: TAMAÑO DEL MERCADO DE COMERCIO ELECTRÓNICO MINORISTA, POR MATERIAL, 2022-2030 (MILLONES DE USD) 42
    8. TABLA 8 AMÉRICA DEL NORTE: TAMAÑO DEL MERCADO DE COMERCIO ELECTRÓNICO MINORISTA, POR APLICACIÓN, 2022-2030 (MILLONES DE USD) 43
    9. TABLA 9 EE. UU.: MERCADO DE COMERCIO ELECTRÓNICO MINORISTA, POR MATERIAL, 2022-2030 (MILLONES DE USD) 44
    10. TABLA 10 EE. UU.: MERCADO DE COMERCIO ELECTRÓNICO MINORISTA, POR APLICACIÓN, 2022-2030 (MILLONES DE USD) 45
    11. TABLA 11 CANADÁ: MERCADO DE COMERCIO ELECTRÓNICO MINORISTA, POR MATERIAL, 2022-2030 (MILLONES DE USD) 46
    12. TABLA 12 CANADÁ: MERCADO DE COMERCIO ELECTRÓNICO MINORISTA, POR APLICACIÓN, 2022-2030 (MILLONES DE USD) 47
    13. TABLA 13 EUROPA: MERCADO DE COMERCIO ELECTRÓNICO MINORISTA, POR PAÍS, 2022-2030 (MILLONES DE USD) 49
    14. TABLA 14 EUROPA: MERCADO DE COMERCIO ELECTRÓNICO MINORISTA, POR MATERIAL, 2022-2030 (MILLONES DE USD) 50
    15. TABLA 15 EUROPA: MERCADO DE EMBALAJES DE COMERCIO ELECTRÓNICO MINORISTA, POR APLICACIÓN, 2022-2030 (MILLONES DE USD) 51
    16. TABLA 16 ALEMANIA: MERCADO DE EMBALAJES DE COMERCIO ELECTRÓNICO MINORISTA, POR MATERIAL, 2022-2030 (MILLONES DE USD) 52
    17. TABLA 17 ALEMANIA: MERCADO DE EMBALAJES DE COMERCIO ELECTRÓNICO MINORISTA, POR APLICACIÓN, 2022-2030 (MILLONES DE USD) 53
    18. TABLA 18 REINO UNIDO: MERCADO DE EMBALAJES PARA COMERCIO ELECTRÓNICO MINORISTA, POR MATERIAL, 2022-2030 (MILLONES DE USD) 54
    19. TABLA 19 REINO UNIDO: MERCADO DE EMBALAJES PARA COMERCIO ELECTRÓNICO MINORISTA, POR APLICACIÓN, 2022-2030 (MILLONES DE USD) 55
    20. TABLA 20 FRANCIA: MERCADO DE EMBALAJES PARA COMERCIO ELECTRÓNICO MINORISTA, POR MATERIAL, 2022-2030 (MILLONES DE USD) 56
    21. TABLA 21 FRANCIA: MERCADO DE EMBALAJES PARA COMERCIO ELECTRÓNICO MINORISTA, POR APLICACIÓN, 2022-2030 (MILLONES DE USD) 57
    22. TABLA 22 ESPAÑA: MERCADO DE EMBALAJES PARA COMERCIO ELECTRÓNICO MINORISTA, POR MATERIAL, 2022-2030 (MILLONES DE USD) 58
    23. TABLA 23 ESPAÑA: MERCADO DE EMBALAJES PARA COMERCIO ELECTRÓNICO MINORISTA, POR APLICACIÓN, 2022-2030 (MILLONES DE USD) 59
    24. TABLA 24 RESTO DE EUROPA MINORISTA: MERCADO DE EMBALAJES PARA COMERCIO ELECTRÓNICO, POR MATERIAL, 2022-2030 (MILLONES DE USD) 60
    25. TABLA 25 RESTO DE EUROPA: MERCADO DE EMBALAJES PARA COMERCIO ELECTRÓNICO MINORISTA, POR APLICACIÓN, 2022-2030 (MILLONES DE USD) 61
    26. TABLA 26 ASIA-PACÍFICO: MERCADO DE EMBALAJES PARA COMERCIO ELECTRÓNICO MINORISTA, POR PAÍS, 2022-2030 (MILLONES DE USD) 62
    27. TABLA 27 ASIA-PACÍFICO: MERCADO DE EMBALAJES PARA COMERCIO ELECTRÓNICO MINORISTA, POR MATERIAL, 2022-2030 (MILLONES DE USD) 63
    28. TABLA 28 ASIA-PACÍFICO: MERCADO DE EMBALAJES PARA COMERCIO ELECTRÓNICO MINORISTA, POR APLICACIÓN, 2022-2030 (MILLONES DE USD) 64
    29. TABLA 29 CHINA: MERCADO DE EMBALAJES PARA COMERCIO ELECTRÓNICO MINORISTA, POR MATERIAL, 2022-2030 (MILLONES DE USD) 65
    30. TABLA 30 CHINA: MERCADO DE EMBALAJES PARA COMERCIO ELECTRÓNICO MINORISTA, POR APLICACIÓN, 2022-2030 (MILLONES DE USD) 66
    31. TABLA 31 JAPÓN: MERCADO DE EMBALAJES PARA COMERCIO ELECTRÓNICO MINORISTA, POR MATERIAL, 2022-2030 (MILLONES DE USD) 67
    32. TABLA 32 JAPÓN: MERCADO DE EMBALAJES PARA COMERCIO ELECTRÓNICO MINORISTA, POR APLICACIÓN, 2022-2030 (MILLONES DE USD) 68
    33. TABLA 33 INDIA: MERCADO DE EMBALAJES PARA COMERCIO ELECTRÓNICO MINORISTA, POR MATERIAL, 2022-2030 (MILLONES DE USD) 69
    34. TABLA 34 INDIA: MERCADO DE EMBALAJES PARA COMERCIO ELECTRÓNICO MINORISTA, POR APLICACIÓN, 2022-2030 (MILLONES DE USD) 70
    35. TABLA 35 RESTO DE ASIA-PACÍFICO: MERCADO DE EMBALAJES PARA COMERCIO ELECTRÓNICO MINORISTA, POR MATERIAL, 2022-2030 (MILLONES DE USD) 71
    36. TABLA 36 RESTO DE ASIA-PACÍFICO: MERCADO DE EMBALAJES PARA COMERCIO ELECTRÓNICO MINORISTA, POR MATERIAL, 2022-2030 (USD MILLONES) 71
    37. TABLA 37 RESTO DE ASIA-PACÍFICO: MERCADO DE EMBALAJES PARA COMERCIO ELECTRÓNICO MINORISTA, POR APLICACIÓN, 2022-2030 (USD MILLONES) 72
    38. TABLA 38 FILA: MERCADO DE EMBALAJES PARA COMERCIO ELECTRÓNICO MINORISTA, POR PAÍS, 2022-2030 (USD MILLONES) 73
    39. TABLA 39 FILA: MERCADO DE EMBALAJES PARA COMERCIO ELECTRÓNICO MINORISTA, POR MATERIAL, 2022-2030 (USD MILLONES) 74
    40. TABLA 40 FILA: MERCADO DE EMBALAJES PARA COMERCIO ELECTRÓNICO MINORISTA, POR APLICACIÓN, 2022-2030 (USD MILLONES) 75
    41. TABLA 41 ORIENTE MEDIO Y ÁFRICA: MERCADO DE EMBALAJES PARA COMERCIO ELECTRÓNICO MINORISTA, POR MATERIAL, 2022-2030 (MILLONES DE USD) 76
    42. TABLA 42 ORIENTE MEDIO Y ÁFRICA: MERCADO DE EMBALAJES PARA COMERCIO ELECTRÓNICO MINORISTA, POR APLICACIÓN, 2022-2030 (MILLONES DE USD) 77
    43. TABLA 43 AMÉRICA DEL SUR: MERCADO DE EMBALAJES PARA COMERCIO ELECTRÓNICO MINORISTA, POR MATERIAL, 2022-2030 (MILLONES DE USD) 78
    44. TABLA 44 AMÉRICA DEL SUR: MERCADO DE EMBALAJES PARA COMERCIO ELECTRÓNICO MINORISTA, POR APLICACIÓN, 2022-2030 (MILLONES DE USD) 80
  12. 12 Lista de figuras
    1. FIGURA 1 PROCESO DE INVESTIGACIÓN DE MRFR 17
    2. FIGURA 2 ENFOQUE DE ARRIBA HACIA ABAJO Y DE ABAJO HACIA ARRIBA 19
    3. FIGURA 3 IMPULSORES Y ANÁLISIS DEL IMPACTO DE LAS RESTRICCIONES DEL MERCADO MUNDIAL DE EMBALAJES PARA EL COMERCIO ELECTRÓNICO MINORISTA 21
    4. FIGURA 4 COMPARACIÓN DE INGRESOS TOTALES ENTRE AMAZON Y EBAY, 2022-2030 (USD MILLONES) 22
    5. FIGURA 5 VENTAS EN EL MERCADO MUNDIAL DE BEBIDAS, 2007-2017, (MILLONES DE LITROS) 23
    6. FIGURA 6 PRODUCCIÓN MUNDIAL DE ELECTRÓNICA, 2012 (USD MILLONES) 23
    7. FIGURA 7 ANÁLISIS DE LAS 5 FUERZAS DE PORTER DEL MERCADO MUNDIAL DE EMBALAJES PARA EL COMERCIO ELECTRÓNICO MINORISTA 26
    8. FIGURA 8 MERCADO MUNDIAL DE EMBALAJES PARA EL COMERCIO ELECTRÓNICO MINORISTA, POR MATERIAL, 2022 (EN %) 30
    9. FIGURA 9 MERCADO MUNDIAL DE EMBALAJES PARA EL COMERCIO ELECTRÓNICO MINORISTA, POR MATERIAL, 2022-2030 (USD MILLONES) 31
    10. FIGURA 10 MERCADO MUNDIAL DE EMBALAJES PARA COMERCIO ELECTRÓNICO MINORISTA, POR APLICACIÓN, 2022 (%) 34
    11. FIGURA 11 MERCADO MUNDIAL DE EMBALAJES PARA COMERCIO ELECTRÓNICO MINORISTA, POR APLICACIÓN, 2022-2030 (MILLONES DE USD) 35
    12. FIGURA 12 MERCADO MUNDIAL DE EMBALAJES PARA COMERCIO ELECTRÓNICO MINORISTA, POR REGIÓN, 2022-2030 (MILLONES DE USD) 39
    13. FIGURA 13 AMÉRICA DEL NORTE: CUOTA DE MERCADO DE EMBALAJES PARA COMERCIO ELECTRÓNICO MINORISTA, POR PAÍS, 2022 (% DE CUOTA) 40
    14. FIGURA 14 AMÉRICA DEL NORTE: TAMAÑO DEL MERCADO DE EMBALAJES PARA COMERCIO ELECTRÓNICO MINORISTA, POR MATERIAL, 2022-2030 (USD MILLONES) 41
    15. FIGURA 15 AMÉRICA DEL NORTE: CUOTA DE MERCADO DE EMBALAJES PARA COMERCIO ELECTRÓNICO MINORISTA, POR APLICACIÓN, 2022 (% DE PARTICIPACIÓN) 42
    16. FIGURA 16 EE. UU.: MERCADO DE EMBALAJES PARA COMERCIO ELECTRÓNICO MINORISTA, POR MATERIAL, 2022-2030 (USD MILLONES) 44
    17. FIGURA 17 EE. UU.: CUOTA DE MERCADO DE EMBALAJES PARA COMERCIO ELECTRÓNICO MINORISTA, POR APLICACIÓN, 2022 (% DE PARTICIPACIÓN) 45
    18. FIGURA 18 CANADÁ: MERCADO DE EMBALAJES PARA COMERCIO ELECTRÓNICO MINORISTA, POR MATERIAL, 2022-2030 (USD MILLONES) 46
    19. FIGURA 19 CANADÁ: EMBALAJES PARA COMERCIO ELECTRÓNICO MINORISTA CUOTA DE MERCADO DE EMBALAJES PARA COMERCIO ELECTRÓNICO, POR APLICACIÓN, 2022 (% DE CUOTA) 47
    20. FIGURA 20 EUROPA: MERCADO DE EMBALAJES PARA COMERCIO ELECTRÓNICO MINORISTA, POR REGIÓN, 2022-2030 (MILLONES DE USD) 48
    21. FIGURA 21 EUROPA: MERCADO DE EMBALAJES PARA COMERCIO ELECTRÓNICO MINORISTA, POR MATERIAL, 2022-2030 (MILLONES DE USD) 49
    22. FIGURA 22 EUROPA: CUOTA DE MERCADO DE EMBALAJES PARA COMERCIO ELECTRÓNICO MINORISTA, POR APLICACIÓN, 2022 (% DE CUOTA) 50
    23. FIGURA 23 ALEMANIA: MERCADO DE EMBALAJES PARA COMERCIO ELECTRÓNICO MINORISTA, POR REGIÓN, 2022-2030 (MILLONES DE USD) 52
    24. FIGURA 24 ALEMANIA: CUOTA DE MERCADO DE EMBALAJES PARA COMERCIO ELECTRÓNICO MINORISTA, POR APLICACIÓN, 2022 (% DE PARTICIPACIÓN) 53
    25. FIGURA 25 REINO UNIDO: MERCADO DE EMBALAJES PARA COMERCIO ELECTRÓNICO MINORISTA, POR MATERIAL, 2022-2030 (MILLONES DE USD) 54
    26. FIGURA 26 REINO UNIDO: CUOTA DE MERCADO DE EMBALAJES PARA COMERCIO ELECTRÓNICO MINORISTA, POR APLICACIÓN, 2022 (% DE PARTICIPACIÓN) 55
    27. FIGURA 27 FRANCIA: MERCADO DE EMBALAJES PARA COMERCIO ELECTRÓNICO MINORISTA, POR MATERIAL, 2022-2030 (MILLONES DE USD) 56
    28. FIGURA 28 FRANCIA: CUOTA DE MERCADO DE EMBALAJES PARA COMERCIO ELECTRÓNICO MINORISTA, POR APLICACIÓN, 2022 (% PARTICIPACIÓN) 57
    29. FIGURA 29 ESPAÑA: MERCADO DE EMBALAJES PARA COMERCIO ELECTRÓNICO MINORISTA, POR MATERIAL, 2022-2030 (MILLONES DE USD) 58
    30. FIGURA 30 SPIAN: CUOTA DE MERCADO DE EMBALAJES PARA COMERCIO ELECTRÓNICO MINORISTA, POR APLICACIÓN, 2022 (% PARTICIPACIÓN) 59
    31. FIGURA 31 RESTO DE EUROPA: CUOTA DE MERCADO DE EMBALAJES PARA COMERCIO ELECTRÓNICO MINORISTA, POR MATERIAL, 2022 (EN %) 60
    32. FIGURA 32 RESTO DE EUROPA: MERCADO DE EMBALAJES PARA COMERCIO ELECTRÓNICO MINORISTA, POR APLICACIÓN, 2022-2030 (MILLONES DE USD) 61
    33. FIGURA 33 ASIA-PACÍFICO: MERCADO DE EMBALAJES PARA COMERCIO ELECTRÓNICO MINORISTA, POR PAÍS, 2022-2030 (MILLONES DE USD) 62
    34. FIGURA 34 ASIA-PACÍFICO: MERCADO DE EMBALAJES PARA COMERCIO ELECTRÓNICO MINORISTA, POR MATERIAL, 2022-2030 (MILLONES DE USD) 63
    35. FIGURA 35 ASIA-PACÍFICO: CUOTA DE MERCADO DE EMBALAJES PARA COMERCIO ELECTRÓNICO MINORISTA, POR APLICACIÓN, 2022-2030 (MILLONES DE USD) 64
    36. FIGURA 36 CHINA: VENTA MINORISTA MERCADO DE EMBALAJES PARA COMERCIO ELECTRÓNICO, POR MATERIAL, 2022-2030 (MILLONES DE USD) 65
    37. FIGURA 37 CHINA: MERCADO DE EMBALAJES PARA COMERCIO ELECTRÓNICO MINORISTA, POR APLICACIÓN, 2022-2030 (MILLONES DE USD) 66
    38. FIGURA 38 JAPÓN: MERCADO DE EMBALAJES PARA COMERCIO ELECTRÓNICO MINORISTA, POR MATERIAL, 2022-2030 (MILLONES DE USD) 67
    39. FIGURA 39 JAPÓN: CUOTA DE MERCADO DE EMBALAJES PARA COMERCIO ELECTRÓNICO MINORISTA, POR APLICACIÓN, 2022 (EN %) 68
    40. FIGURA 40 INDIA: CUOTA DE MERCADO DE EMBALAJES PARA COMERCIO ELECTRÓNICO MINORISTA, POR MATERIAL, 2022 (EN %) 69
    41. FIGURA 41 INDIA: MERCADO DE EMBALAJES PARA COMERCIO ELECTRÓNICO MINORISTA, POR APLICACIÓN, 2022-2030 (MILLONES DE USD) 70
    42. FIGURA 42 RESTO DE ASIA-PACÍFICO: CUOTA DE MERCADO DE EMBALAJES PARA COMERCIO ELECTRÓNICO MINORISTA, POR APLICACIÓN, 2022 (MILLONES DE USD) 72
    43. FIGURA 43 FILA: MERCADO DE EMBALAJES PARA COMERCIO ELECTRÓNICO MINORISTA, POR PAÍS, 2022-2030 (MILLONES DE USD) 73
    44. FIGURA 44 FILA: MERCADO DE EMBALAJES PARA COMERCIO ELECTRÓNICO MINORISTA, POR MATERIAL, 2022-2030 (EN %) 74
    45. FIGURA 45 FILA: TAMAÑO DEL MERCADO DE EMBALAJES PARA COMERCIO ELECTRÓNICO MINORISTA, POR APLICACIÓN, 2022 (EN %) 75
    46. FIGURA 46 ORIENTE MEDIO Y ÁFRICA: MERCADO DE EMBALAJES PARA COMERCIO ELECTRÓNICO MINORISTA, POR MATERIAL, 2022-2030 (MILLONES DE USD) 76
    47. FIGURA 47 ORIENTE MEDIO Y ÁFRICA: MERCADO DE EMBALAJES PARA COMERCIO ELECTRÓNICO MINORISTA, POR MATERIAL, 2022-2030 (MILLONES DE USD) ÁFRICA: MERCADO DE EMBALAJES PARA COMERCIO ELECTRÓNICO MINORISTA, POR PAÍS, 2022 (EN %) 77
    48. FIGURA 48 SUDAMÉRICA: MERCADO DE EMBALAJES PARA COMERCIO ELECTRÓNICO MINORISTA, POR MATERIAL, 2022-2030 (MILLONES DE USD) 78
    49. FIGURA 49 SUDAMÉRICA: MERCADO DE EMBALAJES PARA COMERCIO ELECTRÓNICO MINORISTA, POR APLICACIÓN, 2022 (EN %) 79
    50. FIGURA 50 ESTRATEGIAS DE CRECIMIENTO ADOPTADAS POR LOS ACTORES CLAVE EN EL MERCADO GLOBAL DE EMBALAJES PARA COMERCIO ELECTRÓNICO MINORISTA, 2022-2030, (EN %) 81
    51. FIGURA 51 FUSIÓN Y ADQUISICIÓN: % DE PARTICIPACIÓN DE LOS ACTORES CLAVE, 2022-2030, (EN %) 83
    52. FIGURA 52 INTERNATIONAL PAPER COMPANY.: INGRESOS TOTALES VS INGRESOS SEGMENTALES (PAPELES PARA EMBALAJES INDUSTRIALES E IMPRESIÓN), (2022-2030)) 85
    53. FIGURA 53 INTERNATIONAL PAPER COMPANY: MEZCLA DE INGRESOS GEOGRÁFICOS (2022) 85
    54. FIGURA 54 NIPPON PAPER INDUSTRIES CO. LTD.: INGRESOS TOTALES VS INGRESOS SEGMENTALES (MILLONES DE USD) 88
    55. FIGURA 55 NIPPON PAPER INDUSTRIES CO. LTD.: DESARROLLOS CLAVE, 2022-2030 (%) 89
    56. FIGURA 56 SMURFIT KAPPA GROUP: TOTAL INGRESOS, 2013 A 2022 (MILLONES DE USD) 91
    57. FIGURA 57 GRUPO SMURFIT KAPPA: MEZCLA DE INGRESOS GEOGRÁFICOS, 2022 (%) 92
    58. FIGURA 58 GRUPO SMURFIT KAPPA: DESARROLLOS CLAVE, 2022-2030 (%) 93
    59. FIGURA 59 GRUPO MONDI: INGRESOS TOTALES VS. INGRESOS SEGMENTALES (EMPAQUE DE FIBRA), (2022-2030) 94
    60. FIGURA 60 GRUPO MONDI: INGRESOS SEGMENTALES, 2022 (%) 95
    61. FIGURA 61 GRUPO MONDI: MEZCLA DE INGRESOS GEOGRÁFICOS, 2022 (%) 95
    62. FIGURA 62 MONDI GROUP: DESARROLLOS CLAVE, 2022-2030 (%) 96
    63. FIGURA 63 DS SMITH.: INGRESOS TOTALES (2022-2030) 98
    64. FIGURA 64 DS SMITH.: MEZCLA DE INGRESOS GEOGRÁFICOS, 2022 (%) 99
    65. FIGURA 65 D.S SMITH: DESARROLLOS CLAVE, 2022-2030 (%) 100
    66. FIGURA 66 PACKAGING CORPORATION OF AMERICA.: INGRESOS TOTALES VS. INGRESOS SEGMENTALES (EMPAQUE) 101
    67. FIGURA 67 PACKAGING CORPORATION OF AMERICA: MEZCLA DE INGRESOS GEOGRÁFICOS, 2022 (%) 102
    68. FIGURA 68 PACKAGING CORPORATION OF AMERICA: DESARROLLOS CLAVE, 2022-2030 (%) 103
    69. FIGURA 69 RENGO CO. LTD: INGRESOS TOTALES VS. INGRESOS SEGMENTALES, 2022-2030 (MILLONES DE USD) 104
    70. FIGURA 70 RENGO CO. LTD: DESARROLLOS CLAVE, 2022-2030 (%) 105
    71. FIGURA 71 ORORA PACKAGING: INGRESOS TOTALES VS. INGRESOS SEGMENTALES, 2022-2030 (MILLONES DE USD) 107
    72. FIGURA 72 ORORA PACKAGING: MEZCLA DE INGRESOS GEOGRÁFICOS, 2022 (%) 108
    73. FIGURA 73 ORORA PACKAGING: DESARROLLOS CLAVE, 2022-2030 (%) 109
    74. FIGURA 74 KLABIN S.A.: INGRESOS TOTALES VS. INGRESOS POR SEGMENTO, 2022-2030 (USD MILLONES) 110
    75. FIGURA 75 KLABIN S.A.: MIX DE INGRESOS POR ZONAS GEOGRÁFICAS, 2022 (%) 111
    76. FIGURA 76 KLABIN S.A.: DESARROLLOS CLAVE, 2022-2030 (%) 112
    77. FIGURA 77 GEORGIA-PACIFIC LLC: DESARROLLOS CLAVE, 2022-2030 (%) 115

Embalaje para comercio electrónico minoristaSegmentación del mercado

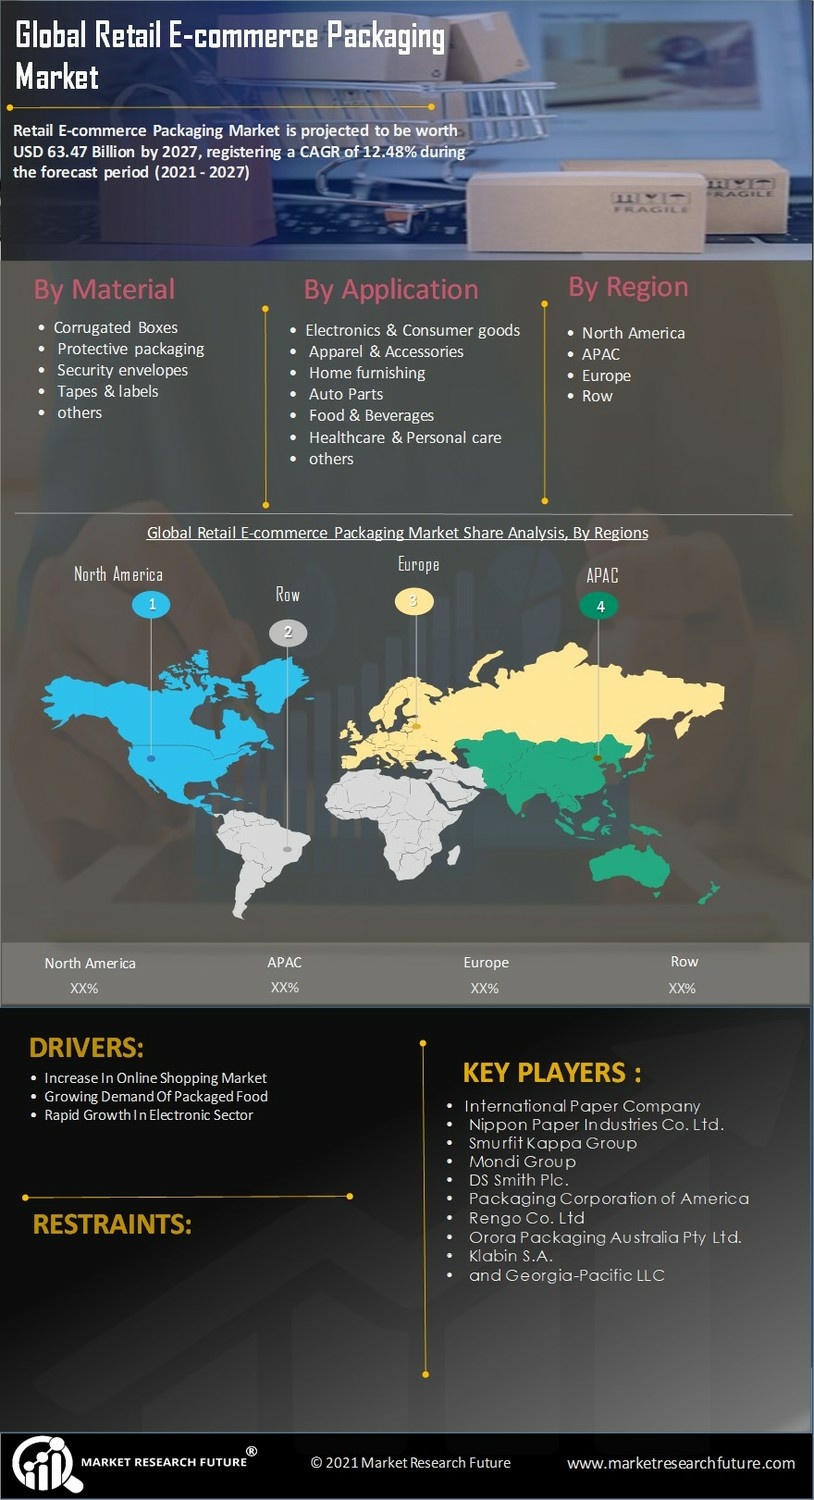
Perspectivas de materiales de embalaje para comercio electrónico minorista (millones de USD, 2019-2030)

  • Cajas de cartón corrugado

  • Embalaje protector

  • Sobres de seguridad

  • Cintas y etiquetas

  • Otros

Perspectivas de aplicaciones de embalaje para comercio electrónico minorista (millones de USD, 2019-2030)

  • Electrónica y bienes de consumo

  • Ropa y Accesorios

  • Muebles para el hogar

  • Autopartes

  • Alimentos y bebidas

  • Salud y Cuidado personal

  • Otros

Panorama regional del embalaje para comercio electrónico minorista (millones de USD, 2019-2030)

  • Panorama de América del Norte (millones de USD, 2019-2030)

    • Embalaje para comercio electrónico minorista en América del Norte por material

      • Cajas de cartón corrugado

      • Embalaje protector

      • Sobres de seguridad

      • Cintas y Etiquetas

      • Otros

    • Empaques para comercio electrónico minorista en Norteamérica por aplicación

      • Electrónica y bienes de consumo

      • Ropa y accesorios

      • Muebles para el hogar

      • Autopartes

      • Alimentos y bebidas

      • Atención médica y Cuidado personal

      • Otros

    • Perspectivas de EE. UU. (millones de USD, 2019-2030)

    • Embalaje para comercio electrónico minorista en EE. UU. por material

      • Cajas de cartón corrugado

      • Embalaje protector

      • Sobres de seguridad

      • Cintas y etiquetas

      • Otros

    • Embalaje para comercio electrónico minorista en EE. UU. por aplicación

      • Electrónica y Bienes de consumo

      • Ropa y accesorios

      • Muebles para el hogar

      • Autopartes

      • Alimentos y bebidas

      • Atención médica y Cuidado personal

      • Otros

    • CANADÁPerspectivas (millones de USD, 2019-2030)

    • CANADÁ: Embalaje para comercio electrónico minorista por material

      • Cajas de cartón corrugado

      • Embalaje protector

      • Sobres de seguridad

      • Cintas y etiquetas

      • Otros

    • CANADÁ: Embalaje para comercio electrónico minorista por aplicación

      • Electrónica y Bienes de consumo

      • Ropa y accesorios

      • Muebles para el hogar

      • Autopartes

      • Alimentos y bebidas

      • Atención médica y Cuidado personal

      • Otros

  • Perspectivas en Europa (millones de USD, 2019-2030)

    • Embalaje para comercio electrónico minorista en Europa por material

      • Cajas de cartón corrugado

      • Embalaje protector

      • Sobres de seguridad

      • Cintas y etiquetas

      • Otros

    • Embalaje para comercio electrónico minorista en Europa por aplicación

      • Electrónica y Bienes de consumo

      • Ropa y accesorios

      • Muebles para el hogar

      • Autopartes

      • Alimentos y bebidas

      • Cuidado de la salud y cuidado personal

      • Otros

    • Perspectivas de Alemania (millones de USD, 2019-2030)

    • Embalaje de comercio electrónico minorista en Alemania por material

      • Cajas de cartón corrugado

      • Embalaje protector

      • Sobres de seguridad

      • Cintas y Etiquetas

      • Otros

    • Empaques para comercio electrónico minorista en Alemania por aplicación

      • Electrónica y bienes de consumo

      • Ropa y accesorios

      • Muebles para el hogar

      • Autopartes

      • Alimentos y bebidas

      • Atención médica y Cuidado personal

      • Otros

    • Perspectivas de Francia (millones de USD, 2019-2030)

    • Embalaje para comercio electrónico minorista en Francia por material

      • Cajas de cartón corrugado

      • Embalaje protector

      • Sobres de seguridad

      • Cintas y etiquetas

      • Otros

    • Embalaje para comercio electrónico minorista en Francia por aplicación

      • Electrónica y bienes de consumo

      • Ropa y Accesorios

      • Muebles para el hogar

      • Autopartes

      • Alimentos y bebidas

      • Cuidado personal y de la salud

      • Otros

    • Perspectivas del Reino Unido (millones de USD, 2019-2030)

    • Embalaje para comercio electrónico minorista en el Reino Unido por material

      • Cajas de cartón corrugado

      • Embalaje protector

      • Sobres de seguridad

      • Cintas y Etiquetas

      • Otros

    • Embalaje para comercio electrónico minorista en el Reino Unido por aplicación

      • Electrónica y bienes de consumo

      • Ropa y accesorios

      • Muebles para el hogar

      • Autopartes

      • Alimentos y bebidas

      • Atención médica y Cuidado personal

      • Otros

    • ITALIAPerspectivas (millones de USD, 2019-2030)

    • ITALIA: Embalaje para comercio electrónico minorista por material

      • Cajas de cartón corrugado

      • Embalaje protector

      • Sobres de seguridad

      • Cintas y etiquetas

      • Otros

    • ITALIA: Embalaje para comercio electrónico minorista por aplicación

      • Electrónica y Bienes de consumo

      • Ropa y accesorios

      • Artículos para el hogar

      • Autopartes

      • Alimentos y bebidas

      • Cuidado de la salud y cuidado personal

      • Otros

    • ESPAÑAPerspectivas (Millones de USD, 2019-2030)

    • Embalaje para comercio electrónico minorista en España por material

      • Cajas de cartón ondulado

      • Embalaje protector

      • Sobres de seguridad

      • Cintas y etiquetas

      • Otros

    • Embalaje para comercio electrónico minorista en España por aplicación

      • Electrónica y bienes de consumo

      • Ropa y Accesorios

      • Muebles para el hogar

      • Autopartes

      • Alimentos y bebidas

      • Cuidado de la salud y cuidado personal

      • Otros

    • Perspectivas para el resto de Europa (millones de USD, 2019-2030)

    • Embalaje de comercio electrónico minorista para el resto de Europa por material

      • Cajas de cartón corrugado

      • Embalaje protector

      • Sobres de seguridad

      • Cintas y Etiquetas

      • Otros

    • RESTO DE EUROPA Comercio electrónico minorista Embalaje por aplicación

      • Electrónica y bienes de consumo

      • Ropa y accesorios

      • Muebles para el hogar

      • Autopartes

      • Alimentos y bebidas

      • Asistencia sanitaria y Cuidado personal

      • Otros

  • Perspectivas de Asia-Pacífico (millones de USD, 2019-2030)

    • Empaques para comercio electrónico minorista en Asia-Pacífico por material

      • Cajas de cartón corrugado

      • Empaques protectores

      • Sobres de seguridad

      • Cintas y etiquetas

      • Otros

    • Empaques para comercio electrónico minorista en Asia-Pacífico por aplicación

      • Electrónica y Bienes de consumo

      • Ropa y accesorios

      • Muebles para el hogar

      • Autopartes

      • Alimentos y bebidas

      • Cuidado de la salud y cuidado personal

      • Otros

    • Perspectivas de China (millones de USD, 2019-2030)

    • Embalaje para comercio electrónico minorista en China por material

      • Cajas de cartón corrugado

      • Embalaje protector

      • Sobres de seguridad

      • Cintas y Etiquetas

      • Otros

    • Empaques para comercio electrónico minorista en China por aplicación

      • Electrónica y bienes de consumo

      • Ropa y accesorios

      • Muebles para el hogar

      • Autopartes

      • Alimentos y bebidas

      • Atención médica y Cuidado personal

      • Otros

    • Perspectivas de Japón(Millones de USD, 2019-2030)

    • Embalaje para comercio electrónico minorista en Japón por material

      • Cajas de cartón corrugado

      • Embalaje protector

      • Sobres de seguridad

      • Cintas y etiquetas

      • Otros

    • Embalaje para comercio electrónico minorista en Japón por aplicación

      • Electrónica y Bienes de consumo

      • Ropa y accesorios

      • Muebles para el hogar

      • Autopartes

      • Alimentos y bebidas

      • Cuidado de la salud y cuidado personal

      • Otros

    • Perspectivas de la India (millones de USD, 2019-2030)

    • Embalaje para comercio electrónico minorista en India por material

      • Cajas de cartón corrugado

      • Embalaje protector

      • Sobres de seguridad

      • Cintas y Etiquetas

      • Otros

    • Empaques para comercio electrónico minorista en India por aplicación

      • Electrónica y bienes de consumo

      • Ropa y accesorios

      • Muebles para el hogar

      • Autopartes

      • Alimentos y bebidas

      • Atención médica y Cuidado personal

      • Otros

    • Perspectivas de Australia(Millones de USD, 2019-2030)

    • Embalaje para comercio electrónico minorista en Australia por material

      • Cajas de cartón corrugado

      • Embalaje protector

      • Sobres de seguridad

      • Cintas y etiquetas

      • Otros

    • Embalaje para comercio electrónico minorista en Australia por aplicación

      • Electrónica y Bienes de consumo

      • Ropa y accesorios

      • Muebles para el hogar

      • Autopartes

      • Alimentos y bebidas

      • Salud y Cuidado personal

      • Otros

    • Perspectivas para el resto de Asia-Pacífico (millones de USD, 2019-2030)

    • Embalaje para comercio electrónico minorista en el resto de Asia-Pacífico por material

      • Cajas de cartón corrugado

      • Embalaje protector

      • Sobres de seguridad

      • Cintas y Etiquetas

      • Otros

    • Resto de Asia-Pacífico: Embalaje para comercio electrónico minorista por aplicación

      • Electrónica y bienes de consumo

      • Ropa y accesorios

      • Muebles para el hogar

      • Autopartes

      • Alimentos y bebidas

      • Atención médica y Cuidado personal

      • Otros

  • Perspectivas para el resto del mundo (millones de USD, 2019-2030)

    • Embalaje de comercio electrónico minorista en el resto del mundo por material

      • Cajas de cartón corrugado

      • Embalaje protector

      • Sobres de seguridad

      • Cintas y Etiquetas

      • Otros

    • Empaques para comercio electrónico minorista en el resto del mundo por aplicación

      • Electrónica y bienes de consumo

      • Ropa y accesorios

      • Muebles para el hogar

      • Autopartes

      • Alimentos y bebidas

      • Atención médica y Cuidado personal

      • Otros

    • Perspectivas para Oriente Medio (millones de USD, 2019-2030)

    • Embalaje para comercio electrónico minorista en Oriente Medio por material

      • Cajas de cartón corrugado

      • Embalaje protector

      • Sobres de seguridad

      • Cintas y Etiquetas

      • Otros

    • Empaques para comercio electrónico minorista en Oriente Medio por aplicación

      • Electrónica y bienes de consumo

      • Ropa y accesorios

      • Muebles para el hogar

      • Autopartes

      • Alimentos y bebidas

      • Atención médica y Cuidado personal

      • Otros

    • Perspectivas de África(Millones de USD, 2019-2030)

    • Embalaje para comercio electrónico minorista en África por material

      • Cajas de cartón corrugado

      • Embalaje protector

      • Sobres de seguridad

      • Cintas y etiquetas

      • Otros

    • Embalaje para comercio electrónico minorista en África por aplicación

      • Electrónica y Bienes de consumo

      • Ropa y accesorios

      • Muebles para el hogar

      • Autopartes

      • Alimentos y bebidas

      • Atención médica y Cuidado personal

      • Otros

    • Perspectivas para América Latina (USD millones, 2019-2030)

    • Empaques para comercio electrónico minorista en América Latina por material

      • Cajas de cartón corrugado

      • Empaques protectores

      • Sobres de seguridad

      • Cintas y etiquetas

      • Otros

    • Empaques para comercio electrónico minorista en América Latina por aplicación

      • Electrónica y Bienes de consumo

      • Ropa y accesorios

      • Artículos para el hogar

      • Repuestos para automóviles

      • Alimentos y bebidas

      • Cuidado de la salud y personal

      • Otros

Compare Licence

×
Features License Type
Single User Multiuser License Enterprise User
Price $4,950 $5,950 $7,250
Maximum User Access Limit 1 User Upto 10 Users Unrestricted Access Throughout the Organization
Free Customization
Direct Access to Analyst
Deliverable Format
Platform Access
Discount on Next Purchase 10% 15% 15%
Printable Versions