Request Free Sample ×

Kindly complete the form below to receive a free sample of this Report

* Please use a valid business email

Leading companies partner with us for data-driven Insights

clients tt-cursor
Hero Background

Poly Aluminum Chloride Market

ID: MRFR/CnM/2621-CR
197 Pages
Chitranshi Jaiswal
Last Updated: May 15, 2026

Informe de investigación de mercado del cloruro de polialuminio: pronóstico hasta 2032

Compartir
Download PDF ×

We do not share your information with anyone. However, we may send you emails based on your report interest from time to time. You may contact us at any time to opt-out.

  1. 1 Prólogo del informe
  2. 2 Introducción
    1. 2.1 Definición 11
    2. 2.2 Alcance del estudio 11
    3. 2.3 Objetivo de la investigación 11
    4. 2.4 Supuestos y Limitaciones 11
      1. 2.4.1 Supuestos 11
      2. 2.4.2 Limitaciones 12
    5. 2.5 Estructura del mercado 12
  3. 3 Metodología de investigación
    1. 3.1 Proceso de investigación 13
    2. 3.2 Investigación primaria 14
    3. 3.3 Investigación secundaria 15
    4. 3.4 Modelo de pronóstico 16
  4. 4 Dinámica del mercado
    1. 4.1 Introducción 17
    2. 4.2 Impulsores 17
      1. 4.2.1 Uso creciente de cloruro de polialuminio en la industria de uso final de tratamiento de aguas residuales para aumentar la demanda del mercado. 18
      2. 4.2.2 El alumbre se sustituye por cloruro de polialuminio, que se perfila como un factor impulsor importante para el crecimiento del mercado en los próximos años. 19
      3. 4.2.3 Creciente papel y Se espera que la industria de la pulpa, junto con la creciente demanda de productos químicos para el encolado de papel, impulse el crecimiento del mercado del cloruro de polialuminio. 19
    3. 4.3 Restricciones 20
      1. 4.3.1 La infraestructura deficiente para el tratamiento de agua y efluentes en las economías en desarrollo puede limitar el crecimiento del mercado del cloruro de polialuminio. 20
    4. 4.4 Tendencias y Oportunidades 21
      1. 4.4.1 Se espera que las expansiones e inversiones en el desarrollo de PAC por parte de los principales actores clave brinden oportunidades lucrativas en toda la cadena de valor 21
  5. 5 Análisis de factores de mercado
    1. 5.1 Cinco fuerzas de Porter 22
      1. 5.1.1 Amenaza de nuevos participantes 22
      2. 5.1.2 Amenaza de rivalidad 22
      3. 5.1.3 Amenaza de sustituto 22
      4. 5.1.4 Poder de negociación del proveedor 23
      5. 5.1.5 Poder de negociación del comprador 23
    2. 5.2 Análisis de la cadena de suministro 23
      1. 5.2.1 Introducción 24
      2. 5.2.2 Materias primas 24
      3. 5.2.3 Fabricantes 25
      4. 5.2.4 Canal de distribuidores 25
      5. 5.2.5 Industria de uso final 25
  6. 6 Mercado global de cloruro de polialuminio (PAC), por forma
    1. 6.1 Forma líquida 28
    2. 6.2 Forma sólida 29
  7. 7 Mercado global de cloruro de polialuminio (PAC), por industria de uso final
    1. 7.1 Introducción 30
    2. 7.2 Tratamiento de agua 32
    3. 7.3 Industria papelera 34
    4. 7.4 Aditivos cosméticos 36
    5. 7.5 Petróleo y Gas 38
    6. 7.6 Otros 39
  8. 8 Mercado global de cloruro de polialuminio (PAC), por región
    1. 8.1 Introducción 41
    2. 8.2 América del Norte 45
      1. 8.2.1 EE. UU. 48
      2. 8.2.2 Canadá 50
    3. 8.3 Europa 52
      1. 8.3.1 Alemania 54
      2. 8.3.2 Reino Unido 56
      3. 8.3.3 Francia 58
      4. 8.3.4 España 60
      5. 8.3.5 Resto de Europa 62
    4. 8.4 Asia Pacífico 64
      1. 8.4.1 China 67
      2. 8.4.2 Japón 69
      3. 8.4.3 India 71
      4. 8.4.4 Resto de Asia Pacífico 73
    5. 8.5 Oriente Medio y África 75
    6. 8.6 América Latina 77
  9. 9 Panorama competitivo
    1. 9.1 Introducción 79
    2. 9.2 Estrategia clave 81
  10. 10 Perfil de la empresa
    1. 10.1 Kemira Oyj 82
      1. 10.1.1 Descripción general 82
      2. 10.1.2 Finanzas 82
      3. 10.1.3 Desarrollo de productos 83
      4. 10.1.4 Desarrollos clave 83
    2. 10.2 Productos químicos especiales GEO 85
      1. 10.2.1 Descripción general 85
      2. 10.2.2 Financiero 85
      3. 10.2.3 Desarrollo de productos 85
      4. 10.2.4 Desarrollos clave 85
    3. 10.3 Airedale Chemical Company Limited 86
      1. 10.3.1 Descripción general 86
      2. 10.3.2 Finanzas 86
      3. 10.3.3 Desarrollo de productos 86
      4. 10.3.4 Desarrollos clave 86
    4. 10.4 Feralco AB 87
      1. 10.4.1 Descripción general 87
      2. 10.4.2 Finanzas 87
      3. 10.4.3 Desarrollo de productos 87
      4. 10.4.4 Desarrollo clave 87
    5. 10.5 Gujarat Alkalies And Chemical Ltd. 89
      1. 10.5.1 Descripción general 89
      2. 10.5.2 Finanzas 89
      3. 10.5.3 Desarrollo de productos 90
      4. 10.5.4 Desarrollos clave 90
    6. 10.6 Grasim Industries Ltd 91
      1. 10.6.1 Financiero 91
      2. 10.6.2 Desarrollo de productos 92
      3. 10.6.3 Desarrollo clave 92
    7. 10.7 Synergy Multichem Pvt. Ltd. 93
      1. 10.7.1 Descripción general 93
      2. 10.7.2 Financiero 93
      3. 10.7.3 Desarrollo de productos 93
      4. 10.7.4 Desarrollos clave 93
    8. 10.8 USALCO. 93
      1. 10.8.1 Descripción general 93
      2. 10.8.2 Finanzas 93
      3. 10.8.3 Desarrollo de productos 93
      4. 10.8.4 Desarrollos clave 93
    9. 10.9 Gongyi Filter Industry Co., Ltd.. 93
      1. 10.9.1 Descripción general 93
      2. 10.9.2 Finanzas 93
      3. 10.9.3 Desarrollo de productos 93
      4. 10.9.4 Desarrollos clave 93
  11. 11 Conclusión
  12. 12 Lista de tablas
    1. TABLA 1 MERCADO MUNDIAL DE CLORURO DE POLIALUMINIO, POR FORMA, (2023 - 2032) (MIL MILLONES DE USD) 27
    2. TABLA 2 MERCADO MUNDIAL DE CLORURO DE POLIALUMINIO, POR FORMA, (2023 - 2032) (‘000 TONELADAS) 27
    3. TABLA 3 MERCADO MUNDIAL DE FORMA LÍQUIDA PARA EL MERCADO DE CLORURO DE POLIALUMINIO, POR REGIONES, (2023 - 2032) (MILES DE MILLONES DE USD) 28
    4. TABLA 4 MERCADO MUNDIAL DE FORMA LÍQUIDA PARA EL MERCADO DE CLORURO DE POLIALUMINIO, POR REGIONES, (2023 - 2032) (‘000 TONELADAS) 28
    5. TABLA 5 MERCADO MUNDIAL DE FORMA LÍQUIDA PARA EL MERCADO DE CLORURO DE POLIALUMINIO, POR REGIONES, (2023 - 2032) (MILES DE MILLONES DE USD) 29
    6. TABLA 6 MERCADO MUNDIAL DE FORMA LÍQUIDA PARA EL MERCADO DE CLORURO DE POLIALUMINIO, POR REGIONES, (2023 - 2032) (miles de toneladas) 29
    7. TABLA 7 MERCADO MUNDIAL DE CLORURO DE POLIALUMINIO, POR INDUSTRIA DE USO FINAL, (2023 - 2032) (MILES DE MILLONES DE USD) 31
    8. TABLA 8 MERCADO MUNDIAL DE CLORURO DE POLIALUMINIO, POR INDUSTRIA DE USO FINAL, (2023 - 2032) (MILES DE MILLONES DE USD) 31
    9. TABLA 9 MERCADO MUNDIAL DE TRATAMIENTO DE AGUA PARA EL MERCADO DE CLORURO DE POLIALUMINIO, POR REGIONES, (2023 - 2032) (MILES DE MILLONES DE USD) 32
    10. TABLA 10 MERCADO MUNDIAL DE TRATAMIENTO DE AGUA PARA EL MERCADO DE CLORURO DE POLIALUMINIO, POR REGIONES, (2023 - 2032) (‘000 TONELADAS) 33
    11. TABLA 11 MERCADO MUNDIAL DE CLORURO DE POLIALUMINIO EN LA INDUSTRIA PAPELERA, POR REGIONES, (2023 - 2032) (MILES DE MILLONES DE USD) 34
    12. TABLA 12 MERCADO MUNDIAL DE CLORURO DE POLIALUMINIO EN LA INDUSTRIA PAPELERA, POR REGIONES, (2023 - 2032) (‘000 TONELADAS) 35
    13. TABLA 13 MERCADO MUNDIAL DE ADITIVOS COSMÉTICOS PARA EL MERCADO DE CLORURO DE POLIALUMINIO, POR REGIONES, (2023 - 2032) (MILES DE MILLONES DE USD) 36
    14. TABLA 14 MERCADO MUNDIAL DE ADITIVOS COSMÉTICOS PARA EL MERCADO DE CLORURO DE POLIALUMINIO, POR REGIONES, (2023 - 2032) (‘000 TONELADAS) 37
    15. TABLA 15 MERCADO MUNDIAL DE PETRÓLEO Y GAS PARA EL MERCADO DE CLORURO DE POLIALUMINIO, POR REGIONES, (2023 - 2032) (MILES DE MILLONES DE USD) 38
    16. TABLA 16 MERCADO MUNDIAL DE PETRÓLEO Y GAS PARA EL MERCADO DE CLORURO DE POLIALUMINIO, POR REGIONES, (2023 - 2032) (MILES DE MILLONES DE USD) MERCADO DE GAS PARA EL MERCADO DE CLORURO DE POLIALUMINIO, POR REGIONES, (2023 - 2032) ('000 TONELADAS) 39
    17. TABLA 17 MERCADO MUNDIAL DE OTROS PARA EL MERCADO DE CLORURO DE POLIALUMINIO, POR REGIONES, (2023 - 2032) (MIL MILLONES DE USD) 39
    18. TABLA 18 MERCADO MUNDIAL DE OTROS PARA EL MERCADO DE CLORURO DE POLIALUMINIO, POR REGIONES, (2023 - 2032) ('000 TONELADAS) 40
    19. TABLA 19 MERCADO MUNDIAL DE CLORURO DE POLIALUMINIO, POR REGIÓN, (2023 - 2032) (MIL MILLONES DE USD) 42
    20. TABLA 20 MERCADO MUNDIAL DE CLORURO DE POLIALUMINIO, POR REGIÓN, (2023 - 2032) (miles de toneladas) 42
    21. TABLA 21 MERCADO MUNDIAL DE CLORURO DE POLIALUMINIO, POR FORMA, (2023 - 2032) (MILES DE MILLONES DE USD) 43
    22. TABLA 22 MERCADO MUNDIAL DE CLORURO DE POLIALUMINIO, POR FORMA, (2023 - 2032) (MILES DE MILLONES DE USD) 43
    23. TABLA 23 MERCADO MUNDIAL DE CLORURO DE POLIALUMINIO, POR INDUSTRIA DE USO FINAL, (2023 - 2032) (MILES DE MILLONES DE USD) 44
    24. TABLA 24 MERCADO MUNDIAL DE CLORURO DE POLIALUMINIO, POR INDUSTRIA DE USO FINAL, (2023 - 2032) (MILES DE MILLONES DE USD) 44
    25. TABLA 25 MERCADO DE CLORURO DE POLIALUMINIO EN AMÉRICA DEL NORTE, POR PAÍS, (2023 - 2032) (MILES DE USD) 45
    26. TABLA 26 MERCADO DE CLORURO DE POLIALUMINIO EN AMÉRICA DEL NORTE, POR PAÍS, (2023 - 2032) (MILES DE TONELADAS) 45
    27. TABLA 27 MERCADO DE CLORURO DE POLIALUMINIO EN AMÉRICA DEL NORTE, POR FORMA, (2023 - 2032) (MILES DE USD) 46
    28. TABLA 28 MERCADO DE CLORURO DE POLIALUMINIO EN AMÉRICA DEL NORTE, POR FORMA, (2023 - 2032) (MILES DE TONELADAS) 46
    29. TABLA 29 CLORURO DE POLIALUMINIO EN AMÉRICA DEL NORTE MERCADO, POR INDUSTRIA DE USO FINAL, (2023 - 2032) (MILES DE USD) 47
    30. TABLA 30 MERCADO DE CLORURO DE POLIALUMINIO DE AMÉRICA DEL NORTE, POR INDUSTRIA DE USO FINAL, (2023 - 2032) (MILES DE TONELADAS) 47
    31. TABLA 31 MERCADO DE CLORURO DE POLIALUMINIO DE EE. UU., POR FORMA, (2023 - 2032) (MILES DE USD) 48
    32. TABLA 32 MERCADO DE CLORURO DE POLIALUMINIO DE EE. UU., POR FORMA, (2023 - 2032) (MILES DE TONELADAS) 48
    33. TABLA 33 MERCADO DE CLORURO DE POLIALUMINIO DE EE. UU., POR INDUSTRIA DE USO FINAL, (2023 - 2032) (MILES DE MILLONES DE USD) 49
    34. TABLA 34 MERCADO DE CLORURO DE POLIALUMINIO DE EE. UU., POR INDUSTRIA DE USO FINAL, (2023 - 2032) (MILES DE TONELADAS) 49
    35. TABLA 35 MERCADO DE CLORURO DE POLIALUMINIO DE CANADÁ, POR FORMA, (2023 - 2032) (MILES DE MILLONES DE USD) 50
    36. TABLA 36 MERCADO DE CLORURO DE POLIALUMINIO DE CANADÁ, POR FORMA, (2023 - 2032) (MILES DE MILLONES DE USD) 50
    37. TABLA 37 MERCADO DE CLORURO DE POLIALUMINIO DE CANADÁ, POR INDUSTRIA DE USO FINAL, (2023 - 2032) (MILES DE MILLONES DE USD) 51
    38. TABLA 38 MERCADO DE CLORURO DE POLIALUMINIO DE CANADÁ MERCADO DE CLORURO DE ALUMINIO, POR INDUSTRIA DE USO FINAL, (2023 - 2032) (miles de toneladas) 51
    39. TABLA 39 MERCADO EUROPEO DE CLORURO DE POLIALUMINIO, POR PAÍS, (2023 - 2032) (MILES DE MILLONES DE USD) 52
    40. TABLA 40 MERCADO EUROPEO DE CLORURO DE POLIALUMINIO, POR PAÍS, (2023 - 2032) (miles de toneladas) 52
    41. TABLA 41 MERCADO EUROPEO DE CLORURO DE POLIALUMINIO, POR FORMA, (2023 - 2032) (MILES DE MILLONES DE USD) 53
    42. TABLA 42 MERCADO EUROPEO DE CLORURO DE POLIALUMINIO, POR FORMA, (2023 - 2032) (MILES DE MILLONES DE USD) 53
    43. TABLA 43 MERCADO EUROPEO DE CLORURO DE POLIALUMINIO, POR INDUSTRIA DE USO FINAL, (2023 - 2032) (MILES DE USD) 53
    44. TABLA 44 MERCADO EUROPEO DE CLORURO DE POLIALUMINIO, POR INDUSTRIA DE USO FINAL, (2023 - 2032) (miles de toneladas) 54
    45. TABLA 45 MERCADO ALEMANO DE CLORURO DE POLIALUMINIO, POR FORMA, (2023 - 2032) (MILES DE USD) 54
    46. TABLA 46 MERCADO ALEMANO DE CLORURO DE POLIALUMINIO, POR FORMA, (2023 - 2032) (MILES DE TONELADAS) 55
    47. TABLA 47 MERCADO ALEMANO DE CLORURO DE POLIALUMINIO, POR INDUSTRIA DE USO FINAL, (2023 - 2032) (MILES DE USD) 55
    48. TABLA 48 MERCADO DE CLORURO DE POLIALUMINIO DE ALEMANIA, POR INDUSTRIA DE USO FINAL, (2023 - 2032) (MILES DE TONELADAS) 56
    49. TABLA 49 MERCADO DE CLORURO DE POLIALUMINIO DEL REINO UNIDO, POR FORMA, (2023 - 2032) (MILES DE USD) 56
    50. TABLA 50 MERCADO DE CLORURO DE POLIALUMINIO DEL REINO UNIDO, POR FORMA, (2023 - 2032) (MILES DE USD) 57
    51. TABLA 51 MERCADO DE CLORURO DE POLIALUMINIO DEL REINO UNIDO, POR INDUSTRIA DE USO FINAL, (2023 - 2032) (MILES DE USD) 57
    52. TABLA 52 MERCADO DE CLORURO DE POLIALUMINIO EN EL REINO UNIDO, POR INDUSTRIA DE USO FINAL, (2023-2032) (MILES DE TONELADAS) 58
    53. TABLA 53 MERCADO DE CLORURO DE POLIALUMINIO EN FRANCIA, POR FORMA, (2023-2032) (MILES DE MILLONES DE USD) 58
    54. TABLA 54 MERCADO DE CLORURO DE POLIALUMINIO EN FRANCIA, POR FORMA, (2023-2032) (MILES DE TONELADAS) 59
    55. TABLA 55 MERCADO DE CLORURO DE POLIALUMINIO EN FRANCIA, POR INDUSTRIA DE USO FINAL, (2023-2032) (MILES DE MILLONES DE USD) 59
    56. TABLA 56 MERCADO DE CLORURO DE POLIALUMINIO EN FRANCIA, POR INDUSTRIA DE USO FINAL, (2023-2032) 2032) (miles de toneladas) 60
    57. TABLA 57 MERCADO DE CLORURO DE POLIALUMINIO EN ESPAÑA, POR FORMA, (2023-2032) (miles de millones de dólares) 60
    58. TABLA 58 MERCADO DE CLORURO DE POLIALUMINIO EN ESPAÑA, POR FORMA, (2023-2032) (miles de millones de dólares) 61
    59. TABLA 59 MERCADO DE CLORURO DE POLIALUMINIO EN ESPAÑA, POR INDUSTRIA DE USO FINAL, (2023-2032) (miles de millones de dólares) 61
    60. TABLA 60 MERCADO DE CLORURO DE POLIALUMINIO EN ESPAÑA, POR INDUSTRIA DE USO FINAL, (2023-2032) (miles de millones de toneladas) 62
    61. TABLA 61 RESTO DE EUROPA POLI MERCADO DE CLORURO DE ALUMINIO, POR FORMA, (2023 - 2032) (MILES DE USD) 62
    62. TABLA 62 RESTO DE EUROPA MERCADO DE CLORURO DE POLIALUMINIO, POR FORMA, (2023 - 2032) (MILES DE TONELADAS) 62
    63. TABLA 63 RESTO DE EUROPA MERCADO DE CLORURO DE POLIALUMINIO, POR INDUSTRIA DE USO FINAL, (2023 - 2032) (MILES DE USD) 63
    64. TABLA 64 RESTO DE EUROPA MERCADO DE CLORURO DE POLIALUMINIO, POR INDUSTRIA DE USO FINAL, (2023 - 2032) (MILES DE TONELADAS) 63
    65. TABLA 65 MERCADO DE CLORURO DE POLIALUMINIO DE ASIA PACÍFICO, POR PAÍS, (2023 - 2032) (MILES DE MILLONES DE USD) 64
    66. TABLA 66 MERCADO DE CLORURO DE POLIALUMINIO EN ASIA PACÍFICO, POR PAÍS, (2023 - 2032) (MILES DE TONELADAS) 64
    67. TABLA 67 MERCADO DE CLORURO DE POLIALUMINIO EN ASIA PACÍFICO, POR FORMA, (2023 - 2032) (MILES DE MILLONES DE USD) 65
    68. TABLA 68 MERCADO DE CLORURO DE POLIALUMINIO EN ASIA PACÍFICO, POR FORMA, (2023 - 2032) (MILES DE MILLONES DE USD) 65
    69. TABLA 69 MERCADO DE CLORURO DE POLIALUMINIO EN ASIA PACÍFICO, POR INDUSTRIA DE USO FINAL, (2023 - 2032) (MILES DE MILLONES DE USD) 66
    70. TABLA 70 ASIA MERCADO DE CLORURO DE POLIALUMINIO DEL PACÍFICO, POR INDUSTRIA DE USO FINAL, (2023 - 2032) (MILES DE TONELADAS) 66
    71. TABLA 71 MERCADO DE CLORURO DE POLIALUMINIO DE CHINA, POR FORMA, (2023 - 2032) (MILES DE MILLONES DE USD) 67
    72. TABLA 72 MERCADO DE CLORURO DE POLIALUMINIO DE CHINA, POR FORMA, (2023 - 2032) (MILES DE MILLONES DE USD) 67
    73. TABLA 73 MERCADO DE CLORURO DE POLIALUMINIO DE CHINA, POR INDUSTRIA DE USO FINAL, (2023 - 2032) (MILES DE MILLONES DE USD) 68
    74. TABLA 74 MERCADO DE CLORURO DE POLIALUMINIO DE CHINA, POR INDUSTRIA DE USO FINAL, (2023 - 2032) (‘000 TONELADAS) 68
    75. TABLA 75 MERCADO DE CLORURO DE POLIALUMINIO DE JAPÓN, POR FORMA, (2023 - 2032) (MILES DE MILLONES DE USD) 69
    76. TABLA 76 MERCADO DE CLORURO DE POLIALUMINIO EN JAPÓN, POR FORMA, (2023-2032) (MILES DE TONELADAS) 69
    77. TABLA 77 MERCADO DE CLORURO DE POLIALUMINIO EN JAPÓN, POR INDUSTRIA DE USO FINAL, (2023-2032) (MILES DE MILLONES DE USD) 70
    78. TABLA 78 MERCADO DE CLORURO DE POLIALUMINIO EN JAPÓN, POR INDUSTRIA DE USO FINAL, (2023-2032) (MILES DE MILLONES DE USD) 70
    79. TABLA 79 MERCADO DE CLORURO DE POLIALUMINIO EN INDIA, POR FORMA, (2023-2032) (MILES DE MILLONES DE USD) 71
    80. TABLA 80 MERCADO DE CLORURO DE POLIALUMINIO EN INDIA, POR FORMA, (2023 - 2032) (miles de toneladas) 71
    81. TABLA 81 MERCADO DE CLORURO DE POLIALUMINIO EN LA INDIA, POR INDUSTRIA DE USO FINAL, (2023-2032) (MILES DE MILLONES DE USD) 72
    82. TABLA 82 MERCADO DE CLORURO DE POLIALUMINIO EN LA INDIA, POR INDUSTRIA DE USO FINAL, (2023-2032) (miles de toneladas) 72
    83. TABLA 83 RESTO DEL MERCADO DE CLORURO DE POLIALUMINIO EN ASIA-PACÍFICO, POR FORMA, (2023-2032) (MILES DE MILLONES DE USD) 73
    84. TABLA 84 RESTO DEL MERCADO DE CLORURO DE POLIALUMINIO EN ASIA-PACÍFICO, POR FORMA, (2023-2032) (MILES DE MILLONES DE USD) 73
    85. TABLA 85 RESTO DEL MERCADO DE CLORURO DE POLIALUMINIO DEL PACÍFICO ASIÁTICO, POR INDUSTRIA DE USO FINAL, (2023 - 2032) (MILES DE MILLONES DE USD) 74
    86. TABLA 86 RESTO DEL MERCADO DE CLORURO DE POLIALUMINIO DEL PACÍFICO ASIÁTICO, POR INDUSTRIA DE USO FINAL, (2023 - 2032) ('000 TONELADAS) 74
    87. TABLA 87 MERCADO DE CLORURO DE POLIALUMINIO DE ORIENTE MEDIO Y ÁFRICA, POR FORMA, (2023 - 2032) (MILES DE MILLONES DE USD) 75
    88. TABLA 88 ORIENTE MEDIO Y MERCADO DE CLORURO DE POLIALUMINIO EN ÁFRICA, POR FORMA, (2023 - 2032) ('000 TONELADAS) 75
    89. TABLA 89 MERCADO DE CLORURO DE POLIALUMINIO EN ORIENTE MEDIO Y ÁFRICA, POR INDUSTRIA DE USO FINAL, (2023 - 2032) (MILES DE MILLONES DE USD) 76
    90. TABLA 90 MERCADO DE CLORURO DE POLIALUMINIO EN ORIENTE MEDIO Y ÁFRICA, POR INDUSTRIA DE USO FINAL, (2023 - 2032) (MILES DE MILLONES DE USD) ÁFRICA MERCADO DE CLORURO DE POLIALUMINIO, POR INDUSTRIA DE USO FINAL, (2023 - 2032) ('000 TONELADAS) 76
    91. TABLA 91 MERCADO DE CLORURO DE POLIALUMINIO EN AMÉRICA LATINA, POR FORMA, (2023 - 2032) (MIL MILLONES DE USD) 77
    92. TABLA 92 MERCADO DE CLORURO DE POLIALUMINIO EN AMÉRICA LATINA, POR FORMA, (2023 - 2032) ('000 TONELADAS) 77
    93. TABLA 93 MERCADO DE CLORURO DE POLIALUMINIO EN AMÉRICA LATINA, POR INDUSTRIA DE USO FINAL, (2023 - 2032) (MIL MILLONES DE USD) 78
    94. TABLA 94 MERCADO DE CLORURO DE POLIALUMINIO EN AMÉRICA LATINA, POR INDUSTRIA DE USO FINAL, (2023 - 2032) (‘000 TONELADAS) 78
  13. 13 Lista de Figuras
    1. FIGURA 1 PROCESO DE INVESTIGACIÓN DE MRFR 13
    2. FIGURA 2 ENFOQUE DE ANÁLISIS DE DATOS PRIMARIOS 14
    3. FIGURA 3 ENFOQUE DE ANÁLISIS DE DATOS SECUNDARIOS 15
    4. FIGURA 4 DROC 17
    5. FIGURA 5 AGUAS RESIDUALES NO TRATADAS GLOBALES, 2022 (%) 20
    6. FIGURA 6 CADENA DE SUMINISTRO 23
    7. FIGURA 7 CUOTA DE MERCADO GLOBAL DE CLORURO DE POLIALUMINIO, POR FORMA, 2022 (%) 26
    8. FIGURA 8 POLIALUMINIO GLOBAL CUOTA DE MERCADO DE CLORURO, POR INDUSTRIA DE USO FINAL, 2022 (%) 30
    9. FIGURA 9 CUOTA DE MERCADO GLOBAL DE CLORURO DE POLIALUMINIO, POR REGIÓN, (2022) (%) 41
    10. FIGURA 10 LA EXPANSIÓN FUE LA ESTRATEGIA CLAVE DE CRECIMIENTO ADOPTADA POR LAS EMPRESAS DE CLORURO DE POLIALUMINIO, 2011-2017 79
    11. FIGURA 11 EXPANSIÓN: LA PRINCIPAL ESTRATEGIA ADOPTADA POR KEMIRA, 2020 80
    12. FIGURA 12 KEMIRA: INGRESOS E INGRESOS OPERATIVOS (2023-2032) 82
    13. FIGURA 13 KEMIRA: CUOTA DE MERCADO POR SEGMENTO DE NEGOCIO INGRESOS (2022) 83
    14. FIGURA 14 GUJARAT ALKALIES AND CHEMICAL LTD: VENTAS (2022) (%) 89
    15. FIGURA 15 GUJARAT ALKALIES AND CHEMICAL LTD: INGRESOS (2023-2032) 90
    16. FIGURA 16 GRASIM INDUSTRIES LTD: INGRESOS Y EBITDA (2023-2032) 91

Segmentación del mercado del cloruro de polialuminio

Perspectivas de la forma del cloruro de polialuminio (miles de millones de USD, 2018-2032)
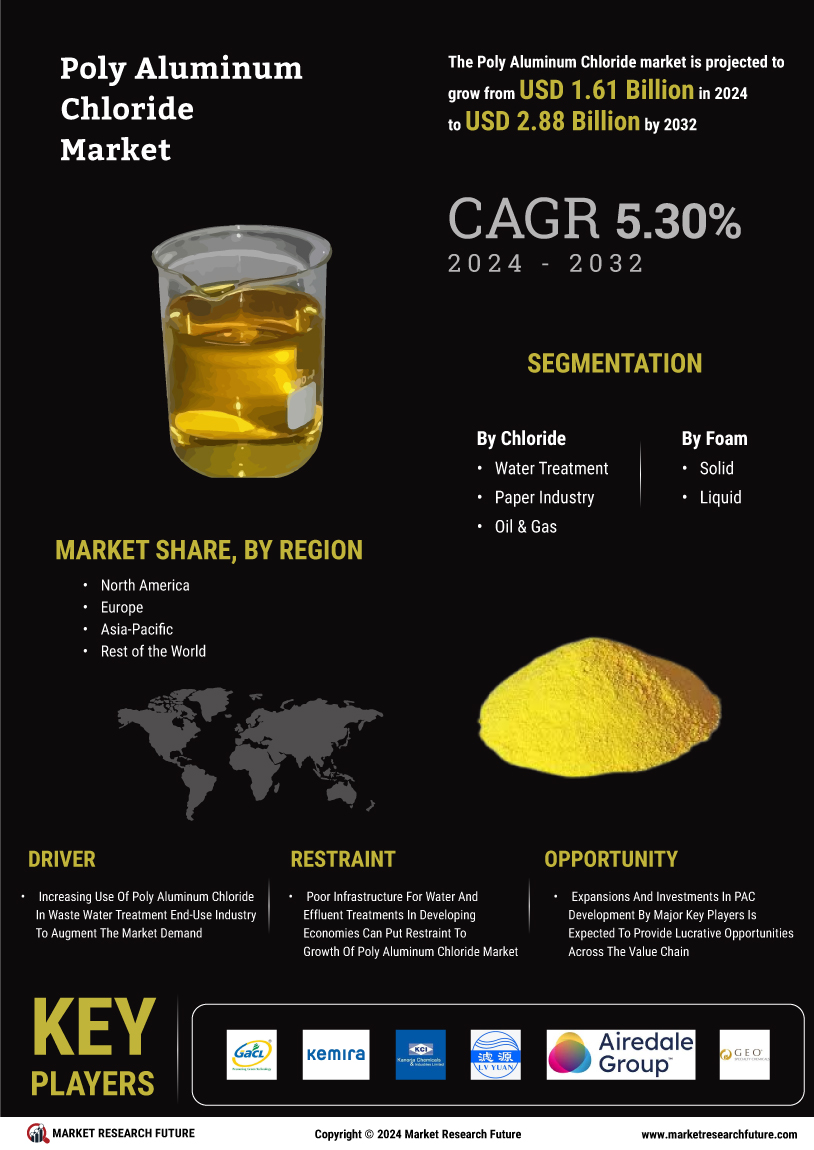
  • Sólido

  • Líquido

Perspectivas de la industria de uso final del cloruro de polialuminio (miles de millones de USD, 2018-2032)

  • Tratamiento de agua

  • Industria papelera

  • Cosméticos y cuidado personal

  • Aceite y Gas

Perspectiva Regional del Cloruro de Polialuminio (Miles de Millones de USD, 2018-2032)

  • Perspectiva para América del Norte (Miles de Millones de USD, 2018-2032)

    • Cloruro de Polialuminio en América del Norte por Forma

      • Sólido

      • Líquido

    • Cloruro de Polialuminio en América del Norte por Industria de Uso Final

      • Tratamiento de Agua

      • Industria Papelera

      • Cosméticos y Cuidado Personal

      • Petróleo y Gas

    • Perspectivas de EE. UU. (miles de millones de USD, 2018-2032)

    • Cloruro de polialuminio en EE. UU. por forma

      • Sólido

      • Líquido

    • Cloruro de polialuminio en EE. UU. por industria de uso final

      • Tratamiento de agua

      • Industria papelera

      • Cosméticos y cuidado personal

      • Petróleo y Gas

    • CANADÁPerspectivas (miles de millones de USD, 2018-2032)

    • CANADÁ Cloruro de polialuminio por forma

      • Sólido

      • Líquido

    • CANADÁ Cloruro de polialuminio por industria de uso final

      • Tratamiento de agua

      • Industria papelera

      • Cosméticos y cuidado personal

      • Petróleo y Gas

  • Perspectivas de Europa (miles de millones de USD, 2018-2032)

    • Cloruro de polialuminio en Europa por forma

      • Sólido

      • Líquido

    • Cloruro de polialuminio en Europa por industria de uso final

      • Tratamiento de agua

      • Industria papelera

      • Cosméticos y cuidado personal

      • Petróleo y Gas

    • Perspectivas de Alemania(Miles de millones de USD, 2018-2032)

    • Cloruro de polialuminio en Alemania por forma

      • Sólido

      • Líquido

      • Suplementos

    • Cloruro de polialuminio en Alemania por industria de uso final

      • Tratamiento de agua

      • Industria papelera

      • Cosméticos y cuidado personal

      • Petróleo y Gas

    • Perspectivas para Francia (miles de millones de USD, 2018-2032)

    • Cloruro de polialuminio en Francia por forma

      • Sólido

      • Líquido

    • Cloruro de polialuminio en Francia por industria de uso final

      • Tratamiento de aguas

      • Industria papelera

    • Perspectivas para el Reino Unido(miles de millones de USD, 2018-2032)

    • Cloruro de polialuminio en el Reino Unido por forma

      • Sólido

      • Líquido

    • Policloruro de aluminio en el Reino Unido por industria de uso final

      • Tratamiento de aguas

      • Industria papelera

      • Cosméticos y cuidado personal

      • Aceite y Gas

    • ITALIAPerspectivas (miles de millones de USD, 2018-2032)

    • ITALIA Cloruro de polialuminio por forma

      • Sólido

      • Líquido

    • ITALIA Cloruro de polialuminio por industria de uso final

      • Tratamiento de agua

      • Industria papelera

      • Cosméticos y cuidado personal

      • Petróleo y Gas

    • ESPAÑAPerspectivas (miles de millones de USD, 2018-2032)

    • Cloruro de polialuminio en España por forma

      • Sólido

      • Líquido

    • Cloruro de polialuminio en España por industria de uso final

      • Tratamiento de aguas

      • Industria papelera

      • Cosméticos y cuidado personal

      • Petróleo y Gas

    • Perspectivas para el resto de Europa(miles de millones de USD, 2018-2032)

    • Cloruro de polialuminio en el resto de Europa por forma

      • Sólido

      • Líquido

    • Cloruro de polialuminio en el resto de Europa por industria de uso final

      • Tratamiento de aguas

      • Industria papelera

      • Cosméticos y cuidado personal

      • Petróleo y Gas

  • Perspectivas de Asia-Pacífico (miles de millones de USD, 2018-2032)

    • Cloruro de polialuminio en Asia-Pacífico por forma

      • Sólido

      • Líquido

    • Cloruro de polialuminio en Asia-Pacífico por industria de uso final

      • Tratamiento de agua

      • Industria papelera

      • Cosméticos y cuidado personal

      • Petróleo y Gas

    • Perspectivas de China (miles de millones de USD, 2018-2032)

    • Cloruro de polialuminio en China por forma

      • Sólido

      • Líquido

    • Cloruro de polialuminio en China por industria de uso final

      • Tratamiento de agua

      • Industria papelera

      • Cosméticos y cuidado personal

      • Petróleo y Gas

    • Perspectivas de Japón(Miles de millones de USD, 2018-2032)

    • Cloruro de polialuminio en Japón por forma

      • Sólido

      • Líquido

    • Cloruro de polialuminio en Japón por industria de uso final

      • Tratamiento de agua

      • Industria papelera

      • Cosméticos y cuidado personal

      • Petróleo y Gas

    • Perspectivas de India(Miles de millones de USD, 2018-2032)

    • Cloruro de polialuminio en India por forma

      • Sólido

      • Líquido

    • Cloruro de polialuminio en India por industria de uso final

      • Tratamiento de agua

      • Industria papelera

      • Cosméticos y cuidado personal

      • Petróleo y Gas

    • Perspectivas de Australia(Miles de millones de USD, 2018-2032)

    • Cloruro de polialuminio en Australia por forma

      • Sólido

      • Líquido

    • Cloruro de polialuminio en Australia por industria de uso final

      • Tratamiento de agua

      • Industria papelera

      • Cosméticos y cuidado personal

      • Petróleo y Gas

    • Perspectivas para el resto de Asia-Pacífico (miles de millones de USD, 2018-2032)

    • Cloruro de polialuminio en el resto de Asia-Pacífico por forma

      • Sólido

      • Líquido

    • Cloruro de polialuminio en el resto de Asia-Pacífico por industria de uso final

      • Tratamiento de agua

      • Industria papelera

      • Cosméticos y cuidado personal

      • Petróleo y Gas

  • Perspectivas para el resto del mundo (miles de millones de USD, 2018-2032)

    • Cloruro de polialuminio en el resto del mundo por forma

      • Sólido

      • Líquido

    • Cloruro de polialuminio en el resto del mundo por industria de uso final

      • Tratamiento de agua

      • Industria papelera

      • Cosméticos y cuidado personal

      • Petróleo y Gas

    • Perspectivas para Oriente Medio (miles de millones de USD, 2018-2032)

    • Cloruro de polialuminio en Oriente Medio por forma

      • Sólido

      • Líquido

    • Cloruro de polialuminio en Oriente Medio por industria de uso final

      • Tratamiento de agua

      • Industria papelera

      • Cosméticos y cuidado personal

      • Petróleo y Gas

    • Perspectivas de África(Miles de millones de USD, 2018-2032)

    • Cloruro de polialuminio en África por forma

      • Sólido

      • Líquido

    • Cloruro de polialuminio en África por industria de uso final

      • Tratamiento de agua

      • Industria papelera

      • Cosméticos y cuidado personal

      • Petróleo y Gas

    • Perspectivas para América Latina(Miles de millones de USD, 2018-2032)

    • Cloruro de polialuminio en América Latina por forma

      • Sólido

      • Líquido

    • Cloruro de polialuminio en América Latina por industria de uso final

      • Tratamiento de agua

      • Industria papelera

      • Cosméticos y cuidado personal

      • Petróleo y gas

Compare Licence

×
Features License Type
Single User Multiuser License Enterprise User
Price $4,950 $5,950 $7,250
Maximum User Access Limit 1 User Upto 10 Users Unrestricted Access Throughout the Organization
Free Customization
Direct Access to Analyst
Deliverable Format
Platform Access
Discount on Next Purchase 10% 15% 15%
Printable Versions