

- 1 Prólogo del informe
-
2 Introducción al mercado
-
2.1 Definición 11
- 2.1.1 Alcance del estudio 11
- 2.1.2 Objetivos de la investigación 11
- 2.1.3 Supuestos 11
- 2.1.4 Limitaciones 12
- 2.2 Estructura del mercado 12
-
2.1 Definición 11
-
3 Metodología de la investigación
- 3.1 Proceso de investigación 13
- 3.2 Investigación primaria 14
- 3.3 Investigación secundaria 14
- 3.4 Estimación del tamaño del mercado 15
- 3.5 Modelo de pronóstico 16
-
4 Dinámica del mercado
-
4.1 Factores impulsores 17
- 4.1.1 Se prevé que la creciente demanda de microrreactores impresos en 3D, debido a su relativa asequibilidad y alta capacidad de diseño, impulse la demanda del mercado durante el período de pronóstico 17
- 4.1.2 Crecimiento de la nanotecnología El mercado farmacéutico impulsa la aplicación de la tecnología de microrreactores (MRT) en la industria farmacéutica 17
- 4.1.3 El aumento de las regulaciones y las crecientes preocupaciones sobre seguridad en la industria química afectan el mercado de la tecnología de microrreactores de forma constructiva 18
-
4.2 Restricciones 18
- 4.2.1 El alto coste y el largo plazo de comercialización de la MRT obstaculizan el crecimiento del mercado 18
- 4.2.2 La limitada capacidad de fabricación de la MRT frena el crecimiento del mercado en la industria de productos químicos básicos de uso final
-
4.3 Tendencias del mercado 19
- 4.3.1 Materiales innovadores utilizados en microrreactores 19
-
4.4 Oportunidades 19
- 4.4.1 La industria de productos químicos básicos ofrece una oportunidad lucrativa para el mercado de la tecnología de microrreactores 19
-
4.1 Factores impulsores 17
-
5 Análisis de factores de mercado
-
5.1 Análisis de la cadena de suministro 20
- 5.1.1 Proveedores de materias primas 20
- 5.1.2 Productores de tecnología de microrreactores 21
- 5.1.3 Distribuidores de tecnología de microrreactores 21
- 5.1.4 Usuarios finales de tecnología de microrreactores 21
-
5.2 Análisis de las cinco fuerzas de Porter 22
- 5.2.1 Amenaza de nuevos participantes 22
- 5.2.2 Poder de negociación del proveedor 23
- 5.2.3 Amenaza de sustitutos 23
- 5.2.4 Poder de negociación de los compradores 23
- 5.2.5 Rivalidad 24
-
5.1 Análisis de la cadena de suministro 20
-
6 Mercado global de tecnología de microrreactores, por tipo
- 6.1 Introducción 25
- 6.2 Desechable 26
- 6.3 Reutilizable 27
-
7 Mercado global de tecnología de microrreactores, por aplicación
- 7.1 Introducción 28
- 7.2 Síntesis química 29
- 7.3 Síntesis de polímeros 30
- 7.4 Análisis de procesos 31
- 7.5 Análisis de materiales 32
- 7.6 Otros 33
-
8 Mercado global de tecnología de microrreactores, por uso final
- 8.1 Introducción 34
- 8.2 Productos químicos especializados 35
- 8.3 Productos farmacéuticos 36
- 8.4 Productos químicos básicos 37
- 8.5 Otros 39
-
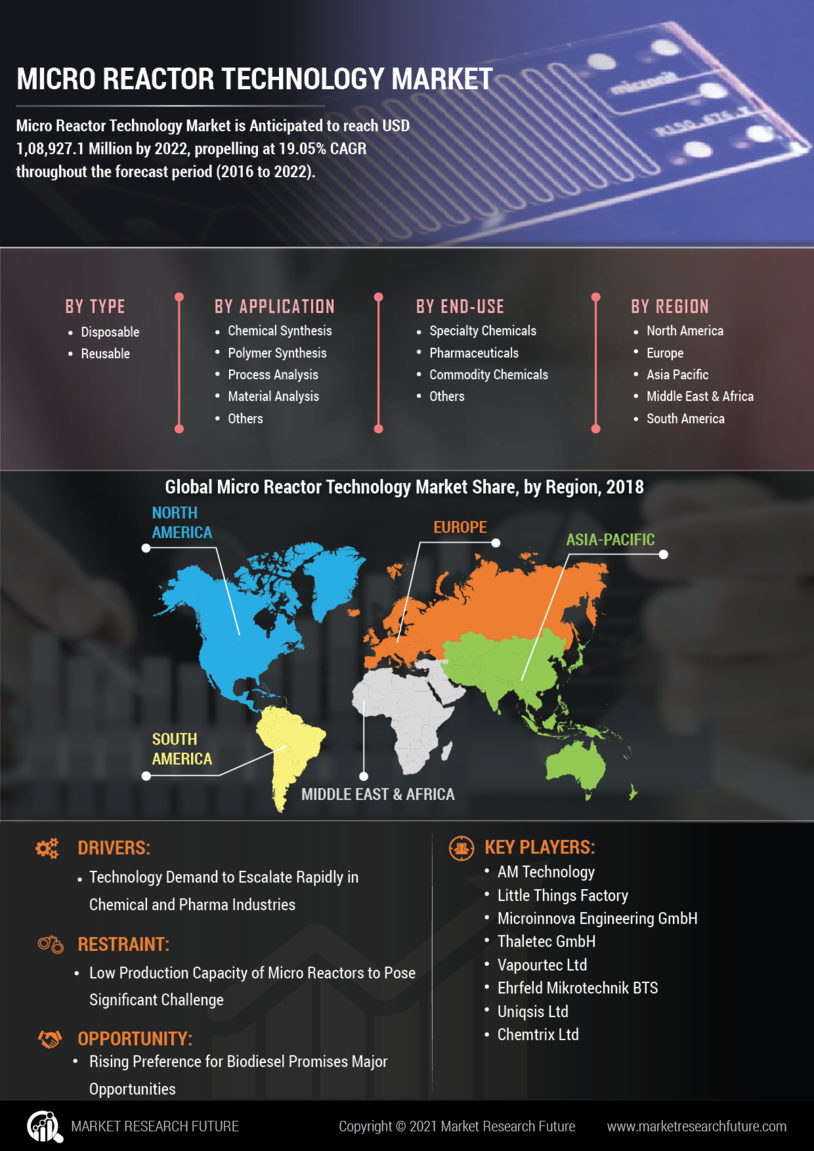
9 Mercado global de tecnología de microrreactores, por región
- 9.1 Introducción 40
-
9.2 América del Norte 41
- 9.2.1 EE. UU. 42
- 9.2.2 Canadá 44
-
9.3 Europa 46
- 9.3.1 Alemania 48
- 9.3.2 Reino Unido 49
- 9.3.3 Francia 51
- 9.3.4 Italia 52
- 9.3.5 Resto de Europa 54
-
9.4 Asia-Pacífico 56
- 9.4.1 China 58
- 9.4.2 Japón 59
- 9.4.3 India 61
- 9.4.4 Resto de Asia-Pacífico 62
- 9.5 América Latina 64
- 9.6 Oriente Medio y África 65
-
10 Panorama competitivo
- 10.1 Introducción: Actores clave 67
- 10.2 Colaboración 68
- 10.3 Expansión 69
- 10.4 Lanzamiento de producto 70
- 10.5 Principales consumidores, por usuario final 71
-
11 Actores clave
-
11.1 Tecnología AM 73
- 11.1.1 Descripción general de la empresa 73
- 11.1.2 Descripción general del segmento de producto/negocio 74
- 11.1.3 Actualizaciones financieras 74
-
11.2 Little Things Factory 75
- 11.2.1 Descripción general de la empresa 75
- 11.2.2 Descripción general del segmento de producto/negocio 76
- 11.2.3 Actualizaciones financieras 76
- 11.2.4 Desarrollos clave 76
-
11.3 Microinnova Engineering GmbH 77
- 11.3.1 Descripción general de la empresa 77
- 11.3.2 Descripción general del segmento de producto/negocio 77
- 11.3.3 Actualizaciones financieras 77
-
11.4 Thaletec GmbH 78
- 11.4.1 Descripción general de la empresa 78
- 11.4.2 Descripción general del segmento de producto/negocio 78
-
11.5 Vapourtec Ltd 79
- 11.5.1 Descripción general de la empresa 79
- 11.5.2 Descripción general del segmento de producto/negocio 79
- 11.5.3 Actualizaciones financieras 80
- 11.5.4 Desarrollos clave 80
-
11.6 Ehrfeld Mikrotechnik BTS 81
- 11.6.1 Descripción general de la empresa 81
- 11.6.2 Descripción general del segmento de producto/negocio 81
- 11.6.3 Actualizaciones financieras 82
- 11.6.4 Desarrollos clave Desarrollos 82
-
11.7 Uniqsis Ltd 83
- 11.7.1 Perfil de la empresa 83
- 11.7.2 Descripción general del segmento de producto/negocio 83
- 11.7.3 Actualizaciones financieras 84
- 11.7.4 Desarrollos clave 84
-
11.8 Chemtrix Ltd 85
- 11.8.1 Descripción general de la empresa 85
- 11.8.2 Descripción general del segmento de producto/negocio 85
- 11.8.3 Actualizaciones financieras 85
- 11.8.4 Desarrollos clave 86
-
11.1 Tecnología AM 73
- 12 Conclusión
-
13 Lista de tablas
- TABLA 1 MERCADO MUNDIAL DE TECNOLOGÍA DE MICRORRECUTORES, POR TIPO, 2020-2027 (MILLONES DE USD) 25
- TABLA 2 MERCADO MUNDIAL DE PRODUCTOS DESECHABLES PARA MICRORRECUTORES TECNOLOGÍA, POR REGIÓN, 2020-2027 (MILLONES DE USD) 26
- TABLA 3 MERCADO MUNDIAL DE MATERIALES REUTILIZABLES PARA TECNOLOGÍA DE MICRORRACTORES, POR REGIÓN, 2020-2027 (MILLONES DE USD) 27
- TABLA 4 MERCADO MUNDIAL DE TECNOLOGÍA DE MICRORRACTORES, POR APLICACIÓN, 2020-2027 (MILLONES DE USD) 28
- TABLA 5 MERCADO MUNDIAL DE SÍNTESIS QUÍMICA PARA TECNOLOGÍA DE MICRORRACTORES, POR APLICACIÓN, 2020-2027 (MILLONES DE USD) 29
- TABLA 6 MERCADO MUNDIAL DE SÍNTESIS DE POLÍMEROS PARA TECNOLOGÍA DE MICRORRACTORES, POR APLICACIÓN, 2020-2027 (MILLONES DE USD) 30
- TABLA 7 MERCADO GLOBAL DE ANÁLISIS DE PROCESOS PARA TECNOLOGÍA DE MICRORRECUTORES, POR APLICACIÓN, 2020-2027 (MILLONES DE USD) 31
- TABLA 8 MERCADO GLOBAL DE ANÁLISIS DE MATERIALES PARA TECNOLOGÍA DE MICRORRECUTORES, POR APLICACIÓN, 2020-2027 (MILLONES DE USD) 32
- TABLA 9 MERCADO GLOBAL DE OTROS PARA TECNOLOGÍA DE MICRORRECUTORES, POR APLICACIÓN, 2020-2027 (MILLONES DE USD) 33
- TABLA 10 MERCADO GLOBAL DE TECNOLOGÍA DE MICRORRECUTORES, POR USO FINAL, 2020-2027 (MILLONES DE USD) 35
- TABLA 11 MERCADO GLOBAL DE PRODUCTOS QUÍMICOS ESPECIALES PARA TECNOLOGÍA DE MICRORRECUTORES, POR USO FINAL, 2020-2027 (USD MILLONES) 36
- TABLA 12 MERCADO MUNDIAL DE PRODUCTOS FARMACÉUTICOS PARA TECNOLOGÍA DE MICRORRECUTORES, POR USO FINAL, 2020-2027 (USD MILLONES) 37
- TABLA 13 MERCADO MUNDIAL DE PRODUCTOS QUÍMICOS BÁSICOS PARA TECNOLOGÍA DE MICRORRECUTORES, POR USO FINAL, 2020-2027 (USD MILLONES) 38
- TABLA 14 MERCADO MUNDIAL DE OTROS PRODUCTOS PARA TECNOLOGÍA DE MICRORRECUTORES, POR USO FINAL, 2020-2027 (USD MILLONES) 39
- TABLA 15 MERCADO MUNDIAL DE TECNOLOGÍA DE MICRORRECUTORES, POR REGIÓN, 2020-2027 (USD MILLONES) 40
- TABLA 16 NORTE MERCADO DE TECNOLOGÍA DE MICRORRECUTORES EN AMÉRICA, POR PAÍS, 2020-2027 (MILLONES DE USD) 41
- TABLA 17 MERCADO DE TECNOLOGÍA DE MICRORRECUTORES EN AMÉRICA DEL NORTE, POR TIPO, 2020-2027 (MILLONES DE USD) 41
- TABLA 18 MERCADO DE TECNOLOGÍA DE MICRORRECUTORES EN AMÉRICA DEL NORTE, POR APLICACIÓN, 2020-2027 (MILLONES DE USD) 42
- TABLA 19 MERCADO DE TECNOLOGÍA DE MICRORRECUTORES EN AMÉRICA DEL NORTE, POR USO FINAL, 2020-2027 (MILLONES DE USD) 42
- TABLA 20 MERCADO DE TECNOLOGÍA DE MICRORRECUTORES EN EE. UU., POR TIPO, 2020-2027 (MILLONES DE USD) 43
- TABLA 21 EE. UU. MERCADO DE TECNOLOGÍA DE MICRORRECUTORES, POR APLICACIÓN, 2020-2027 (MILLONES DE USD) 43
- TABLA 22 MERCADO DE TECNOLOGÍA DE MICRORRECUTORES DE EE. UU., POR USO FINAL, 2020-2027 (MILLONES DE USD) 44
- TABLA 23 MERCADO DE TECNOLOGÍA DE MICRORRECUTORES DE CANADÁ, POR TIPO, 2020-2027 (MILLONES DE USD) 44
- TABLA 24 MERCADO DE TECNOLOGÍA DE MICRORRECUTORES DE CANADÁ, POR APLICACIÓN, 2020-2027 (MILLONES DE USD) 45
- TABLA 25 MERCADO DE TECNOLOGÍA DE MICRORRECUTORES DE CANADÁ, POR USO FINAL, 2020-2027 (MILLONES DE USD) 45
- TABLA 26 TECNOLOGÍA DE MICRORRECUTORES DE EUROPA MERCADO, POR PAÍS, 2020-2027 (MILLONES DE USD) 46
- TABLA 27 MERCADO EUROPEO DE TECNOLOGÍA DE MICRORRECUTORES, POR TIPO, 2020-2027 (MILLONES DE USD) 46
- TABLA 28 MERCADO EUROPEO DE TECNOLOGÍA DE MICRORRECUTORES, POR APLICACIÓN, 2020-2027 (MILLONES DE USD) 47
- TABLA 29 MERCADO EUROPEO DE TECNOLOGÍA DE MICRORRECUTORES, POR USO FINAL, 2020-2027 (MILLONES DE USD) 47
- TABLA 30 MERCADO ALEMANO DE TECNOLOGÍA DE MICRORRECUTORES, POR TIPO, 2020-2027 (MILLONES DE USD) 48
- TABLA 31 MERCADO ALEMANO DE TECNOLOGÍA DE MICRORRECUTORES, POR APLICACIÓN, 2020-2027 (USD MILLONES) 48
- TABLA 32 MERCADO DE TECNOLOGÍA DE MICRORRECUTORES DE ALEMANIA, POR USO FINAL, 2020-2027 (USD MILLONES) 49
- TABLA 33 MERCADO DE TECNOLOGÍA DE MICRORRECUTORES DEL REINO UNIDO, POR TIPO, 2020-2027 (USD MILLONES) 49
- TABLA 34 MERCADO DE TECNOLOGÍA DE MICRORRECUTORES DEL REINO UNIDO, POR APLICACIÓN, 2020-2027 (USD MILLONES) 50
- TABLA 35 MERCADO DE TECNOLOGÍA DE MICRORRECUTORES DEL REINO UNIDO, POR USO FINAL, 2020-2027 (USD MILLONES) 50
- TABLA 36 MERCADO DE TECNOLOGÍA DE MICRORRECUTORES DE FRANCIA, POR TIPO, 2020-2027 (USD MILLONES) 51
- TABLA 37 MERCADO DE TECNOLOGÍA DE MICRORRECUTORES EN FRANCIA, POR APLICACIÓN, 2020-2027 (MILLONES DE USD) 51
- TABLA 38 MERCADO DE TECNOLOGÍA DE MICRORRECUTORES EN FRANCIA, POR USO FINAL, 2020-2027 (MILLONES DE USD) 52
- TABLA 39 MERCADO DE TECNOLOGÍA DE MICRORRECUTORES EN ITALIA, POR TIPO, 2020-2027 (MILLONES DE USD) 52
- TABLA 40 MERCADO DE TECNOLOGÍA DE MICRORRECUTORES EN ITALIA, POR APLICACIÓN, 2020-2027 (MILLONES DE USD) 53
- TABLA 41 MERCADO DE TECNOLOGÍA DE MICRORRECUTORES EN ITALIA, POR USO FINAL, 2020-2027 (MILLONES DE USD) 53
- TABLA 42 RESTO DE EUROPA MERCADO DE TECNOLOGÍA DE MICRORRECUTORES, POR TIPO 2020-2027 (MILLONES DE USD) 54
- TABLA 43 RESTO DE EUROPA MERCADO DE TECNOLOGÍA DE MICRORRECUTORES, POR APLICACIÓN, 2020-2027 (MILLONES DE USD) 54
- TABLA 44 RESTO DE EUROPA MERCADO DE TECNOLOGÍA DE MICRORRECUTORES, POR USO FINAL, 2020-2027 (MILLONES DE USD) 55
- TABLA 45 MERCADO DE TECNOLOGÍA DE MICRORRECUTORES DE ASIA-PACÍFICO, POR PAÍS, 2020-2027 (MILLONES DE USD) 56
- TABLA 46 MERCADO DE TECNOLOGÍA DE MICRORRECUTORES DE ASIA-PACÍFICO, POR TIPO 2020-2027 (MILLONES DE USD) MILLONES) 56
- TABLA 47 MERCADO DE TECNOLOGÍA DE MICRORRACTORES DE ASIA-PACÍFICO, POR APLICACIÓN, 2020-2027 (MILLONES DE USD) 57
- TABLA 48 MERCADO DE TECNOLOGÍA DE MICRORRACTORES DE ASIA-PACÍFICO, POR USO FINAL, 2020-2027 (MILLONES DE USD) 57
- TABLA 49 MERCADO DE TECNOLOGÍA DE MICRORRACTORES DE CHINA, POR TIPO, 2020-2027 (MILLONES DE USD) 58
- TABLA 50 MERCADO DE TECNOLOGÍA DE MICRORRACTORES DE CHINA, POR APLICACIÓN, 2020-2027 (MILLONES DE USD) 58
- TABLA 51 MERCADO DE TECNOLOGÍA DE MICRORRACTORES DE CHINA, POR USO FINAL, 2020-2027 (MILLONES DE USD) 59
- TABLA 52 MERCADO DE TECNOLOGÍA DE MICRORRECUTORES DE JAPÓN, POR TIPO, 2020-2027 (MILLONES DE USD) 59
- TABLA 53 MERCADO DE TECNOLOGÍA DE MICRORRECUTORES DE JAPÓN, POR APLICACIÓN, 2020-2027 (MILLONES DE USD) 60
- TABLA 54 MERCADO DE TECNOLOGÍA DE MICRORRECUTORES DE JAPÓN, POR USO FINAL, 2020-2027 (MILLONES DE USD) 60
- TABLA 55 MERCADO DE TECNOLOGÍA DE MICRORRECUTORES DE INDIA, POR TIPO, 2020-2027 (MILLONES DE USD) 61
- TABLA 56 MERCADO DE TECNOLOGÍA DE MICRORRECUTORES DE INDIA, POR APLICACIÓN, 2020-2027 (MILLONES DE USD) 61
- TABLA 57 INDIA MERCADO DE TECNOLOGÍA DE MICRORRECUTORES, POR USO FINAL, 2020-2027 (MILLONES DE USD) 62
- TABLA 58 RESTO DEL MERCADO DE TECNOLOGÍA DE MICRORRECUTORES DE ASIA-PACÍFICO, POR TIPO, 2020-2027 (MILLONES DE USD) 62
- TABLA 59 RESTO DEL MERCADO DE TECNOLOGÍA DE MICRORRECUTORES DE ASIA-PACÍFICO, POR APLICACIÓN, 2020-2027 (MILLONES DE USD) 63
- TABLA 60 RESTO DEL MERCADO DE TECNOLOGÍA DE MICRORRECUTORES DE ASIA-PACÍFICO, POR USO FINAL, 2020-2027 (MILLONES DE USD) 63
- TABLA 61 MERCADO DE TECNOLOGÍA DE MICRORRECUTORES DE AMÉRICA LATINA, POR TIPO, 2020-2027 (MILLONES DE USD) 64
- TABLA 62 MERCADO DE TECNOLOGÍA DE MICRORRECUTORES DE AMÉRICA LATINA, POR APLICACIÓN, 2020-2027 (MILLONES DE USD) 64
- TABLA 63 MERCADO DE TECNOLOGÍA DE MICRORRECUTORES DE AMÉRICA LATINA, POR USO FINAL, 2020-2027 (MILLONES DE USD) 65
- TABLA 64 MERCADO DE TECNOLOGÍA DE MICRORRECUTORES DE ORIENTE MEDIO Y ÁFRICA, POR TIPO, 2020-2027 (MILLONES DE USD) 65
- TABLA 65 MERCADO DE TECNOLOGÍA DE MICRORRECUTORES DE ORIENTE MEDIO Y ÁFRICA, POR APLICACIÓN, 2020-2027 (MILLONES DE USD) 66
- TABLA 66 MERCADO DE TECNOLOGÍA DE MICRORRECUTORES DE ORIENTE MEDIO Y ÁFRICA, POR APLICACIÓN, 2020-2027 (MILLONES DE USD) MERCADO DE TECNOLOGÍA DE MICRORRECUTORES EN ÁFRICA, POR USO FINAL, 2020-2027 (MILLONES DE USD) 66
- TABLA 67 COLABORACIÓN: 2012, 2017 68
- TABLA 68 EXPANSIÓN: 2012, 2017 69
- TABLA 69 LANZAMIENTO DE PRODUCTO, 2020 70
- TABLA 70 LISTA DE CONSUMIDORES PRINCIPALES - PRODUCTOS FARMACÉUTICOS 71
- TABLA 71 LISTA DE CONSUMIDORES PRINCIPALES - PRODUCTOS QUÍMICOS ESPECIALES 72
-
14 Lista de figuras
- FIGURA 1 PERSPECTIVA DEL MERCADO GLOBAL DE TECNOLOGÍA DE MICRORRECUTORES (2020-2027) 10
- FIGURA 2 PROCESO DE INVESTIGACIÓN DE MRFR 13
- FIGURA 3 DE ARRIBA A ABAJO Y ENFOQUE DESCENTRAL 15
- FIGURA 4 ANÁLISIS DE LA CADENA DE SUMINISTRO DEL MERCADO GLOBAL DE TECNOLOGÍA DE MICRORRECUTORES 20
- FIGURA 5 ANÁLISIS DE LAS 5 FUERZAS DE PORTER DEL MERCADO GLOBAL DE TECNOLOGÍA DE MICRORRECUTORES 22
- FIGURA 6 MERCADO GLOBAL DE TECNOLOGÍA DE MICRORRECUTORES, POR TIPO, 2020-2027 (MILLONES DE USD) 25
- FIGURA 7 MERCADO GLOBAL DE TECNOLOGÍA DE MICRORRECUTORES, POR APLICACIÓN, 2020-2027 (MILLONES DE USD) 28
- FIGURA 8 MERCADO GLOBAL DE TECNOLOGÍA DE MICRORRECUTORES, POR USO FINAL, 2020-2027 (MILLONES DE USD) 34
- FIGURA 9 CUOTA DE MERCADO GLOBAL DE TECNOLOGÍA DE MICRORRECURTORES, POR REGIÓN EN 2015 40
- FIGURA 10 LA COLABORACIÓN FUE LA PRINCIPAL ESTRATEGIA DE CRECIMIENTO ADOPTADA POR LOS AGENTES DE TECNOLOGÍA DE MICRORRECURTORES, 2020 67
- FIGURA 11 COLABORACIÓN: LA PRINCIPAL ESTRATEGIA ADOPTADA POR CHEMTRIX LTD, 2020 68
- FIGURA 12 CUOTA DE MERCADO GLOBAL DE TECNOLOGÍA DE MICRORRECURTORES, POR REGIÓN (2016-2022) 88
Customer Stories

“This is really good guys. Excellent work on a tight deadline. I will continue to use you going forward and recommend you to others. Nice job”

“Thanks. It’s been a pleasure working with you, please use me as reference with any other Intel employees.”

“Thanks for sending the report it gives us a good global view of the Betaïne market.”

“Thank you, this will be very helpful for OQS.”

“We found the report very insightful! we found your research firm very helpful. I'm sending this email to secure our future business.”

“I am very pleased with how market segments have been defined in a relevant way for my purposes (such as "Portable Freezers & refrigerators" and "last-mile"). In general the report is well structured. Thanks very much for your efforts.”

“I have been reading the first document or the study, ,the Global HVAC and FP market report 2021 till 2026. Must say, good info! I have not gone in depth at all parts, but got a good indication of the data inside!”

“We got the report in time, we really thank you for your support in this process. I also thank to all of your team as they did a great job.”
