
Europe Biodiesel Fuel Additive Market
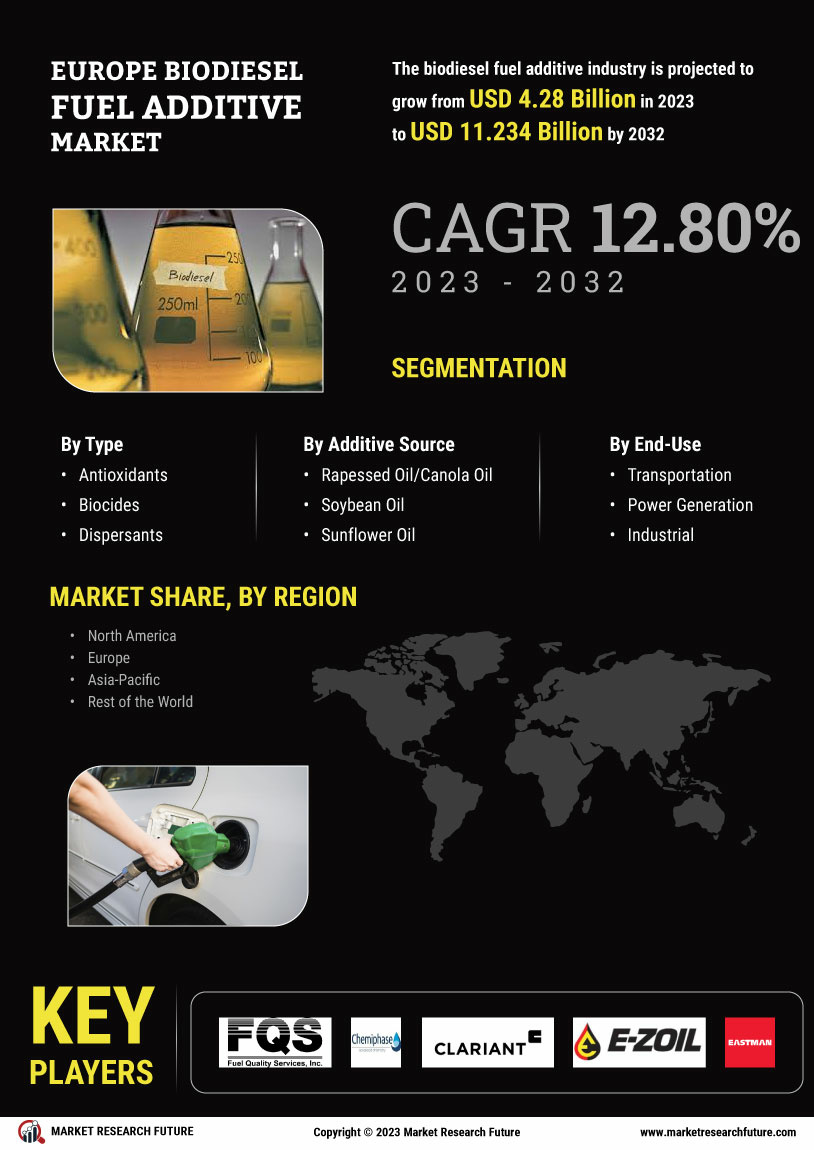
Informe de investigación del mercado de aditivos para combustible biodiésel en Europa, información por fuente (aceite de colza/canola, aceite de soja, aceite de girasol, aceite de palma, éster de aceite de cocina usado, grasa animal y otros), por tipo (antioxidantes, mejoradores de flujo en frío, mejoradores de octano y cetano, biocidas, dispersantes y otros), por uso final (transporte, generación de energía, industrial y otros) y pronóstico del mercado europeo hasta 2034.

- 1 RESUMEN EJECUTIVO
-
2 INTRODUCCIÓN AL MERCADO
- 2.1 Definición
-
2.2 Alcance del estudio
- 2.2.1 Objetivo de la investigación
- 2.2.2 Supuestos
- 2.2.3 Limitaciones
-
3 METODOLOGÍA DE LA INVESTIGACIÓN
- 3.1 Descripción general
- 3.2 Minería de datos
- 3.3 Investigación secundaria
-
3.4 Investigación primaria
- 3.4.1 Entrevistas primarias y proceso de recopilación de información
- 3.4.2 Desglose de los encuestados primarios
- 3.5 Modelo de pronóstico
-
3.6 Estimación del tamaño del mercado
- 3.6.1 Enfoque ascendente
- 3.6.2 Enfoque descendente
- 3.7 Triangulación de datos
- 3.8 Validación
-
4 DINÁMICA DEL MERCADO
- 4.1 Visión general
- 4.2 Impulsores
- 4.3 Restricciones
- 4.4 Oportunidades
-
5 ANÁLISIS DE FACTORES DE MERCADO
- 5.1 Análisis de la cadena de valor
-
5.2 Análisis de las cinco fuerzas de Porter
- 5.2.1 Poder de negociación de los proveedores
- 5.2.2 Poder de negociación de los compradores
- 5.2.3 Amenaza de nuevos participantes
- 5.2.4 Amenaza de sustitutos
- 5.2.5 Intensidad de la rivalidad
-
5.3 Análisis del impacto de la COVID-19
- 5.3.1 Análisis del impacto en el mercado
- 5.3.2 Impacto regional
- 5.3.3 Análisis de oportunidades y amenazas
-
6 MERCADO EUROPEO DE ADITIVOS PARA COMBUSTIBLES DE BIODIESEL, POR FUENTE
- 6.1 Resumen
- 6.2 Aceite de colza/canola
- 6.3 Aceite de soja
- 6.4 Aceite de girasol
- 6.5 Aceite de palma
- 6.6 Ésteres de aceite de cocina usado
- 6.7 Grasa animal
- 6.8 Otros
-
7 MERCADO EUROPEO DE ADITIVOS PARA COMBUSTIBLES DE BIODIESEL, POR TIPO
- 7.1 Resumen
- 7.2 Antioxidantes
- 7.3 Mejoradores de fluidez en frío
- 7.4 Mejoradores de octano y cetano
- 7.5 Biocidas
- 7.6 Dispersantes
- 7.7 Otros
-
8 MERCADO EUROPEO DE ADITIVOS PARA COMBUSTIBLES DE BIODIESEL, POR USO FINAL
- 8.1 Resumen
- 8.2 Transporte
- 8.3 Generación de energía
- 8.4 Industrial
- 8.5 Otros
-
9 MERCADO EUROPEO DE ADITIVOS PARA COMBUSTIBLES DE BIODIESEL, POR REGIÓN
- 9.1 Resumen
-
9.2 Europa
- 9.2.1 Alemania
- 9.2.2 Francia
- 9.2.3 Reino Unido
- 9.2.4 Italia
- 9.2.5 España
- 9.2.6 Resto de Europa
-
10 PANORAMA COMPETITIVO
- 10.1 Visión general
- 10.2 Análisis competitivo
- 10.3 Análisis de la cuota de mercado
- 10.4 Estrategia de crecimiento principal en el mercado europeo de aditivos para biodiésel
- 10.5 Análisis comparativo competitivo
- 10.6 Principales actores en cuanto a número de desarrollos en el mercado europeo de aditivos para biodiésel
-
10.7 Desarrollos clave y estrategias de crecimiento
- 10.7.1 Lanzamiento de nuevos productos/implementación de servicios
- 10.7.2 Fusiones y adquisiciones
- 10.7.3 Empresas conjuntas
-
10.8 Matriz financiera de las principales empresas
- 10.8.1 Ventas e ingresos operativos, 2022
- 10.8.2 Gasto en I+D de las principales empresas, 2022
-
11 PERFILES DE LAS EMPRESAS
-
11.1 Fuel Quality Services, Inc. (FQS)
- 11.1.1 Descripción general de la empresa
- 11.1.2 Descripción financiera
- 11.1.3 Productos ofrecidos
- 11.1.4 Desarrollos clave
- 11.1.5 Análisis FODA
- 11.1.6 Estrategias clave
-
11.2 CHEMIPHASE LTD
- 11.2.1 Descripción general de la empresa
- 11.2.2 Descripción financiera
- 11.2.3 Productos ofrecidos
- 11.2.4 Desarrollos clave
- 11.2.5 Análisis FODA
- 11.2.6 Estrategias clave
-
11.3 CLARIANT AG
- 11.3.1 Descripción general de la empresa
- 11.3.2 Descripción financiera
- 11.3.3 Productos ofrecidos
- 11.3.4 Desarrollos clave
- 11.3.5 Análisis FODA
- 11.3.6 Estrategias clave
-
11.4 E-ZOIL
- 11.4.1 Descripción general de la empresa
- 11.4.2 Descripción financiera
- 11.4.3 Productos ofrecidos
- 11.4.4 Desarrollos clave
- 11.4.5 Análisis FODA
- 11.4.6 Estrategias clave
-
11.5 Eastman Chemical Company
- 11.5.1 Descripción general de la empresa
- 11.5.2 Descripción financiera
- 11.5.3 Productos ofrecidos
- 11.5.4 Desarrollos clave
- 11.5.5 Análisis FODA
- 11.5.6 Estrategias clave
-
11.6 The Lubrizol Corporation
- 11.6.1 Descripción general de la empresa
- 11.6.2 Descripción financiera
- 11.6.3 Productos ofrecidos
- 11.6.4 Desarrollos clave
- 11.6.5 Análisis FODA
- 11.6.6 Estrategias clave
-
11.7 Afton Chemical Corporation
- 11.7.1 Descripción general de la empresa
- 11.7.2 Descripción financiera
- 11.7.3 Productos ofrecidos
- 11.7.4 Desarrollos clave
- 11.7.5 Análisis FODA
- 11.7.6 Estrategias clave
-
11.8 EVONIK INDUSTRIES AG
- 11.8.1 Descripción general de la empresa
- 11.8.2 Descripción financiera
- 11.8.3 Productos ofrecidos
- 11.8.4 Desarrollos clave
- 11.8.5 Análisis FODA
- 11.8.6 Estrategias clave
-
11.9 Chevron Oronite Company LLC
- 11.9.1 Descripción general de la empresa
- 11.9.2 Descripción financiera
- 11.9.3 Productos ofrecidos
- 11.9.4 Desarrollos clave
- 11.9.5 Análisis FODA
- 11.9.6 Estrategias clave
-
11.10 Biofuel Systems Group Ltd.
- 11.10.1 Descripción general de la empresa
- 11.10.2 Descripción financiera
- 11.10.3 Productos ofrecidos
- 11.10.4 Desarrollos clave
- 11.10.5 Análisis FODA
- 11.10.6 Estrategias clave
-
11.11 TotalEnergies
- 11.11.1 Descripción general de la empresa
- 11.11.2 Resumen financiero
- 11.11.3 Productos ofrecidos
- 11.11.4 Desarrollos clave
- 11.11.5 Análisis FODA
- 11.11.6 Estrategias clave
-
11.12 NALCO
- 11.12.1 Resumen de la empresa
- 11.12.2 Resumen financiero
- 11.12.3 Productos ofrecidos
- 11.12.4 Desarrollos clave
- 11.12.5 Análisis FODA
- 11.12.6 Estrategias clave
-
11.13 Infineum International Ltd.
- 11.13.1 Resumen de la empresa
- 11.13.2 Resumen financiero
- 11.13.3 Productos ofrecidos
- 11.13.4 Desarrollos clave
- 11.13.5 Análisis FODA
- 11.13.6 Estrategias clave
-
11.14 Innospec Inc.
- 11.14.1 Descripción general de la empresa
- 11.14.2 Descripción financiera
- 11.14.3 Productos ofrecidos
- 11.14.4 Desarrollos clave
- 11.14.5 Análisis FODA
- 11.14.6 Estrategias clave
-
11.15 Renewable Oil International
- 11.15.1 Descripción general de la empresa
- 11.15.2 Descripción financiera
- 11.15.3 Productos ofrecidos
- 11.15.4 Desarrollos Clave
- 11.15.5 Análisis FODA
- 11.15.6 Estrategias Clave
-
11.16 Kemin Industries Inc.
- 11.16.1 Descripción General de la Empresa
- 11.16.2 Descripción Financiera
- 11.16.3 Productos Ofrecidos
- 11.16.4 Desarrollos Clave
- 11.16.5 Análisis FODA
- 11.16.6 Estrategias Clave
-
11.17 Lubrizol Corporation
- 11.17.1 Descripción General de la Empresa
- 11.17.2 Descripción Financiera
- 11.17.3 Productos Ofrecidos
- 11.17.4 Desarrollos Clave
- 11.17.5 Análisis FODA
- 11.17.6 Estrategias Clave
-
11.18 PMC Biogenix Inc.
- 11.18.1 Descripción General de la Empresa
- 11.18.2 Descripción Financiera
- 11.18.3 Productos Ofrecidos
- 11.18.4 Desarrollos Clave
- 11.18.5 Análisis FODA
- 11.18.6 Estrategias Clave
-
11.19 Power Service Products Inc.
- 11.19.1 Descripción General de la Empresa
- 11.19.2 Descripción Financiera
- 11.19.3 Productos Ofrecidos
- 11.19.4 Desarrollos Clave
- 11.19.5 Análisis FODA
- 11.19.6 Estrategias Clave
-
11.20 VANDERBILT CHEMICALS, LLC
- 11.20.1 Descripción General de la Empresa
- 11.20.2 Resumen Financiero
- 11.20.3 Productos Ofrecidos
- 11.20.4 Desarrollos Clave
- 11.20.5 Análisis FODA
- 11.20.6 Estrategias Clave
-
11.1 Fuel Quality Services, Inc. (FQS)
-
12 APÉNDICE
- 12.1 Referencias
- 12.2 Informes Relacionados
- ?
- LISTA DE TABLAS
- TABLA 1 MERCADO EUROPEO DE ADITIVOS PARA COMBUSTIBLE DE BIODIESEL, SINOPSIS, 2025-2034
- TABLA 2 MERCADO EUROPEO DE ADITIVOS PARA COMBUSTIBLE DE BIODIESEL, ESTIMACIONES Y PRONÓSTICO, 2025-2034 (MILES DE MILLONES DE USD)
- TABLA 3 MERCADO EUROPEO DE ADITIVOS PARA COMBUSTIBLE DE BIODIESEL, POR FUENTE, 2025-2034 (MILES DE MILLONES DE USD)
- TABLA 4 MERCADO EUROPEO DE ADITIVOS PARA COMBUSTIBLE DE BIODIESEL, POR TIPO, 2025-2034 (MILES DE MILLONES DE USD)
- TABLA 5 MERCADO EUROPEO DE ADITIVOS PARA COMBUSTIBLE DE BIODIESEL, POR USO FINAL, 2025-2034 (MILES DE MILLONES DE USD)
- TABLA 1 ALEMANIA: MERCADO DE ADITIVOS PARA COMBUSTIBLE DE BIODIESEL, POR FUENTE, 2025-2034 (MILES DE MILLONES DE USD)
- TABLA 2 ALEMANIA: MERCADO DE ADITIVOS PARA COMBUSTIBLE DE BIODIESEL, POR TIPO, 2025-2034 (MILES DE MILLONES DE USD) MIL MILLONES)
- TABLA 3 ALEMANIA: MERCADO DE ADITIVOS PARA COMBUSTIBLE BIODIESEL, POR USO FINAL, 2025-2034 (MILES DE MILLONES DE USD)
- TABLA 4 FRANCIA: MERCADO DE ADITIVOS PARA COMBUSTIBLE BIODIESEL, POR FUENTE, 2025-2034 (MILES DE MILLONES DE USD)
- TABLA 5 FRANCIA: MERCADO DE ADITIVOS PARA COMBUSTIBLE BIODIESEL, POR TIPO, 2025-2034 (MILES DE MILLONES DE USD)
- TABLA 6 FRANCIA: MERCADO DE ADITIVOS PARA COMBUSTIBLE BIODIESEL, POR USO FINAL, 2025-2034 (MILES DE MILLONES DE USD)
- TABLA 7 ITALIA: MERCADO DE ADITIVOS PARA COMBUSTIBLE BIODIESEL, POR FUENTE, 2025-2034 (MILES DE MILLONES DE USD)
- TABLA 8 ITALIA: MERCADO DE ADITIVOS PARA COMBUSTIBLE BIODIESEL, POR TIPO, 2025-2034 (MILES DE MILLONES DE USD)
- TABLA 9 ITALIA: MERCADO DE ADITIVOS PARA COMBUSTIBLE BIODIESEL, POR USO FINAL, 2025-2034 (MILES DE MILLONES DE USD)
- TABLA 10 ESPAÑA: MERCADO DE ADITIVOS PARA COMBUSTIBLE BIODIESEL, POR ORIGEN, 2025-2034 (MILES DE MILLONES DE USD)
- TABLA 11 ESPAÑA: MERCADO DE ADITIVOS PARA COMBUSTIBLE BIODIESEL, POR TIPO, 2025-2034 (MILES DE MILLONES DE USD)
- TABLA 12 ESPAÑA: MERCADO DE ADITIVOS PARA COMBUSTIBLE BIODIESEL, POR USO FINAL, 2025-2034 (MILES DE MILLONES DE USD)
- TABLA 13 REINO UNIDO: MERCADO DE ADITIVOS PARA COMBUSTIBLE BIODIESEL, POR ORIGEN, 2025 - 2034 (MILES DE MILLONES DE USD)
- TABLA 14 REINO UNIDO: MERCADO DE ADITIVOS PARA COMBUSTIBLE DE BIODIESEL, POR TIPO, 2025 - 2034 (MILES DE MILLONES DE USD)
- TABLA 15 REINO UNIDO: MERCADO DE ADITIVOS PARA COMBUSTIBLE DE BIODIESEL, POR USO FINAL, 2025 - 2034 (MILES DE MILLONES DE USD)
- TABLA 16 RESTO DE EUROPA: MERCADO DE ADITIVOS PARA COMBUSTIBLE DE BIODIESEL, POR FUENTE, 2025 - 2034 (MILES DE MILLONES DE USD)
- TABLA 17 RESTO DE EUROPA: MERCADO DE ADITIVOS PARA COMBUSTIBLE DE BIODIESEL, POR TIPO, 2025 - 2034 (MILES DE MILLONES DE USD)
- TABLA 18 RESTO DE EUROPA: MERCADO DE ADITIVOS PARA COMBUSTIBLE DE BIODIESEL, POR USO FINAL, 2025 - 2034 (MILES DE MILLONES DE USD)
- LISTA DE FIGURAS
- FIGURA 1 PROCESO DE INVESTIGACIÓN
- FIGURA 2 ESTRUCTURA DEL MERCADO DE ADITIVOS PARA COMBUSTIBLE DE BIODIESEL EN EUROPA
- FIGURA 3 DINÁMICA DEL MERCADO DE ADITIVOS PARA COMBUSTIBLE DE BIODIESEL EN EUROPA
- FIGURA 4 MERCADO DE ADITIVOS PARA COMBUSTIBLE DE BIODIESEL EN EUROPA, PARTICIPACIÓN (%), POR FUENTE, 2021
- FIGURA 5 MERCADO DE ADITIVOS PARA COMBUSTIBLE DE BIODIESEL EN EUROPA, PARTICIPACIÓN (%), POR TIPO, 2021
- FIGURA 6 MERCADO DE ADITIVOS PARA COMBUSTIBLE DE BIODIESEL EN EUROPA, PARTICIPACIÓN (%), POR USO FINAL, 2021
- FIGURA 7 MERCADO DE ADITIVOS PARA COMBUSTIBLE DE BIODIESEL EN EUROPA, PARTICIPACIÓN (%), POR REGIÓN, 2021
- FIGURA 8 MERCADO EUROPEO DE ADITIVOS PARA COMBUSTIBLE DE BIODIESEL: ANÁLISIS DE LA PARTICIPACIÓN DE LA EMPRESA, 2021 (%)
- FIGURA 9 FUEL QUALITY SERVICES, INC. (FQS): RESUMEN FINANCIERO
- FIGURA 10 FUEL QUALITY SERVICES, INC. (FQS): ANÁLISIS FODA
- FIGURA 11 CHEMIPHASE LTD: RESUMEN FINANCIERO
- FIGURA 12 CHEMIPHASE LTD: ANÁLISIS FODA
- FIGURA 13 CLARIANT AG: RESUMEN FINANCIERO
- FIGURA 14 CLARIANT AG: ANÁLISIS FODA
- FIGURA 15 E-ZOIL: RESUMEN FINANCIERO INSTANTÁNEA
- FIGURA 16 E-ZOIL: ANÁLISIS FODA
- FIGURA 17 EASTMAN CHEMICAL COMPANY: INSTANTÁNEA DE LA VISIÓN FINANCIERA
- FIGURA 18 EASTMAN CHEMICAL COMPANY: ANÁLISIS FODA
- FIGURA 19 THE LUBRIZOL CORPORATION: INSTANTÁNEA DE LA VISIÓN FINANCIERA
- FIGURA 20 THE LUBRIZOL CORPORATION: ANÁLISIS FODA
- FIGURA 21 AFTON CHEMICAL CORPORATION: INSTANTÁNEA DE LA VISIÓN FINANCIERA
- FIGURA 22 AFTON CHEMICAL CORPORATION: ANÁLISIS FODA
- FIGURA 23 EVONIK INDUSTRIES AG: INSTANTÁNEA DE LA VISIÓN FINANCIERA INSTANTÁNEA
- FIGURA 24 EVONIK INDUSTRIES AG: ANÁLISIS FODA
- FIGURA 25 CHEVRON ORONITE COMPANY LLC: INSTANTÁNEA DE LA VISIÓN FINANCIERA
- FIGURA 26 CHEVRON ORONITE COMPANY LLC: ANÁLISIS FODA
- FIGURA 27 BIOFUEL SYSTEMS GROUP LTD.: INSTANTÁNEA DE LA VISIÓN FINANCIERA
- FIGURA 28 BIOFUEL SYSTEMS GROUP LTD.: ANÁLISIS FODA
- FIGURA 29 TOTALENERGIES: INSTANTÁNEA DE LA VISIÓN FINANCIERA
- FIGURA 30 TOTALENERGIES: ANÁLISIS FODA
- FIGURA 31 NALCO: INSTANTÁNEA DE LA VISIÓN FINANCIERA INSTANTÁNEA
- FIGURA 32 NALCO: ANÁLISIS FODA
- FIGURA 33 INFINEUM INTERNATIONAL LTD.: INSTANTÁNEA DE LA VISIÓN GENERAL FINANCIERA
- FIGURA 34 INFINEUM INTERNATIONAL LTD.: ANÁLISIS FODA
- FIGURA 35 INNOSPEC INC.: INSTANTÁNEA DE LA VISIÓN GENERAL FINANCIERA
- FIGURA 36 INNOSPEC INC.: ANÁLISIS FODA
- FIGURA 37 RENEWABLE OIL INTERNATIONAL: INSTANTÁNEA DE LA VISIÓN GENERAL FINANCIERA
- FIGURA 38 RENEWABLE OIL INTERNATIONAL: ANÁLISIS FODA
- FIGURA 39 KEMIN INDUSTRIES INC.: INSTANTÁNEA DE LA VISIÓN GENERAL FINANCIERA
- FIGURA 40 KEMIN INDUSTRIES INC.: ANÁLISIS FODA
- FIGURA 41 LUBRIZOL CORPORATION: RESUMEN FINANCIERO
- FIGURA 42 LUBRIZOL CORPORATION: ANÁLISIS FODA
- FIGURA 43 PMC BIOGENIX INC.: RESUMEN FINANCIERO
- FIGURA 44 PMC BIOGENIX INC.: ANÁLISIS FODA
- FIGURA 45 POWER SERVICE PRODUCTS INC.: RESUMEN FINANCIERO
- FIGURA 46 POWER SERVICE PRODUCTS INC.: ANÁLISIS FODA
- FIGURA 47 VANDERBILT CHEMICALS, LLC: RESUMEN FINANCIERO
- FIGURA 48 VANDERBILT CHEMICALS, LLC: ANÁLISIS FODA
Customer Stories

“This is really good guys. Excellent work on a tight deadline. I will continue to use you going forward and recommend you to others. Nice job”

“Thanks. It’s been a pleasure working with you, please use me as reference with any other Intel employees.”

“Thanks for sending the report it gives us a good global view of the Betaïne market.”

“Thank you, this will be very helpful for OQS.”

“We found the report very insightful! we found your research firm very helpful. I'm sending this email to secure our future business.”

“I am very pleased with how market segments have been defined in a relevant way for my purposes (such as "Portable Freezers & refrigerators" and "last-mile"). In general the report is well structured. Thanks very much for your efforts.”

“I have been reading the first document or the study, ,the Global HVAC and FP market report 2021 till 2026. Must say, good info! I have not gone in depth at all parts, but got a good indication of the data inside!”

“We got the report in time, we really thank you for your support in this process. I also thank to all of your team as they did a great job.”
