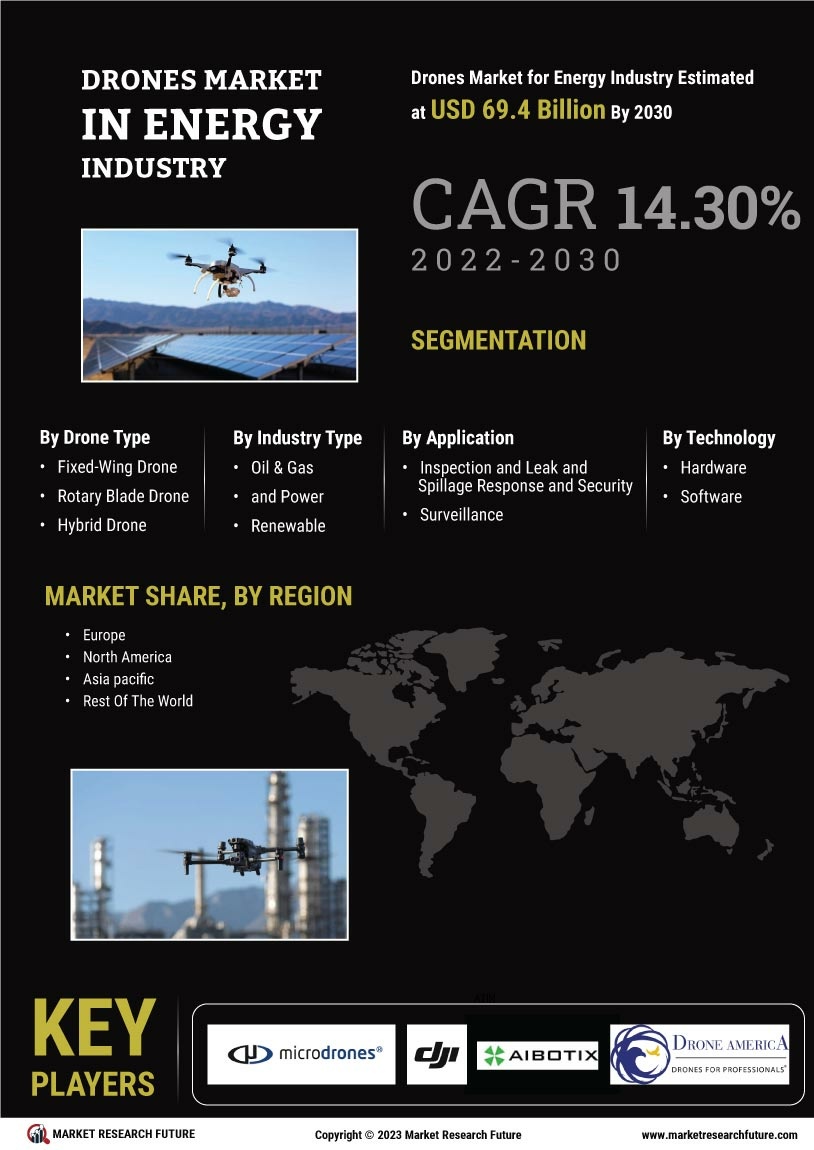
Drones Energy Industry Market
Market Size
Key Players
- Increased Adoption of Renewable Energy
- Technological Advancements in Drone Capabilities
- Regulatory Support for Drone Integration
- Advancements in Drone Technology
- Expansion of Infrastructure Development
- Growing Demand for Efficient Energy Solutions
-
1 Resumen ejecutivo
-
1.1 Análisis del atractivo del mercado
- 1.1.1 Drones globales en la industria energética, por tipo de dron
- 1.1.2 Drones globales en la industria energética, por tipo de industria
- 1.1.3 Drones globales en la industria energética, por tecnología
- 1.1.4 Drones globales en la industria energética, por aplicación
- 1.1.5 Drones globales en la industria energética, por región
-
1.1 Análisis del atractivo del mercado
-
2 Introducción al mercado
- 2.1 Definición del mercado
- 2.2 Alcance del estudio
- 2.3 Estructura del mercado
- 2.4 Criterios clave de compra
- 2.5 Análisis de indicadores de factores del mercado
-
3 Metodología de investigación
- 3.1 Proceso de investigación
- 3.2 Investigación primaria
- 3.3 Investigación secundaria
- 3.4 Estimación del tamaño del mercado
- 3.5 Modelo de pronóstico
- 3.6 Lista de supuestos
- 4 Perspectivas del mercado
-
5 Dinámica del mercado
- 5.1 Introducción
- 5.2 Factores impulsores
- 5.3 Limitaciones
- 5.4 Oportunidades
- 5.5 Tendencias del mercado/Tecnología
- 5.6 Tendencias de patentes
- 5.7 Panorama regulatorio/Estándares
-
6 Análisis de factores del mercado
-
6.1 Análisis de la cadena de valor/cadena de suministro
- 6.1.1 I+D
- 6.1.2 Fabricación
- 6.1.3 Distribución y ventas
- 6.1.4 Monitoreo posventa
-
6.2 Análisis de las cinco fuerzas de Porter
- 6.2.1 Amenaza de nuevos competidores
- 6.2.2 Poder de negociación de los compradores
- 6.2.3 Amenaza de sustitutos
- 6.2.4 Rivalidad en el segmento
- 6.2.5 Poder de negociación de los proveedores
-
6.1 Análisis de la cadena de valor/cadena de suministro
-
7 Mercado global de drones para la industria energética, por tipo de dron
- 7.1 Introducción
-
7.2 Dron de ala fija
- 7.2.1 Estimaciones y pronósticos del mercado, 2021-2030
- 7.2.2 Estimaciones y pronósticos del mercado, por región, 2021-2030
-
7.3 Dron de palas giratorias
- 7.3.1 Estimaciones y pronósticos del mercado, 2021-2030
- 7.3.2 Estimaciones y pronósticos del mercado, por región, 2021-2030
-
7.4 Dron híbrido
- 7.4.1 Estimaciones y pronósticos del mercado, 2021-2030
- 7.4.2 Estimaciones y pronósticos del mercado Pronóstico por región, 2021-2030
-
8 Mercado global de drones para la industria energética, por tipo de industria
- 8.1 Introducción
-
8.2 Petróleo y gas
- 8.2.1 Estimaciones y pronóstico del mercado, 2021-2030
- 8.2.2 Estimaciones y pronóstico del mercado, por región, 2021-2030
-
8.3 Energía y renovables
- 8.3.1 Estimaciones y pronóstico del mercado, 2021-2030
- 8.3.2 Estimaciones y pronóstico del mercado, por región, 2021-2030
-
9 Mercado global de drones para la industria energética, por tecnología
- 9.1 Introducción
-
9.2 Hardware
- 9.2.1 Estimaciones y pronóstico del mercado, 2021-2030
- 9.2.2 Estimaciones y pronósticos del mercado por región, 2021-2030
-
9.3 Software
- 9.3.1 Estimaciones y pronósticos del mercado, 2021-2030
- 9.3.2 Estimaciones y pronósticos del mercado por región, 2021-2030
-
10 Mercado global de drones para la industria energética, por aplicación
- 10.1 Introducción
-
10.2 Inspección
- 10.2.1 Estimaciones y pronósticos del mercado, 2021-2030
- 10.2.2 Estimaciones y pronósticos del mercado por región, 2021-2030
-
10.3 Respuesta a fugas y derrames, seguridad y vigilancia
- 10.3.1 Estimaciones y pronósticos del mercado, 2021-2030
- 10.3.2 Estimaciones y pronósticos del mercado Pronóstico por región, 2021-2030
-
11 Mercado global de drones para la industria energética, por región
- 11.1 Introducción
-
11.2 Norteamérica
- 11.2.1 Estimaciones y pronóstico del mercado, por país, 2021-2030
- 11.2.2 Estimaciones y pronóstico del mercado, por tipo de dron, 2021-2030
- 11.2.3 Estimaciones y pronóstico del mercado, por tipo de industria, 2021-2030
- 11.2.4 Estimaciones y pronóstico del mercado, por tecnología, 2021-2030
- 11.2.5 Estimaciones y pronóstico del mercado, por aplicación, 2021-2030
- 11.2.6 EE. UU.
- 11.2.7 Canadá
-
11.3 Europa
- 11.3.1 Estimaciones y pronósticos de mercado por país, 2021-2030
- 11.3.2 Estimaciones y pronósticos de mercado por tipo de dron, 2021-2030
- 11.3.3 Estimaciones y pronósticos de mercado por tipo de industria, 2021-2030
- 11.3.4 Estimaciones y pronósticos de mercado por tecnología, 2021-2030
- 11.3.5 Estimaciones y pronósticos de mercado por aplicación, 2021-2030
- 11.3.6 Reino Unido
- 11.3.7 Alemania
- 11.3.8 Francia
- 11.3.9 Italia
- 11.3.10 Resto de Europa
-
11.4 Asia-Pacífico
- 11.4.1 Estimaciones y pronósticos de mercado Pronóstico por país, 2021-2030
- 11.4.2 Estimaciones y pronósticos de mercado por tipo de dron, 2021-2030
- 11.4.3 Estimaciones y pronósticos de mercado por tipo de industria, 2021-2030
- 11.4.4 Estimaciones y pronósticos de mercado por tecnología, 2021-2030
- 11.4.5 Estimaciones y pronósticos de mercado por aplicación, 2021-2030
- 11.4.6 China
- 11.4.7 Japón
- 11.4.8 India
- 11.4.9 Australia
- 11.4.10 Resto de Asia-Pacífico
-
11.5 Oriente Medio y África
- 11.5.1 Estimaciones y pronósticos de mercado Pronóstico por país, 2021-2030
- 11.5.2 Estimaciones y pronóstico del mercado por tipo de dron, 2021-2030
- 11.5.3 Estimaciones y pronóstico del mercado por tipo de industria, 2021-2030
- 11.5.4 Estimaciones y pronóstico del mercado por tecnología, 2021-2030
- 11.5.5 Estimaciones y pronóstico del mercado por aplicación, 2021-2030
- 11.5.6 Arabia Saudita
- 11.5.7 Emiratos Árabes Unidos
- 11.5.8 Resto de Oriente Medio y África
-
11.6 Latinoamérica
- 11.6.1 Estimaciones y pronóstico del mercado por país, 2021-2030
- 11.6.2 Estimaciones y pronóstico del mercado Pronóstico por tipo de dron, 2021-2030
- 11.6.3 Estimaciones y pronósticos de mercado por tipo de industria, 2021-2030
- 11.6.4 Estimaciones y pronósticos de mercado por tecnología, 2021-2030
- 11.6.5 Estimaciones y pronósticos de mercado por aplicación, 2021-2030
- 11.6.6 Brasil
- 11.6.7 Resto de Latinoamérica
-
12 Panorama competitivo
- 12.1 Panorama competitivo
- 12.2 Panel de competidores
- 12.3 Estrategia de crecimiento clave en la industria global de drones en energía
- 12.4 Benchmarking competitivo
- 12.5 Análisis de la cuota de mercado
- 12.6 Actor líder en número de desarrollos en la industria global de drones en energía
-
12.7 Desarrollos Clave y Estrategias de Crecimiento
- 12.7.1 Lanzamiento de Nuevos Productos/Implementación de Servicios
- 12.7.2 Fusiones y Adquisiciones
- 12.7.3 Empresas Conjuntas
-
13 Perfiles de Empresas
-
13.1 Actores Clave del Mercado
- 13.1.1 AeroVironment, Inc.
- 13.1.2 DJI
- 13.1.3 Aeryon Labs Plc.
- 13.1.4 Aibotix GmbH Limited
- 13.1.5 Ascending Technologies Inc.
- 13.1.6 UAVision.
- 13.1.7 Drone America
- 13.1.8 Draganfly Innovations Inc.
- 13.1.9 ING Robotic Aviation
- 13.1.10 Microdrones
-
13.1 Actores Clave del Mercado
-
14 Apéndice
- 14.1 Referencias
- 14.2 Informes relacionados
- 14.3 Lista de abreviaturas
-
15 Lista de tablas
- TABLA 1 LISTA DE SUPUESTOS
- TABLA 2 PRINCIPALES PATENTES CONCEDIDAS PARA ENTRETENIMIENTO A BORDO (15 DE MAYO DE 2021 - 15 DE MAYO DE 2030)
- TABLA 3 PLATAFORMA: MERCADO MUNDIAL DE DRONES EN LA INDUSTRIA ENERGÉTICA, 2021-2030 (MILLONES DE USD)
- TABLA 4 TIPO DE PRODUCTO: MERCADO MUNDIAL DE DRONES EN LA INDUSTRIA ENERGÉTICA, 2021-2030 (MILLONES DE USD)
- TABLA 5 TECNOLOGÍA: MERCADO MUNDIAL DE DRONES EN LA INDUSTRIA ENERGÉTICA, 2021-2030 (MILLONES DE USD)
- TABLA 6 TIPO DE SERVICIO: MERCADO MUNDIAL DE DRONES EN LA INDUSTRIA ENERGÉTICA, 2021-2030 (MILLONES DE USD) MILLONES)
- TABLA 7 MERCADO MUNDIAL DE DRONES EN LA INDUSTRIA ENERGÉTICA, POR REGIÓN, 2021-2030 (MILLONES DE USD)
- TABLA 8 AMÉRICA DEL NORTE: MERCADO DE DRONES EN LA INDUSTRIA ENERGÉTICA, POR PAÍS, 2021-2030 (MILLONES DE USD)
- TABLA 9 AMÉRICA DEL NORTE: MERCADO POR TIPO DE DRONE, 2021-2030 (MILLONES DE USD)
- TABLA 10 AMÉRICA DEL NORTE: MERCADO POR TIPO DE INDUSTRIA, 2021-2030 (MILLONES DE USD)
- TABLA 11 AMÉRICA DEL NORTE: MERCADO POR TECNOLOGÍA, 2021-2030 (MILLONES DE USD)
- TABLA 12 AMÉRICA DEL NORTE: MERCADO POR APLICACIÓN, 2021-2030 (MILLONES DE USD) MILLONES)
- TABLA 13 EE. UU.: MERCADO DE DRONES EN LA INDUSTRIA ENERGÉTICA, POR TIPO DE DRONE, 2021-2030 (MILLONES DE USD)
- TABLA 14 EE. UU.: MERCADO POR TIPO DE INDUSTRIA, 2021-2030 (MILLONES DE USD)
- TABLA 15 EE. UU.: MERCADO POR TECNOLOGÍA, 2021-2030 (MILLONES DE USD)
- TABLA 16 EE. UU.: MERCADO POR APLICACIÓN, 2021-2030 (MILLONES DE USD)
- TABLA 17 CANADÁ: MERCADO DE DRONES EN LA INDUSTRIA ENERGÉTICA, POR TIPO DE DRONE, 2021-2030 (MILLONES DE USD)
- TABLA 18 CANADÁ: MERCADO POR TIPO DE INDUSTRIA, 2021-2030 (MILLONES DE USD)
- TABLA 19 CANADÁ: MERCADO POR TECNOLOGÍA, 2021-2030 (MILLONES DE USD)
- TABLA 20 CANADÁ: MERCADO POR APLICACIÓN, 2021-2030 (MILLONES DE USD)
- TABLA 21 EUROPA: MERCADO DE DRONES EN LA INDUSTRIA ENERGÉTICA, POR PAÍS, 2021-2030 (MILLONES DE USD)
- TABLA 22 EUROPA: MERCADO POR TIPO DE DRONES, 2021-2030 (MILLONES DE USD)
- TABLA 23 EUROPA: MERCADO POR TIPO DE INDUSTRIA, 2021-2030 (MILLONES DE USD)
- TABLA 24 EUROPA: MERCADO POR TECNOLOGÍA, 2021-2030 (MILLONES DE USD)
- TABLA 25 EUROPA: MERCADO POR APLICACIÓN, 2021-2030 (MILLONES DE USD)
- TABLA 26 REINO UNIDO: MERCADO DE DRONES EN LA INDUSTRIA ENERGÉTICA, POR TIPO DE DRONE, 2021-2030 (MILLONES DE USD)
- TABLA 27 REINO UNIDO: MERCADO POR TIPO DE INDUSTRIA, 2021-2030 (MILLONES DE USD)
- TABLA 28 REINO UNIDO: MERCADO POR TECNOLOGÍA, 2021-2030 (MILLONES DE USD)
- TABLA 29 REINO UNIDO: MERCADO POR APLICACIÓN, 2021-2030 (MILLONES DE USD)
- TABLA 30 ALEMANIA: MERCADO DE DRONES EN LA INDUSTRIA ENERGÉTICA, POR TIPO DE DRONE, 2021-2030 (MILLONES DE USD)
- TABLA 31 ALEMANIA: MERCADO POR TIPO DE INDUSTRIA, 2021-2030 (MILLONES DE USD)
- TABLA 32 ALEMANIA: MERCADO POR TECNOLOGÍA, 2021-2030 (MILLONES DE USD)
- TABLA 33 ALEMANIA: MERCADO POR APLICACIÓN, 2021-2030 (MILLONES DE USD)
- TABLA 34 FRANCIA: MERCADO DE DRONES EN LA INDUSTRIA ENERGÉTICA, POR TIPO DE DRONE, 2021-2030 (MILLONES DE USD)
- TABLA 35 FRANCIA: MERCADO POR TIPO DE INDUSTRIA, 2021-2030 (MILLONES DE USD)
- TABLA 36 FRANCIA: MERCADO POR TECNOLOGÍA, 2021-2030 (MILLONES DE USD)
- TABLA 37 FRANCIA: MERCADO POR APLICACIÓN, 2021-2030 (MILLONES DE USD)
- TABLA 38 ITALIA: MERCADO DE DRONES EN LA INDUSTRIA ENERGÉTICA, POR TIPO DE DRONE, 2021-2030 (USD MILLONES)
- TABLA 39 ITALIA: MERCADO POR TIPO DE INDUSTRIA, 2021-2030 (USD MILLONES)
- TABLA 40 ITALIA: MERCADO POR TECNOLOGÍA, 2021-2030 (USD MILLONES)
- TABLA 41 ITALIA: MERCADO POR APLICACIÓN, 2021-2030 (USD MILLONES)
- TABLA 42 RESTO DE EUROPA: MERCADO DE DRONES EN LA INDUSTRIA ENERGÉTICA, POR TIPO DE DRONE, 2021-2030 (USD MILLONES)
- TABLA 43 RESTO DE EUROPA: MERCADO POR TIPO DE INDUSTRIA, 2021-2030 (USD MILLONES)
- TABLA 44 RESTO DE EUROPA: MERCADO POR TECNOLOGÍA, 2021-2030 (USD MILLONES)
- TABLA 45 RESTO DE EUROPA: MERCADO POR APLICACIÓN, 2021-2030 (MILLONES DE USD)
- TABLA 46 ASIA-PACÍFICO: MERCADO DE DRONES EN LA INDUSTRIA ENERGÉTICA, POR PAÍS, 2021-2030 (MILLONES DE USD)
- TABLA 47 ASIA-PACÍFICO: MERCADO POR TIPO DE DRONE, 2021-2030 (MILLONES DE USD)
- TABLA 48 ASIA-PACÍFICO: MERCADO POR TIPO DE INDUSTRIA, 2021-2030 (MILLONES DE USD)
- TABLA 49 ASIA-PACÍFICO: MERCADO POR TECNOLOGÍA, 2021-2030 (MILLONES DE USD)
- TABLA 50 ASIA-PACÍFICO: MERCADO POR APLICACIÓN, 2021-2030 (MILLONES DE USD)
- TABLA 51 CHINA: MERCADO DE DRONES EN LA INDUSTRIA ENERGÉTICA, POR TIPO DE DRONE, 2021-2030 (MILLONES DE USD)
- TABLA 52 CHINA: MERCADO POR TIPO DE INDUSTRIA, 2021-2030 (MILLONES DE USD)
- TABLA 53 CHINA: MERCADO POR TECNOLOGÍA, 2021-2030 (MILLONES DE USD)
- TABLA 54 CHINA: MERCADO POR APLICACIÓN, 2021-2030 (MILLONES DE USD)
- TABLA 55 INDIA: MERCADO DE DRONES EN LA INDUSTRIA ENERGÉTICA, POR TIPO DE DRONE, 2021-2030 (MILLONES DE USD)
- TABLA 56 INDIA: MERCADO POR TIPO DE INDUSTRIA, 2021-2030 (MILLONES DE USD)
- TABLA 57 INDIA: MERCADO POR TECNOLOGÍA, 2021-2030 (USD MILLONES)
- TABLA 58 INDIA: MERCADO POR APLICACIÓN, 2021-2030 (USD MILLONES)
- TABLA 59 JAPÓN: MERCADO DE DRONES EN LA INDUSTRIA ENERGÉTICA, POR TIPO DE DRONE, 2021-2030 (USD MILLONES)
- TABLA 60 JAPÓN: MERCADO POR TIPO DE INDUSTRIA, 2021-2030 (USD MILLONES)
- TABLA 61 JAPÓN: MERCADO POR TECNOLOGÍA, 2021-2030 (USD MILLONES)
- TABLA 62 JAPÓN: MERCADO POR APLICACIÓN, 2021-2030 (USD MILLONES)
- TABLA 63 AUSTRALIA: MERCADO DE DRONES EN LA INDUSTRIA ENERGÉTICA, POR TIPO DE DRONE, 2021-2030 (USD MILLONES)
- TABLA 64 AUSTRALIA: MERCADO POR TIPO DE INDUSTRIA, 2021-2030 (MILLONES DE USD)
- TABLA 65 AUSTRALIA: MERCADO POR TECNOLOGÍA, 2021-2030 (MILLONES DE USD)
- TABLA 66 AUSTRALIA: MERCADO POR APLICACIÓN, 2021-2030 (MILLONES DE USD)
- TABLA 67 RESTO DE ASIA-PACÍFICO: MERCADO DE DRONES EN LA INDUSTRIA ENERGÉTICA, POR TIPO DE DRONE, 2021-2030 (MILLONES DE USD)
- TABLA 68 RESTO DE ASIA-PACÍFICO: MERCADO POR TIPO DE INDUSTRIA, 2021-2030 (MILLONES DE USD)
- TABLA 69 RESTO DE ASIA-PACÍFICO: MERCADO POR TECNOLOGÍA, 2021-2030 (MILLONES DE USD) MILLONES)
- TABLA 70 RESTO DE ASIA-PACÍFICO: MERCADO POR APLICACIÓN, 2021-2030(MILLONES DE USD)
- TABLA 71 ORIENTE MEDIO Y ÁFRICA: MERCADO DE DRONES EN LA INDUSTRIA ENERGÉTICA, POR PAÍS, 2021-2030(MILLONES DE USD)
- TABLA 72 ORIENTE MEDIO Y ÁFRICA: MERCADO POR TIPO DE DRONE, 2021-2030(MILLONES DE USD)
- TABLA 73 ORIENTE MEDIO Y ÁFRICA: MERCADO POR TIPO DE INDUSTRIA, 2021-2030(MILLONES DE USD)
- TABLA 74 ORIENTE MEDIO Y ÁFRICA: MERCADO POR TECNOLOGÍA, 2021-2030(MILLONES DE USD)
- TABLA 75 ORIENTE MEDIO Y ÁFRICA: MERCADO POR APLICACIÓN, 2021-2030 (MILLONES DE USD)TABLA 76 ARABIA SAUDITA: MERCADO DE DRONES EN LA INDUSTRIA ENERGÉTICA, POR TIPO DE DRONE, 2021-2030 (MILLONES DE USD)
- TABLA 77 ARABIA SAUDITA: MERCADO POR TIPO DE INDUSTRIA, 2021-2030 (MILLONES DE USD)
- TABLA 78 ARABIA SAUDITA: MERCADO POR TECNOLOGÍA, 2021-2030 (MILLONES DE USD)
- TABLA 79 ARABIA SAUDITA: MERCADO POR APLICACIÓN, 2021-2030 (MILLONES DE USD)
- TABLA 80 EMIRATOS ÁRABES UNIDOS: MERCADO DE DRONES EN LA INDUSTRIA ENERGÉTICA, POR TIPO DE DRONE, 2021-2030 (MILLONES DE USD)
- TABLA 81 EMIRATOS ÁRABES UNIDOS: MERCADO POR TIPO DE INDUSTRIA, 2021-2030 (USD MILLONES)
- TABLA 82 EMIRATOS ÁRABES UNIDOS: MERCADO POR TECNOLOGÍA, 2021-2030 (USD MILLONES)
- TABLA 83 EMIRATOS ÁRABES UNIDOS: MERCADO POR APLICACIÓN, 2021-2030 (USD MILLONES)
- TABLA 84 RESTO DE ORIENTE MEDIO Y ÁFRICA: MERCADO DE DRONES EN LA INDUSTRIA ENERGÉTICA, POR TIPO DE DRONE, 2021-2030 (USD MILLONES)
- TABLA 85 RESTO DE ORIENTE MEDIO Y ÁFRICA: MERCADO POR TIPO DE INDUSTRIA, 2021-2030 (USD MILLONES)
- TABLA 86 RESTO DE ORIENTE MEDIO Y ÁFRICA: MERCADO POR TECNOLOGÍA, 2021-2030 (MILLONES DE USD)
- TABLA 87 RESTO DE ORIENTE MEDIO Y ÁFRICA: MERCADO POR APLICACIÓN, 2021-2030 (USD MILLONES)
- TABLA 88 AMÉRICA LATINA: MERCADO DE DRONES EN LA INDUSTRIA ENERGÉTICA, POR PAÍS, 2021-2030 (USD MILLONES)
- TABLA 89 AMÉRICA LATINA: MERCADO POR TIPO DE DRONE, 2021-2030 (USD MILLONES)
- TABLA 90 AMÉRICA LATINA: MERCADO POR TIPO DE INDUSTRIA, 2021-2030 (USD MILLONES)
- TABLA 91 AMÉRICA LATINA: MERCADO POR TECNOLOGÍA, 2021-2030 (USD MILLONES)
- TABLA 92 AMÉRICA LATINA: MERCADO POR APLICACIÓN, 2021-2030 (USD MILLONES)
- TABLA 93 BRASIL: MERCADO DE DRONES EN INDUSTRIA ENERGÉTICA, POR TIPO DE DRONES, 2021-2030 (USD MILLONES)
- TABLA 94 BRASIL: MERCADO POR TIPO DE INDUSTRIA, 2021-2030 (USD MILLONES)
- TABLA 95 BRASIL: MERCADO POR TECNOLOGÍA, 2021-2030 (USD MILLONES)
- TABLA 96 BRASIL: MERCADO POR APLICACIÓN, 2021-2030 (USD MILLONES)
- TABLA 97 RESTO DE AMÉRICA LATINA: MERCADO DE DRONES EN LA INDUSTRIA ENERGÉTICA, POR TIPO DE DRONES, 2021-2030 (USD MILLONES)
- TABLA 98 RESTO DE AMÉRICA LATINA: MERCADO POR TIPO DE INDUSTRIA, 2021-2030 (USD MILLONES)
- TABLA 99 RESTO DE AMÉRICA LATINA AMÉRICA: MERCADO POR TECNOLOGÍA, 2021-2030 (USD MILLONES)
- TABLA 100 RESTO DE AMÉRICA LATINA: MERCADO POR APLICACIÓN, 2021-2030 (USD MILLONES)
- TABLA 101 LOS ACTORES MÁS ACTIVOS EN EL MERCADO GLOBAL DE DRONES EN LA INDUSTRIA ENERGÉTICA
- TABLA 102 CONTRATOS Y ACUERDOS
- TABLA 103 FUSIONES Y ADQUISICIONES
- TABLA 104 DESARROLLO DE PRODUCTOS
- TABLA 105 EXPANSIONES E INVERSIONES
- TABLA 106 EMPRESAS CONJUNTAS Y ASOCIACIONES
-
16 Lista de Figuras
- FIGURA 1 SINOPSIS DEL MERCADO
- FIGURA 2 MERCADO GLOBAL DE DRONES EN EL SECTOR ENERGÉTICO: ANÁLISIS DEL ATRACTIVO DEL MERCADO
- FIGURA 3 ANÁLISIS DEL MERCADO GLOBAL DE DRONES EN EL SECTOR ENERGÉTICO, POR TIPO DE DRON
- FIGURA 4 ANÁLISIS DEL MERCADO GLOBAL DE DRONES EN EL SECTOR ENERGÉTICO, POR TIPO DE INDUSTRIA
- FIGURA 5 ANÁLISIS DEL MERCADO GLOBAL DE DRONES EN EL SECTOR ENERGÉTICO, POR TECNOLOGÍA
- FIGURA 5 ANÁLISIS DEL MERCADO GLOBAL DE DRONES EN EL SECTOR ENERGÉTICO, POR APLICACIÓN
- FIGURA 6 ANÁLISIS DEL MERCADO GLOBAL DE DRONES EN EL SECTOR ENERGÉTICO, POR REGIÓN
- FIGURA 7 MERCADO GLOBAL DE DRONES EN EL SECTOR ENERGÉTICO SECTOR: ESTRUCTURA DEL MERCADO
- FIGURA 8 CRITERIOS CLAVE DE COMPRA PARA PLATAFORMAS DE ENTRETENIMIENTO A BORDO
- FIGURA 9 PROCESO DE INVESTIGACIÓN DE MRFR
- FIGURA 10 AMÉRICA DEL NORTE: TAMAÑO DEL MERCADO Y CUOTA DE MERCADO, POR PAÍS, 2021-2030
- FIGURA 11 EUROPA: TAMAÑO DEL MERCADO Y CUOTA DE MERCADO, POR PAÍS, 2021-2030
- FIGURA 12 ASIA-PACÍFICO: TAMAÑO DEL MERCADO Y CUOTA DE MERCADO, POR PAÍS, 2021-2030
- FIGURA 13 ORIENTE MEDIO Y ÁFRICA: TAMAÑO DEL MERCADO Y CUOTA DE MERCADO, POR PAÍS, 2021-2030 PARTICIPACIÓN DE MERCADO, POR PAÍS, 2021-2030
- FIGURA 14 AMÉRICA LATINA: TAMAÑO DEL MERCADO Y CUOTA DE MERCADO, POR REGIÓN, 2021-2030
- FIGURA 15 RESUMEN DE LA DINÁMICA DEL MERCADO
- FIGURA 16 CRECIMIENTO DEL COMERCIO MARÍTIMO INTERNACIONAL (2021-2030)
- FIGURA 17 COMERCIO MARÍTIMO MUNDIAL, POR REGIÓN, 2017
- FIGURA 18 ANÁLISIS DEL IMPACTO DE LOS IMPULSORES: MERCADO MUNDIAL DE DRONES EN EL SECTOR ENERGÉTICO
- FIGURA 19 ANÁLISIS DEL IMPACTO DE LAS RESTRICCIONES: MERCADO MUNDIAL DE DRONES EN EL SECTOR ENERGÉTICO
- FIGURA 20 PASAJEROS DE CRUCEROS OCEÁNICOS MUNDIALES (EN MILLONES) 2009-2021
- FIGURA 21 ANÁLISIS DE LAS CINCO FUERZAS DE PORTER DEL MERCADO MUNDIAL DE DRONES EN SECTOR ENERGÉTICO
- FIGURA 22 CADENA DE SUMINISTRO: MERCADO MUNDIAL DE DRONES EN EL SECTOR ENERGÉTICO
- FIGURA 23 CUOTA DEL MERCADO MUNDIAL DE DRONES EN EL SECTOR ENERGÉTICO, POR TIPO DE DRONE, 2021 (% DE PARTICIPACIÓN)
- FIGURA 24 CUOTA DEL MERCADO MUNDIAL DE DRONES EN EL SECTOR ENERGÉTICO, POR TIPO DE INDUSTRIA, 2021 (% DE PARTICIPACIÓN)
- FIGURA 25 CUOTA DEL MERCADO MUNDIAL DE DRONES EN EL SECTOR ENERGÉTICO, POR TECNOLOGÍA, 2021 (% DE PARTICIPACIÓN)
- FIGURA 26 CUOTA DEL MERCADO MUNDIAL DE DRONES EN EL SECTOR ENERGÉTICO, POR REGIÓN, 2021 (% DE PARTICIPACIÓN)
- FIGURA 27 AMÉRICA DEL NORTE: CUOTA DEL MERCADO DE DRONES EN EL SECTOR ENERGÉTICO, POR PAÍS, 2021 (% PARTICIPACIÓN)
- FIGURA 28 EUROPA: PARTICIPACIÓN DEL MERCADO DE DRONES EN EL SECTOR ENERGÉTICO, POR PAÍS, 2021 (% PARTICIPACIÓN)
- FIGURA 29 ASIA-PACÍFICO: PARTICIPACIÓN DEL MERCADO DE DRONES EN EL SECTOR ENERGÉTICO, POR PAÍS, 2021 (% PARTICIPACIÓN)
- FIGURA 30 ORIENTE MEDIO Y ÁFRICA: PARTICIPACIÓN EN EL MERCADO DE DRONES EN EL SECTOR ENERGÉTICO, POR PAÍS, 2021 (% PARTICIPACIÓN)
- FIGURA 31 AMÉRICA LATINA: PARTICIPACIÓN EN EL MERCADO DE DRONES EN EL SECTOR ENERGÉTICO, POR PAÍS, 2021 (% PARTICIPACIÓN)
- FIGURA 32 PANEL DE COMPETENCIA: MERCADO GLOBAL DE DRONES EN EL SECTOR ENERGÉTICO
- FIGURA 33 RATIO DE MERCADO DE CAPITAL Y MATRIZ FINANCIERA
- FIGURA 34 CONTRATOS Y ACUERDOS: LA PRINCIPAL ESTRATEGIA ADOPTADA POR LOS ACTORES CLAVE EN EL MERCADO GLOBAL DE DRONES EN EL SECTOR ENERGÉTICO
- FIGURA 35 ANÁLISIS DE REFERENCIA DE LOS PRINCIPALES COMPETIDORES
- FIGURA 36 ANÁLISIS DE LA PARTICIPACIÓN DE MERCADO DE LOS PRINCIPALES FABRICANTES, 2021
Customer Stories

“This is really good guys. Excellent work on a tight deadline. I will continue to use you going forward and recommend you to others. Nice job”

“Thanks. It’s been a pleasure working with you, please use me as reference with any other Intel employees.”

“Thanks for sending the report it gives us a good global view of the Betaïne market.”

“Thank you, this will be very helpful for OQS.”

“We found the report very insightful! we found your research firm very helpful. I'm sending this email to secure our future business.”

“I am very pleased with how market segments have been defined in a relevant way for my purposes (such as "Portable Freezers & refrigerators" and "last-mile"). In general the report is well structured. Thanks very much for your efforts.”

“I have been reading the first document or the study, ,the Global HVAC and FP market report 2021 till 2026. Must say, good info! I have not gone in depth at all parts, but got a good indication of the data inside!”

“We got the report in time, we really thank you for your support in this process. I also thank to all of your team as they did a great job.”