• Cat-intel
  • MedIntelliX
  • Resources
  • About Us
  • Hero Background
    English
    Chinese
    French
    Japanese
    Korean
    German
    Spanish

    US Inorganic Salt Market Trends

    ID: MRFR/CnM/0290-HCR
    214 Pages
    Chitranshi Jaiswal
    October 2025

    Global & US Inorganic Salt Market by Application (Food & Beverages, Agriculture, Pharmaceutical, others (Construction & Chemical) and by Types (Potassium salt, Calcium salt, Sodium salt, Ammonium salt and others) Forecast 2024 to 2032

    Share:
    Download PDF ×

    We do not share your information with anyone. However, we may send you emails based on your report interest from time to time. You may contact us at any time to opt-out.

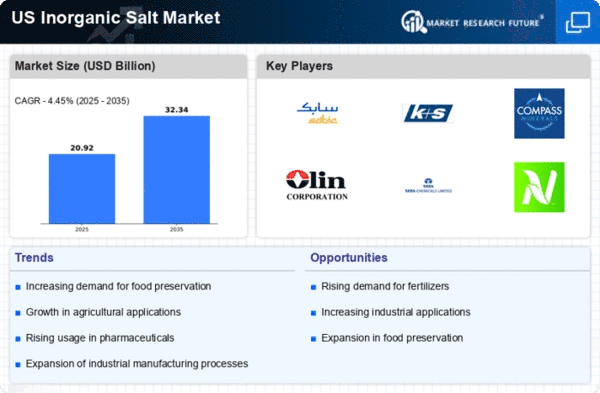
    US Inorganic Salt Market Infographic
    $ 4,950.0
    $ 5,950.0
    $ 7,250.0

    Market Trends

    Key Emerging Trends in the US Inorganic Salt Market

    Inorganic salts are vital for human and animal nutrition. Salts occur as ions in bodily fluids. Based on their composition, inorganic salts can be soluble or insoluble and appear as pellets, crystals, lumps, and granules. MRFR's extensive research predicts the worldwide inorganic salt market will develop significantly in the next years.

    The study emphasizes market drivers' usage in food, cement, agrochemicals, healthcare, and other end-user sectors. The growing use of inorganic salts in agrochemicals is another market driver. Inorganic salts will be used more in agriculture due to rising food demand and limited arable land. The body needs inorganic salts to send electrical impulses across membranes and to neighboring cells. Ions from inorganic salts regulate heart, neuron, and muscle contractions, enhancing the market.

    Inorganic salts are also employed as antacids in pharmaceuticals and as Epsom salt in cement to avoid scaling and attract moisture. These factors should boost market growth in the future.

    Inorganic salts are poisonous, according to the US Federal Explosives Law & Regulations and Code of Federal Regulations, making the market difficult. Government limitations on inorganic salt toxicity might slow industry expansion

    Key players in the market include Thermo Fisher Scientific, LobaChemie, Merck KGaA, Laxness, Rose Mill Co., Eastman Chemical, BEHN MEYER, Emerald Performance Materials, Bann Química Ltda, Arkema, Lenntech, Otsuka Chemical Co., Ltd., and GFS Chemicals, Inc. Diverse solutions and global presence help these organizations compete in the inorganic salt industry."

    Market Summary

    The US Global and US Inorganic Salt market is projected to grow from 25.75 USD Billion in 2024 to 38.12 USD Billion by 2035, indicating a robust growth trajectory.

    Key Market Trends & Highlights

    Global & US Inorganic Salt Key Trends and Highlights

    • The market is expected to experience a compound annual growth rate (CAGR) of 3.63% from 2025 to 2035.
    • By 2035, the market valuation is anticipated to reach 38.12 USD Billion, reflecting increasing demand.
    • In 2024, the market is valued at 25.75 USD Billion, highlighting its substantial size and potential.
    • Growing adoption of inorganic salts in various industries due to their versatility is a major market driver.

    Market Size & Forecast

    2024 Market Size 25.75 (USD Billion)
    2035 Market Size 38.12 (USD Billion)
    CAGR (2025 - 2035) 3.63%
    Largest Regional Market Share in 2024 US)

    Major Players

    Apple Inc (US), Microsoft Corp (US), Amazon.com Inc (US), Alphabet Inc (US), Berkshire Hathaway Inc (US), Meta Platforms Inc (US), Tesla Inc (US), Johnson & Johnson (US), Visa Inc (US), Procter & Gamble Co (US)

    Market Trends

    US Inorganic Salt Market Market Drivers

    Market Segment Insights

    Regional Insights

    Key Companies in the US Inorganic Salt Market market include

    Industry Developments

    Market Segmentation

    Report Scope

    Report Attribute/Metric Details
      Market Size   2032: Significant Value
      CAGR   Substantial CAGR (2022-2030)
      Base Year   2023
      Forecast Period   2024-2032
      Historical Data   2019 & 2020
      Forecast Units   Value (USD Million)
      Report Coverage   Revenue Forecast, Competitive Landscape, Growth Factors, and Trends
      Segments Covered   applications, types and Region
      Geographies Covered    Asia Pacific, North America, and Europe, America and Middle East & Africa
      Key Vendors   MerckMillipore, Sigma Aldrich, Fisher Scientific, Otsuka Chemical Co Ltd, MerckMillipore, Loba Chemie, , Lenntech, Arkema SA,Bann Química, Chemtura Corporation, Behn Meyer Solutia Incorporated, Emerald Performance Materials, Lanxess AG, Eastman Chemicals Co and others.
      Key Market Opportunities   The extensive usage of calcium salts, nitrates, ammonium phosphate, zinc salts and others to improve the soil nutrient content are known as the primary factors which are propelling the growth of global inorganic salts market.
      Key Market Drivers   The present definition of inorganic compounds frequently includes all the metal-containing compounds, even those found in living systems.

    Market Highlights

    Author

    Chitranshi Jaiswal
    Research Analyst Level I

    She holds an experience of about 6+ years in market research and business consulting, working under the spectrum of information communication technology, telecommunications and semiconductor domains. aarti conceptualizes and implements a scalable business strategy and provides strategic leadership to the clients. her expertise lies in market estimation, competitive intelligence, pipeline analysis, customer assessment, etc.

    Leave a Comment

    Latest Comments

    John Doe
    john@example.com

    This is a great article! Really helped me understand the topic better.

    Posted on July 23, 2025, 10:15 AM
    Jane Smith
    jane@domain.com

    Thanks for sharing this. I’ve bookmarked it for later reference.

    Posted on July 22, 2025, 7:45 PM

    FAQs

    What is the forecast period of Global & US Inorganic Salt Market research report?

    The forecast period for Global & US Inorganic Salt Market research report is 2025-2035.

    Who are the key players in the Global & US Inorganic Salt?

    The main players in the market are MerckMillipore, Sigma Aldrich, Fisher Scientific, Otsuka Chemical Co Ltd, MerckMillipore, Loba Chemie, , Lenntech, Arkema SA,Bann Química, Chemtura Corporation, Behn Meyer Solutia Incorporated, Emerald Performance Materials, Lanxess AG, Eastman Chemicals Co and others.

    Which region will lead the Global & US Inorganic Salt market?

    Global & US Inorganic Salt Market is dominated by North America region.

    What is the expected market size of the US Inorganic Salt Market in 2024?

    The US Inorganic Salt Market is expected to be valued at 24.17 billion USD in 2024.

    What is the projected market value of the US Inorganic Salt Market by 2035?

    By 2035, the US Inorganic Salt Market is projected to reach a value of 40.55 billion USD.

    What is the estimated CAGR for the US Inorganic Salt Market from 2025 to 2035?

    The expected compound annual growth rate (CAGR) for the US Inorganic Salt Market is 4.816% from 2025 to 2035.

    Which segment of the US Inorganic Salt Market holds the largest market share?

    The Sodium Salts segment is anticipated to have the largest share, valued at 9.0 billion USD in 2024.

    What are the expected market values for Magnesium Salts by 2035?

    The Magnesium Salts segment is expected to grow to 8.8 billion USD by 2035.

    Who are some of the key players in the US Inorganic Salt Market?

    Key players include Albemarle Corporation, Livent Corporation, Tata Chemicals, and BASF SE among others.

    What growth opportunities exist in the US Inorganic Salt Market?

    The market presents opportunities driven by increasing demand from agriculture and chemical industries.

    What factors could challenge the growth of the US Inorganic Salt Market?

    Challenges may arise from regulatory constraints and fluctuations in raw material prices.

    How will the Calcium Salts segment perform by 2035?

    The Calcium Salts segment is expected to grow significantly, reaching a value of 7.5 billion USD by 2035.

    What will be the expected market value of Potassium Salts in 2024?

    The Potassium Salts segment is valued at 3.0 billion USD in 2024.

    1. . EXECUTIVE’S HANDBOOK
    2. . The Top Performing Segments
    3. . Key Trends Summarized
    4. . Pricing Outlook
    5. . Strategic Insights
    6. . Who are the Key Players in the Market? SECTION II: SCOPING, METHODOLOGY AND MARKET STRUCTURE
    7. . MARKET INTRODUCTION
    8. . Definition
    9. . Report Segmentation & Scope
    10. . Regional & Country Level Coverage
    11. . Why you need this report?
    12. . RESEARCH METHODOLOGY
    13. . Research Process
    14. . Secondary Research
    15. . Data Mining & Condensation
    16. . Sources (Associations, Organizations, Magazines, Paid Databases)
    17. . Primary Research
    18. . Sample Size (Demand-Supply, Company Type, Designations, Region)
    19. . Sources
    20. . Factorial Analysis & Approach Setting
    21. . Estimation & Forecast Models
    22. . Pricing Baskets
    23. . Analyst Hours & Team SECTION III: QUALITATIVE ANALYSIS
    24. . MARKET DYNAMICS
    25. . Introduction
    26. . Growth Parameters Mapped - Drivers
    27. . Rising consumption of agricultural goods in developing countries
    28. . Increase in industrial establishments around the world
    29. . What are the challenges faced by Industry Participants?
    30. . Fluctuations in potash ore prices
    31. . Opportunities
    32. . Demand from animal feed industry
    33. . Usage in novel industries
    34. . Regulatory Update
    35. . Impact Analysis of COVID-19
    36. . Impact on Supply Chain of Potash Ores
    37. . Impact on Market Demand of Potash Ores
    38. . MARKET FACTOR ANALYSIS
    39. . Supply/Value Chain Analysis
    40. . Participants
    41. . Value Percolation Across the Chain
    42. . Integration Levels
    43. . Key Issues Addressed
    44. . Porter’s Five Forces Model
    45. . Bargaining Power of Suppliers
    46. . Bargaining Power of Buyers
    47. . Threat of New Entrants
    48. . Threat of Substitutes
    49. . Intensity of Rivalry
    50. . Pricing Scenario, By Region SECTION IV: QUANTITATIVE ANALYSIS
    51. . GLOBAL POTASH ORES MARKET, BY MINERAL EXTRACTED (USD MILLION)
    52. . Introduction
    53. . Potassium Chloride
    54. . Global Potash Ores Market Size: Market Estimates & Forecast, By Potassium Chloride, 2018-2032
    55. . Potassium Hydroxide
    56. . Global Potash Ores Market Size: Market Estimates & Forecast, By Potassium Hydroxide, 2018-2032
    57. . Sodium Chloride
    58. . Global Potash Ores Market Size: Market Estimates & Forecast, By Sodium Chloride, 2018-2032
    59. . Others
    60. . Global Potash Ores Market Size: Market Estimates & Forecast, By Others, 2018-2032
    61. . GLOBAL POTASH ORES MARKET, BY END-USE INDUSTRY (USD MILLION)
    62. . Introduction
    63. . Agriculture
    64. . Global Potash Ores Market Size: Market Estimates & Forecast, By Agriculture, 2018-2032
    65. . Metallurgy
    66. . Global Potash Ores Market Size: Market Estimates & Forecast, By Metallurgy, 2018-2032
    67. . Chemicals
    68. . Global Potash Ores Market Size: Market Estimates & Forecast, By Chemicals, 2018-2032
    69. . Others
    70. . Global Potash Ores Market Size: Market Estimates & Forecast, By Others, 2018-2032
    71. . GLOBAL POTASH ORES MARKET, BY REGION (USD MILLION)
    72. . Introduction
    73. . North America
    74. . North America Potash Ores Market Size: Market Estimates & Forecast, By Country, 2018-2032
    75. . North America Potash Ores Market Size: Market Estimates & Forecast, By Mineral Extracted, 2018-2032
    76. . North America Potash Ores Market Size: Market Estimates & Forecast, By End-Use Industry, 2018-2032
    77. . US
    78. . US Potash Ores Market Size: Market Estimates & Forecast, By Mineral Extracted, 2018-2032
    79. . US Potash Ores Market Size: Market Estimates & Forecast, By End-Use Industry, 2018-2032
    80. . Canada
    81. . Canada Potash Ores Market Size: Market Estimates & Forecast, By Mineral Extracted, 2018-2032
    82. . Canada Potash Ores Market Size: Market Estimates & Forecast, By End-Use Industry, 2018-2032
    83. . Mexico
    84. . Mexico Potash Ores Market Size: Market Estimates & Forecast, By Mineral Extracted, 2018-2032
    85. . Mexico Potash Ores Market Size: Market Estimates & Forecast, By End-Use Industry, 2018-2032
    86. . Europe
    87. . Europe Potash Ores Market Size: Market Estimates & Forecast, By Country, 2018-2032
    88. . Europe Potash Ores Market Size: Market Estimates & Forecast, By Mineral Extracted, 2018-2032
    89. . Europe Potash Ores Market Size: Market Estimates & Forecast, By End-Use Industry, 2018-2032
    90. . Germany
    91. . Germany Potash Ores Market Size: Market Estimates & Forecast, By Mineral Extracted, 2018-2032
    92. . Germany Potash Ores Market Size: Market Estimates & Forecast, By End-Use Industry, 2018-2032
    93. . France
    94. . France Potash Ores Market Size: Market Estimates & Forecast, By Mineral Extracted, 2018-2032
    95. . France Potash Ores Market Size: Market Estimates & Forecast, By End-Use Industry, 2018-2032
    96. . UK
    97. . UK Potash Ores Market Size: Market Estimates & Forecast, By Mineral Extracted, 2018-2032
    98. . UK Potash Ores Market Size: Market Estimates & Forecast, By End-Use Industry, 2018-2032
    99. . Spain
    100. . Spain Potash Ores Market Size: Market Estimates & Forecast, By Mineral Extracted, 2018-2032
    101. . Spain Potash Ores Market Size: Market Estimates & Forecast, By End-Use Industry, 2018-2032
    102. . Italy
    103. . Italy Potash Ores Market Size: Market Estimates & Forecast, By Mineral Extracted, 2018-2032
    104. . Italy Potash Ores Market Size: Market Estimates & Forecast, By End-Use Industry, 2018-2032
    105. . Rest of Europe
    106. . Rest of Europe Potash Ores Market Size: Market Estimates & Forecast, By Country, 2018-2032
    107. . Rest of Europe Potash Ores Market Size: Market Estimates & Forecast, By Mineral Extracted, 2018-2032
    108. . Rest of Europe Potash Ores Market Size: Market Estimates & Forecast, By End-Use Industry, 2018-2032
    109. . Asia-Pacific
    110. . Asia-Pacific Potash Ores Market Size: Market Estimates & Forecast, By Country, 2018-2032
    111. . Asia-Pacific Potash Ores Market Size: Market Estimates & Forecast, By Mineral Extracted, 2018-2032
    112. . Asia-Pacific Potash Ores Market Size: Market Estimates & Forecast, By End-Use Industry, 2018-2032
    113. . China
    114. . China Potash Ores Market Size: Market Estimates & Forecast, By Mineral Extracted, 2018-2032
    115. . China Potash Ores Market Size: Market Estimates & Forecast, By End-Use Industry, 2018-2032
    116. . India
    117. . India Potash Ores Market Size: Market Estimates & Forecast, By Mineral Extracted, 2018-2032
    118. . India Potash Ores Market Size: Market Estimates & Forecast, By End-Use Industry, 2018-2032
    119. . Japan
    120. . Japan Potash Ores Market Size: Market Estimates & Forecast, By Mineral Extracted, 2018-2032
    121. . Japan Potash Ores Market Size: Market Estimates & Forecast, By End-Use Industry, 2018-2032
    122. . South Korea
    123. . South Korea Potash Ores Market Size: Market Estimates & Forecast, By Mineral Extracted, 2018-2032
    124. . South Korea Potash Ores Market Size: Market Estimates & Forecast, By End-Use Industry, 2018-2032
    125. . Rest of Asia-Pacific
    126. . Rest of Asia-Pacific Potash Ores Market Size: Market Estimates & Forecast, By Country, 2018-2032
    127. . Rest of Asia-Pacific Potash Ores Market Size: Market Estimates & Forecast, By Mineral Extracted, 2018-2032
    128. . Rest of Asia-Pacific Potash Ores Market Size: Market Estimates & Forecast, By End-Use Industry, 2018-2032
    129. . Middle East & Africa
    130. . Middle East & Africa Potash Ores Market Size: Market Estimates & Forecast, By Country, 2018-2032
    131. . Middle East & Africa Potash Ores Market Size: Market Estimates & Forecast, By Mineral Extracted, 2018-2032
    132. . Middle East & Africa Potash Ores Market Size: Market Estimates & Forecast, By End-Use Industry, 2018-2032
    133. . GCC Countries
    134. . GCC Countries Potash Ores Market Size: Market Estimates & Forecast, By Mineral Extracted, 2018-2032
    135. . GCC Countries Potash Ores Market Size: Market Estimates & Forecast, By End-Use Industry, 2018-2032
    136. . South Africa
    137. . South Africa Potash Ores Market Size: Market Estimates & Forecast, By Mineral Extracted, 2018-2032
    138. . South Africa Potash Ores Market Size: Market Estimates & Forecast, By End-Use Industry, 2018-2032
    139. . Rest of Middle East & Africa
    140. . Rest of Middle East & Africa Potash Ores Market Size: Market Estimates & Forecast, By Country, 2018-2032
    141. . Rest of Middle East & Africa Potash Ores Market Size: Market Estimates & Forecast, By Mineral Extracted, 2018-2032
    142. . Rest of Middle East & Africa Potash Ores Market Size: Market Estimates & Forecast, By End-Use Industry, 2018-2032
    143. . South America
    144. . South America Potash Ores Market Size: Market Estimates & Forecast, By Country, 2018-2032
    145. . South America Potash Ores Market Size: Market Estimates & Forecast, By Mineral Extracted, 2018-2032
    146. . South America Potash Ores Market Size: Market Estimates & Forecast, By End-Use Industry, 2018-2032
    147. . Brazil
    148. . Brazil Potash Ores Market Size: Market Estimates & Forecast, By Mineral Extracted, 2018-2032
    149. . Brazil Potash Ores Market Size: Market Estimates & Forecast, By End-Use Industry, 2018-2032
    150. . Argentina
    151. . Argentina Potash Ores Market Size: Market Estimates & Forecast, By Mineral Extracted, 2018-2032
    152. . Argentina Potash Ores Market Size: Market Estimates & Forecast, By End-Use Industry, 2018-2032
    153. . Rest of South America
    154. . Rest of South America Potash Ores Market Size: Market Estimates & Forecast, By Mineral Extracted, 2018-2032
    155. . Rest of South America Potash Ores Market Size: Market Estimates & Forecast, By End-Use Industry, 2018-2032 SECTION V: COMPETITIVE ANALYSIS
    156. . COMPETITIVE LANDSCAPE
    157. . Introduction
    158. . Competition Dashboard
    159. . Company Market Share Analysis, 2022
    160. . Who are the market disruptors & innovators?
    161. . What strategies are being adopted by market leaders?
    162. . Competitive Benchmarking
    163. . The Leading Player in terms of Number of Developments in the Global Potash Ores Market
    164. . List of Key Players, By Region
    165. . Comparative Analysis: Key Players Financial
    166. . Key Developments & Growth Strategies
    167. . New Product Launch/Service Deployment
    168. . Merger & Acquisition
    169. . Joint Ventures
    170. . COMPANY PROFILES
    171. . Uralkali
    172. . Company Overview
    173. . Financial Overview
    174. . Product Offered
    175. . Key Developments
    176. . SWOT Analysis
    177. . Key Strategies
    178. . BHP Billiton Ltd.
    179. . Company Overview
    180. . Financial Overview
    181. . Product Offered
    182. . Key Developments
    183. . SWOT Analysis
    184. . Key Strategies
    185. . Eurochem
    186. . Company Overview
    187. . Financial Overview
    188. . Product Offered
    189. . Key Developments
    190. . SWOT Analysis
    191. . Key Strategies
    192. . Encanto Potash Corp.
    193. . Company Overview
    194. . Financial Overview
    195. . Product Offered
    196. . Key Developments
    197. . SWOT Analysis
    198. . Key Strategies
    199. . Israel Chemical Ltd.
    200. . Company Overview
    201. . Financial Overview
    202. . Product Offered
    203. . Key Developments
    204. . SWOT Analysis
    205. . Key Strategies
    206. . JSC Belaruskali
    207. . Company Overview
    208. . Financial Overview
    209. . Product Offered
    210. . Key Developments
    211. . SWOT Analysis
    212. . Key Strategies
    213. . K+S GmbH
    214. . Company Overview
    215. . Financial Overview
    216. . Product Offered
    217. . Key Developments
    218. . SWOT Analysis
    219. . Key Strategies
    220. . PotashCorp
    221. . Company Overview
    222. . Financial Overview
    223. . Product Offered
    224. . Key Developments
    225. . SWOT Analysis
    226. . Key Strategies
    227. . Agrium Inc.
    228. . Company Overview
    229. . Financial Overview
    230. . Product Offered
    231. . Key Developments
    232. . SWOT Analysis
    233. . Key Strategies
    234. . Elemental Minerals Ltd.
    235. . Company Overview
    236. . Financial Overview
    237. . Product Offered
    238. . Key Developments
    239. . SWOT Analysis
    240. . Key Strategies
    241. . RECOMMENDATIONS & EXPERT INSIGHTS
    242. . What is the short-term vs long-term outlook for Potash Ores Market?
    243. . Who are the players to look out for?
    244. . What will the product mix look in coming years?
    245. . MRFR OFFERINGS & TEAM
    246. . Citations & Media
    247. . Our Regional Representatives
    248. . Related Reports
    249. . Our Domain Coverage NOTE: This table of content is tentative and subject to change as the research progresses.  In section 10, each company will be profiled based on the Market Overview, Financials, Product Portfolio, Business Strategies, and Recent Developments parameters.  Please note: The financial details of the company cannot be provided if the information is not available in the public domain and or from reliable sources.   LIST OF TABLES TABLE
    250. . LIST OF ASSUMPTIONS TABLE
    251. . POTASH ORES MARKET ESTIMATES & FORECAST, BY MINERAL EXTRACTED, 2018-2032 (USD MILLION) TABLE
    252. . POTASH ORES MARKET ESTIMATES & FORECAST, BY END-USE INDUSTRY, 2018-2032 (USD MILLION) TABLE
    253. . GLOBAL POTASH ORES MARKET, BY REGION, 2018-2032 (USD MILLION) TABLE
    254. . NORTH AMERICA: POTASH ORES MARKET, BY COUNTRY, 2018-2032 (USD MILLION) TABLE
    255. . NORTH AMERICA: POTASH ORES MARKET, BY MINERAL EXTRACTED, 2018-2032 (USD MILLION) TABLE
    256. . NORTH AMERICA: POTASH ORES MARKET, BY END-USE INDUSTRY, 2018-2032 (USD MILLION) TABLE
    257. . U.S.: POTASH ORES MARKET, BY MINERAL EXTRACTED, 2018-2032 (USD MILLION) TABLE
    258. . U.S.: POTASH ORES MARKET, BY END-USE INDUSTRY, 2018-2032 (USD MILLION) TABLE
    259. . CANADA: POTASH ORES MARKET, BY MINERAL EXTRACTED, 2018-2032 (USD MILLION) TABLE
    260. . CANADA: POTASH ORES MARKET, BY END-USE INDUSTRY, 2018-2032 (USD MILLION) TABLE
    261. . MEXICO: POTASH ORES MARKET, BY MINERAL EXTRACTED, 2018-2032 (USD MILLION) TABLE
    262. . MEXICO: POTASH ORES MARKET, BY END-USE INDUSTRY, 2018-2032 (USD MILLION) TABLE
    263. . EUROPE: POTASH ORES MARKET, BY COUNTRY, 2018-2032 (USD MILLION) TABLE
    264. . EUROPE: POTASH ORES MARKET, BY MINERAL EXTRACTED, 2018-2032 (USD MILLION) TABLE
    265. . EUROPE: POTASH ORES MARKET, BY END-USE INDUSTRY, 2018-2032 (USD MILLION) TABLE
    266. . GERMANY: POTASH ORES MARKET, BY MINERAL EXTRACTED, 2018-2032 (USD MILLION) TABLE
    267. . GERMANY: POTASH ORES MARKET, BY END-USE INDUSTRY, 2018-2032 (USD MILLION) TABLE
    268. . FRANCE: POTASH ORES MARKET, BY MINERAL EXTRACTED, 2018-2032 (USD MILLION) TABLE
    269. . FRANCE: POTASH ORES MARKET, BY END-USE INDUSTRY, 2018-2032 (USD MILLION) TABLE
    270. . UK: POTASH ORES MARKET, BY MINERAL EXTRACTED, 2018-2032 (USD MILLION) TABLE
    271. . UK: POTASH ORES MARKET, BY END-USE INDUSTRY, 2018-2032 (USD MILLION) TABLE
    272. . SPAIN: POTASH ORES MARKET, BY MINERAL EXTRACTED, 2018-2032 (USD MILLION) TABLE
    273. . SPAIN: POTASH ORES MARKET, BY END-USE INDUSTRY, 2018-2032 (USD MILLION) TABLE
    274. . ITALY: POTASH ORES MARKET, BY MINERAL EXTRACTED, 2018-2032 (USD MILLION) TABLE
    275. . ITALY: POTASH ORES MARKET, BY END-USE INDUSTRY, 2018-2032 (USD MILLION) TABLE
    276. . REST OF EUROPE: POTASH ORES MARKET, BY COUNTRY, 2018-2032 (USD MILLION) TABLE
    277. . REST OF EUROPE: POTASH ORES MARKET, BY MINERAL EXTRACTED, 2018-2032 (USD MILLION) TABLE
    278. . REST OF EUROPE: POTASH ORES MARKET, BY END-USE INDUSTRY, 2018-2032 (USD MILLION) TABLE
    279. . ASIA PACIFIC: POTASH ORES MARKET, BY COUNTRY, 2018-2032 (USD MILLION) TABLE
    280. . ASIA PACIFIC: POTASH ORES MARKET, BY MINERAL EXTRACTED, 2018-2032 (USD MILLION) TABLE
    281. . ASIA PACIFIC: POTASH ORES MARKET, BY END-USE INDUSTRY, 2018-2032 (USD MILLION) TABLE
    282. . CHINA: POTASH ORES MARKET, BY MINERAL EXTRACTED, 2018-2032 (USD MILLION) TABLE
    283. . CHINA: POTASH ORES MARKET, BY END-USE INDUSTRY, 2018-2032 (USD MILLION) TABLE
    284. . INDIA: POTASH ORES MARKET, BY MINERAL EXTRACTED, 2018-2032 (USD MILLION) TABLE
    285. . INDIA: POTASH ORES MARKET, BY END-USE INDUSTRY, 2018-2032 (USD MILLION) TABLE
    286. . JAPAN: POTASH ORES MARKET, BY MINERAL EXTRACTED, 2018-2032 (USD MILLION) TABLE
    287. . JAPAN: POTASH ORES MARKET, BY END-USE INDUSTRY, 2018-2032 (USD MILLION) TABLE
    288. . SOUTH KOREA: POTASH ORES MARKET, BY MINERAL EXTRACTED, 2018-2032 (USD MILLION) TABLE
    289. . SOUTH KOREA: POTASH ORES MARKET, BY END-USE INDUSTRY, 2018-2032 (USD MILLION) TABLE
    290. . REST OF ASIA PACIFIC: POTASH ORES MARKET, BY COUNTRY, 2018-2032 (USD MILLION) TABLE
    291. . REST OF ASIA PACIFIC: POTASH ORES MARKET, BY MINERAL EXTRACTED, 2018-2032 (USD MILLION) TABLE
    292. . REST OF ASIA PACIFIC: POTASH ORES MARKET, BY END-USE INDUSTRY, 2018-2032 (USD MILLION) TABLE
    293. . MIDDLE EAST & AFRICA: POTASH ORES MARKET, BY COUNTRY, 2018-2032 (USD MILLION) TABLE
    294. . MIDDLE EAST & AFRICA: POTASH ORES MARKET, BY MINERAL EXTRACTED, 2018-2032 (USD MILLION) TABLE
    295. . MIDDLE EAST & AFRICA: POTASH ORES MARKET, BY END-USE INDUSTRY, 2018-2032 (USD MILLION) TABLE
    296. . GCC COUNTRIES: POTASH ORES MARKET, BY MINERAL EXTRACTED, 2018-2032 (USD MILLION) TABLE
    297. . GCC COUNTRIES: POTASH ORES MARKET, BY END-USE INDUSTRY, 2018-2032 (USD MILLION) TABLE
    298. . SOUTH AFRICA: POTASH ORES MARKET, BY MINERAL EXTRACTED, 2018-2032 (USD MILLION) TABLE
    299. . SOUTH AFRICA: POTASH ORES MARKET, BY END-USE INDUSTRY, 2018-2032 (USD MILLION) TABLE
    300. . REST OF MIDDLE EAST & AFRICA: POTASH ORES MARKET, BY COUNTRY, 2018-2032 (USD MILLION) TABLE
    301. . REST OF MIDDLE EAST & AFRICA: POTASH ORES MARKET, BY MINERAL EXTRACTED, 2018-2032 (USD MILLION) TABLE
    302. . REST OF MIDDLE EAST & AFRICA: POTASH ORES MARKET, BY END-USE INDUSTRY, 2018-2032 (USD MILLION) TABLE
    303. . SOUTH AMERICA: POTASH ORES MARKET, BY COUNTRY, 2018-2032 (USD MILLION) TABLE
    304. . SOUTH AMERICA: POTASH ORES MARKET, BY MINERAL EXTRACTED, 2018-2032 (USD MILLION) TABLE
    305. . SOUTH AMERICA: POTASH ORES MARKET, BY END-USE INDUSTRY, 2018-2032 (USD MILLION) TABLE
    306. . BRAZIL: POTASH ORES MARKET, BY MINERAL EXTRACTED, 2018-2032 (USD MILLION) TABLE
    307. . BRAZIL: POTASH ORES MARKET, BY END-USE INDUSTRY, 2018-2032 (USD MILLION) TABLE
    308. . ARGENTINA: POTASH ORES MARKET, BY MINERAL EXTRACTED, 2018-2032 (USD MILLION) TABLE
    309. . ARGENTINA: POTASH ORES MARKET, BY END-USE INDUSTRY, 2018-2032 (USD MILLION) TABLE
    310. . REST OF SOUTH AMERICA: POTASH ORES MARKET, BY COUNTRY, 2018-2032 (USD MILLION) TABLE
    311. . REST OF SOUTH AMERICA: POTASH ORES MARKET, BY MINERAL EXTRACTED, 2018-2032 (USD MILLION) TABLE
    312. . REST OF SOUTH AMERICA: POTASH ORES MARKET, BY END-USE INDUSTRY, 2018-2032 (USD MILLION)   LIST OF FIGURES FIGURE
    313. . MARKET SYNOPSIS FIGURE
    314. . MARKET ATTRACTIVENESS ANALYSIS: GLOBAL POTASH ORES MARKET FIGURE
    315. . GLOBAL POTASH ORES MARKET ANALYSIS BY MINERAL EXTRACTED FIGURE
    316. . GLOBAL POTASH ORES MARKET ANALYSIS BY END-USE INDUSTRY FIGURE
    317. . GLOBAL POTASH ORES MARKET ANALYSIS BY REGION FIGURE
    318. . GLOBAL POTASH ORES MARKET: MARKET STRUCTURE FIGURE
    319. . KEY BUYING CRITERIA OF POTASH ORES FIGURE
    320. . RESEARCH PROCESS OF MRFR FIGURE
    321. . NORTH AMERICA MARKET SIZE & MARKET SHARE BY COUNTRY (2023 VS 2032) FIGURE
    322. . EUROPE MARKET SIZE & MARKET SHARE BY COUNTRY (2023 VS 2032) FIGURE
    323. . ASIA-PACIFIC & MARKET SHARE BY COUNTRY (2023 VS 2032) FIGURE
    324. . MIDDLE EAST & AFRICA MARKET SIZE & MARKET SHARE BY COUNTRY (2023 VS 2032) FIGURE
    325. . SOUTH AMERICA MARKET SIZE & MARKET SHARE BY COUNTRY (2023 VS 2032) FIGURE
    326. . DROC ANALYSIS OF GLOBAL POTASH ORES MARKET FIGURE
    327. . DRIVERS IMPACT ANALYSIS: POTASH ORES MARKET FIGURE
    328. . RESTRAINTS IMPACT ANALYSIS: POTASH ORES MARKET FIGURE
    329. . SUPPLY / VALUE CHAIN: GLOBAL POTASH ORES MARKET FIGURE
    330. . GLOBAL POTASH ORES MARKET, BY MINERAL EXTRACTED, 2022 (% SHARE) FIGURE
    331. . GLOBAL POTASH ORES MARKET, BY MINERAL EXTRACTED, 2023 TO 2032 (USD MILLION) FIGURE
    332. . GLOBAL POTASH ORES MARKET, BY END-USE INDUSTRY, 2022 (% SHARE) FIGURE
    333. . GLOBAL POTASH ORES MARKET, BY END-USE INDUSTRY, 2023 TO 2032 (USD MILLION)
    334. List of Tables and Figures
      1. Table FIGURE 1. MARKET SYNOPSIS FIGURE 2. MARKET ATTRACTIVENESS ANALYSIS: GLOBAL POTASH ORES MARKET FIGURE 3. GLOBAL POTASH ORES MARKET ANALYSIS BY MINERAL EXTRACTED FIGURE 4. GLOBAL POTASH ORES MARKET ANALYSIS BY END-USE INDUSTRY FIGURE 5. GLOBAL POTASH ORES MARKET ANALYSIS BY REGION FIGURE 6. GLOBAL POTASH ORES MARKET: MARKET STRUCTURE FIGURE 7. KEY BUYING CRITERIA OF POTASH ORES FIGURE 8. RESEARCH PROCESS OF MRFR FIGURE 9. NORTH AMERICA MARKET SIZE & MARKET SHARE BY COUNTRY (2023 VS 2032) FIGURE 10. EUROPE MARKET SIZE & MARKET SHARE BY COUNTRY (2023 VS 2032) FIGURE 11. ASIA-PACIFIC & MARKET SHARE BY COUNTRY (2023 VS 2032) FIGURE 12. MIDDLE EAST & AFRICA MARKET SIZE & MARKET SHARE BY COUNTRY (2023 VS 2032) FIGURE 13. SOUTH AMERICA MARKET SIZE & MARKET SHARE BY COUNTRY (2023 VS 2032) FIGURE 14. DROC ANALYSIS OF GLOBAL POTASH ORES MARKET FIGURE 15. DRIVERS IMPACT ANALYSIS: POTASH ORES MARKET FIGURE 16. RESTRAINTS IMPACT ANALYSIS: POTASH ORES MARKET FIGURE 17. SUPPLY / VALUE CHAIN: GLOBAL POTASH ORES MARKET FIGURE 18. GLOBAL POTASH ORES MARKET, BY MINERAL EXTRACTED, 2022 (% SHARE) FIGURE 19. GLOBAL POTASH ORES MARKET, BY MINERAL EXTRACTED, 2023 TO 2032 (USD MILLION) FIGURE 20. GLOBAL POTASH ORES MARKET, BY END-USE INDUSTRY, 2022 (% SHARE) FIGURE 21. GLOBAL POTASH ORES MARKET, BY END-USE INDUSTRY, 2023 TO 2032 (USD MILLION)
    335. Table FIGURE 1. MARKET SYNOPSIS FIGURE 2. MARKET ATTRACTIVENESS ANALYSIS: GLOBAL POTASH ORES MARKET FIGURE 3. GLOBAL POTASH ORES MARKET ANALYSIS BY MINERAL EXTRACTED FIGURE 4. GLOBAL POTASH ORES MARKET ANALYSIS BY END-USE INDUSTRY FIGURE 5. GLOBAL POTASH ORES MARKET ANALYSIS BY REGION FIGURE 6. GLOBAL POTASH ORES MARKET: MARKET STRUCTURE FIGURE 7. KEY BUYING CRITERIA OF POTASH ORES FIGURE 8. RESEARCH PROCESS OF MRFR FIGURE 9. NORTH AMERICA MARKET SIZE & MARKET SHARE BY COUNTRY (2023 VS 2032) FIGURE 10. EUROPE MARKET SIZE & MARKET SHARE BY COUNTRY (2023 VS 2032) FIGURE 11. ASIA-PACIFIC & MARKET SHARE BY COUNTRY (2023 VS 2032) FIGURE 12. MIDDLE EAST & AFRICA MARKET SIZE & MARKET SHARE BY COUNTRY (2023 VS 2032) FIGURE 13. SOUTH AMERICA MARKET SIZE & MARKET SHARE BY COUNTRY (2023 VS 2032) FIGURE 14. DROC ANALYSIS OF GLOBAL POTASH ORES MARKET FIGURE 15. DRIVERS IMPACT ANALYSIS: POTASH ORES MARKET FIGURE 16. RESTRAINTS IMPACT ANALYSIS: POTASH ORES MARKET FIGURE 17. SUPPLY / VALUE CHAIN: GLOBAL POTASH ORES MARKET FIGURE 18. GLOBAL POTASH ORES MARKET, BY MINERAL EXTRACTED, 2022 (% SHARE) FIGURE 19. GLOBAL POTASH ORES MARKET, BY MINERAL EXTRACTED, 2023 TO 2032 (USD MILLION) FIGURE 20. GLOBAL POTASH ORES MARKET, BY END-USE INDUSTRY, 2022 (% SHARE) FIGURE 21. GLOBAL POTASH ORES MARKET, BY END-USE INDUSTRY, 2023 TO 2032 (USD MILLION)
    Global & US Inorganic Salt Market Segmentation

    Market Segmentation Overview

    • Detailed segmentation data will be available in the full report
    • Comprehensive analysis by multiple parameters
    • Regional and country-level breakdowns
    • Market size forecasts by segment
    Infographic

    Free Sample Request

    Kindly complete the form below to receive a free sample of this Report

    Get Free Sample

    Customer Strories

    “I am very pleased with how market segments have been defined in a relevant way for my purposes (such as "Portable Freezers & refrigerators" and "last-mile"). In general the report is well structured. Thanks very much for your efforts.”

    Victoria Milne

    Founder
    Case Study
    Chemicals and Materials