• Cat-intel
  • MedIntelliX
  • Resources
  • About Us
  • Hero Background
    English
    Chinese
    French
    Japanese
    Korean
    German
    Spanish

    Liquid packaging market Analysis

    ID: MRFR/PNT/9667-CR
    136 Pages
    Snehal Singh
    July 2025

    Liquid Packaging Market Research Report Information by Packaging Type (Flexible Liquid Packaging, Rigid Liquid Packaging(Cartons, Paperboard, Plastics PET bottles, Others)), By Material Type (Paperboard, Plastics, Glass, Metal), By End-Use (Beverage, Personal Care Cosmetic, Pharmaceutical, Household, Industrial), and Region (North America, Europe, Asia-Pacific, South America, Middle East & ...

    Share:
    Download PDF ×

    We do not share your information with anyone. However, we may send you emails based on your report interest from time to time. You may contact us at any time to opt-out.

    Liquid packaging market Infographic
    $ 4,950.0
    $ 5,950.0
    $ 7,250.0

    Market Analysis

    In-depth Analysis of Liquid packaging market Industry Landscape

    The liquid packaging market is a dynamic and ever-evolving sector driven by various factors that shape its growth and direction. One key aspect influencing market dynamics is the constant innovation in packaging materials and technologies. Manufacturers are continuously exploring new materials that offer enhanced durability, sustainability, and cost-effectiveness. This drive for innovation is fueled by consumer demands for more convenient and eco-friendly packaging solutions.

    Moreover, changing consumer lifestyles and preferences play a significant role in shaping the liquid packaging market. With an increasing focus on health and wellness, there is a growing demand for packaging that preserves the freshness and quality of liquid products such as juices, dairy products, and beverages. Consumers are also seeking packaging options that are easy to use and dispose of, leading to the development of convenient packaging formats such as pouches and single-serve containers.

    Global economic factors also impact the dynamics of the liquid packaging market. Economic fluctuations, currency exchange rates, and trade policies can influence production costs, supply chain dynamics, and market demand. Additionally, geopolitical tensions and trade disputes between countries can disrupt supply chains and affect market stability.

    Environmental concerns are another key driver shaping the liquid packaging market dynamics. With increasing awareness about plastic pollution and its environmental impact, there is a growing demand for sustainable packaging solutions. This has led to a surge in the adoption of eco-friendly materials such as bio-based plastics, recyclable materials, and compostable packaging options. Governments and regulatory bodies are also implementing stringent regulations and policies to promote sustainable packaging practices, further driving market dynamics.

    Furthermore, technological advancements are revolutionizing the liquid packaging industry. Automation, robotics, and advanced manufacturing processes are improving production efficiency, reducing costs, and enhancing product quality. Smart packaging technologies incorporating sensors and digital capabilities are also gaining traction, offering benefits such as real-time tracking, tamper-evidence, and interactive consumer engagement.

    The competitive landscape of the liquid packaging market is characterized by intense rivalry among key players. Companies are striving to differentiate their products through branding, product innovation, and strategic partnerships. Mergers and acquisitions are common strategies employed by market players to expand their market presence, enhance their product portfolios, and gain a competitive edge.

    Regional factors also influence market dynamics in the liquid packaging industry. Demographic trends, consumer preferences, and cultural factors vary across different regions, leading to diverse market conditions and requirements. Emerging economies are witnessing rapid urbanization, changing consumption patterns, and a growing middle-class population, driving demand for packaged liquid products and innovative packaging solutions.

    Market Summary

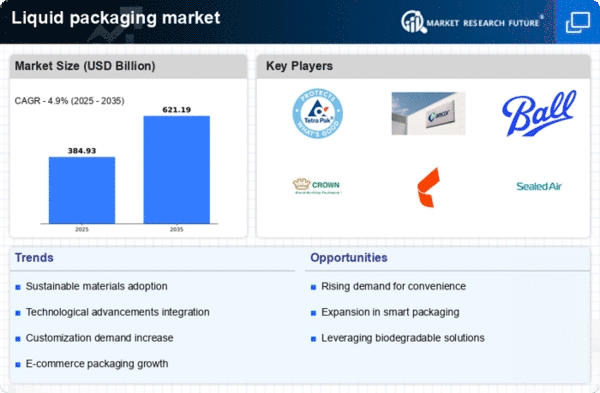
    The Global Liquid Packaging Market was valued at USD 366.95 Billion in 2024 and is projected to grow from USD 384.94 Billion in 2025 to USD 621.19 Billion by 2035, with a CAGR of 4.90% during the forecast period. Key drivers include increasing demand for packaged beverages, urbanization, and technological advancements in packaging materials. The Asia-Pacific region dominated the market in 2022, accounting for 45.80% of the share, with China leading in market share and India being the fastest-growing market.

    Key Market Trends & Highlights

    The liquid packaging market is experiencing significant growth driven by consumer preferences and technological advancements.

    • Market Size in 2024: USD 366.95 Billion
    • Projected Market Size by 2035: USD 621.19 Billion
    • CAGR from 2025 to 2035: 4.90%
    • Asia-Pacific Market Share in 2022: 45.80%

    Market Size & Forecast

    2024 Market Size USD 366.95 Billion
    2035 Market Size USD 621.19 Billion
    CAGR (2025-2035) 4.90%
    2034 Projected Market Size USD 592.16 Billion
    Largest Regional Market Share in 2022 Asia-Pacific (45.80%)

    Major Players

    Key players include Constantia Flexibles, Tetra Laval, Smurfit Kappa Group PLC, Berry Global Group INC., Gerresheimer AG, Sig Combibloc Group AG, Goglio S.P.A., Proampac LLC, Reynolds Group Holdings LTD., Amcor PLC, Mondi PLC, Sealed Air Corporation, Sonoco Products Company.

    Market Trends

    The Global Liquid Packaging Market is poised for robust growth, driven by increasing consumer demand for sustainable packaging solutions and innovations in material technology.

    U.S. Department of Commerce

    Liquid packaging market Market Drivers

    Sustainability Initiatives

    The Global Liquid Packaging Market Industry is increasingly influenced by sustainability initiatives. As consumers become more environmentally conscious, companies are adopting eco-friendly packaging solutions. This shift is evident in the growing demand for biodegradable and recyclable materials. For instance, major beverage companies are transitioning to plant-based plastics, which could significantly reduce carbon footprints. The industry's commitment to sustainability is projected to drive market growth, with the market expected to reach 348 USD Billion in 2024. This trend aligns with global efforts to reduce plastic waste and promote circular economy practices.

    Market Segment Insights

    Liquid Packaging

    Based on packaging type, we have covered the following segments: Flexible Liquid Packaging, and Rigid Liquid Packaging. Further Rigid Liquid Packaging include Cartons, Paperboard, Plastics PET bottles, Others. The Rigid Liquid Packaging segment dominated the global market in 2024, while the Flexible Liquid Packaging segment is projected to be the fastest–growing segment during the forecast period. Rigid liquid packaging refers to the use of durable, non-flexible containers to hold liquid products. Typically made from materials like glass, plastic, or metal, these containers provide robust protection for liquids, ensuring product integrity during transportation and storage.

    The rigidity of these containers prevents leaks or contamination, and materials like glass offer superior impermeability, preserving the contents and maintaining their original quality. 

    Rigid liquid packaging is particularly important in industries where product safety and preservation are critical, such as beverages, pharmaceuticals, and food products.The applications of rigid liquid packaging are widespread, with glass bottles commonly used for beverages like alcoholic and non-alcoholic drinks, as they help preserve flavour and carbonation. Metal cans are frequently used for packaging liquids such as soups, sauces, and juices, thanks to their ability to extend shelf life. 

    Additionally, the pharmaceutical industry relies on rigid containers to protect medicinal liquids and ensure precise dosing. The demand for rigid liquid packaging is driven by several factors, including the need for higher product integrity, extended shelf life, and the growing consumer preference for recyclable materials, as many rigid containers are made from materials like glass that can be reused.

    Liquid Packaging

    Based on material type, we have covered the following segments: Paperboard, Plastics, Glass, and Metal. The Paperboard segment dominated the global market in 2024, while the Paperboard segment is projected to be the fastest–growing segment during the forecast period. Paperboard is a thick, paper-based material that is widely used in various applications due to its strength, versatility, and sustainability. Generally thicker than standard paper, paperboard is characterized by its rigidity and foldability, making it ideal for packaging and printing purposes. 

    According to ISO standards, paperboard is defined as paper with a grammage above 250 g/m², though there are exceptions to this classification. Paperboard plays a crucial role in the packaging industry, serving as the primary material for products such as folding cartons, rigid boxes, and corrugated boxes. Its applications extend beyond packaging; it is also used in manufacturing items like book covers, postcards, and even sculptures, owing to its ability to be easily cut and formed. 

    The demand for paperboard packaging is significantly driven by its sustainability and recyclability, aligning with the growing consumer preference for eco-friendly products. Increasing awareness about environmental issues has led consumers and businesses to favour biodegradable and recyclable packaging options, boosting the demand for paperboard. The rise of online shopping has heightened the need for protective and visually appealing packaging, with paperboard offering an effective solution for shipping and branding. Advancements in printing technologies have enabled brands to utilize paperboard for creative packaging designs, enhancing product appeal and consumer engagement.

    Liquid Packaging

    By end-use, market is segmented into: Beverage, Personal Care Cosmetic, Pharmaceutical, Household, and Industrial. The Beverage segment dominated the global market in 2024, while the Household segment is projected to be the fastest–growing segment during the forecast period. The Beverage sector is a pivotal driver of the liquid packaging market, necessitating diverse and efficient packaging solutions to preserve product quality, extend shelf life, and enhance consumer convenience. 

    Packaging solutions in this sector encompass containers for beverages, dairy products, sauces, dressings, and soups, among others. Innovations in packaging materials and processes, such as the development of eco-friendly cartons and tamper-proof seals, enhance product safety and appeal. There is a growing consumer preference for environmentally friendly packaging, prompting companies to adopt biodegradable and recyclable materials. Packaging that offers ease of use, portability, and reseal ability aligns with modern consumer lifestyles.

    Get more detailed insights about Liquid Packaging Market Research Report – Forecast Till 2035

    Regional Insights

    Based on the Region, the global Liquid Packaging is segmented into North America, Europe, Asia-Pacific, South America and Middle East & Africa. The Asia-Pacific dominated the global market in 2024, while the Asia Pacific is projected to be the fastest–growing segment during the forecast period. Major demand factors driving the Asia-Pacific market are the Asia-Pacific (APAC) market consist of China, India, Japan, South Korea, Thailand, Indonesia, and Rest of Asia-Pacific. The Asia Pacific liquid packaging market is experiencing significant growth, driven by factors such as increasing demand for sustainable packaging solutions, rapid industrialization, and a burgeoning middle-class population.

    In March 2018, Constantia Flexibles Group expanded its presence in the region by acquiring a majority stake in India's Creative Polypack, aiming to enhance its flexible packaging offerings. 

    Additionally, in October 2023, Charoen Pokphand Foods Public Company partnered with SCG Packaging PCL and SCG Chemicals to launch the Green Packaging Initiative in Thailand, focusing on developing environmentally friendly food packaging solutions. The Asia Pacific sustainable packaging market is projected to register a high compound annual growth rate (CAGR) 2032, driven by government initiatives promoting eco-friendly packaging to address rising plastic waste concerns. 

    Leading companies such as Amcor Ltd., Berry Plastics Corporation, Mondi Group, Sonoco Products Company, and Rengo Co. Ltd. are actively investing in the region, contributing to the market's expansion. These developments underscore the dynamic nature of the Asia Pacific liquid packaging market, with strategic acquisitions, partnerships, and a focus on sustainability driving its growth.

    FIGURE 3: LIQUID PACKAGING MARKET VALUE BY REGION 2024 AND 2035 (USD BILLION)

    LIQUID PACKAGING MARKET VALUE BY REGION 2024 AND 2035

    Source: Secondary Research, Primary Research, MRFR Database, and Analyst Review

    Further, the countries considered in the scope of the Application Tracking System Market are the US, Canada, Mexico, Belgium, Germany, France, Russia, Spain, Italy, Rest of Europe, China, India, Japan, South Korea, Malaysia, Thailand, Indonesia, Rest of Asia-Pacific, GCC Countries, South Africa, Rest of MEA, Brazil, Argentina, Rest of South America and others.

    Key Players and Competitive Insights

    Many global, regional, and local vendors characterize the Liquid Packaging Market. The market is highly competitive, with all the players competing to gain market share. Intense competition, rapid advances in technology, frequent changes in government policies, and environmental regulations are key factors that confront market growth. The vendors compete based on cost, product quality, reliability, and government regulations. Vendors must provide cost-efficient, high-quality products to survive and succeed in an intensely competitive market.

    The major competitors in the market are Amcor Plc, Sealed Air Corporation, Mondi Plc, UFLEX Limited, Berry Global Group, Inc, International Paper Company, Tetra Pak International S.A, Smurfit Kappa Group / Smurfit Westrock, DS Smith Plc, Sig COMBIBLOC Group Ag are among others. The Liquid Packaging Market is a consolidated market due to increasing competition, acquisitions, mergers and other strategic market developments and decisions to improve operational effectiveness.

    Key Companies in the Liquid packaging market market include

    Industry Developments

    January 2025: Berry Global has completed successful trials of its award-winning high-performance Entour™ polyethylene (PE) lamination films on a newly commissioned conversion line from German converter equipment specialist B&B Verpackungstechnik GmbH.

    November 2024: Smurfit Westrock is proud to announce the launch of its latest pioneering innovation, the EasySplit Bag-in-Box® design which was specifically developed to meet the upcoming requirements of the Packaging and Packaging Waste Regulation (PPWR).

    October 2024: Tetra Pak and Lactalis have unveiled a carton package that uses certified recycled polymers linked to used beverage cartons, marking a first for the beverage carton industry and a significant step towards a circular economy.

    September 2023: International Paper announced the opening of its newest state-of-the-art corrugated packaging facility in Atglen, PA. The new $100 million facility is providing more than 100 manufacturing jobs to Atglen and the surrounding communities.

    Liquid Packaging Market Segmentation

    Liquid Packaging by Packaging Type Outlook

    • Flexible Liquid Packaging
    • Rigid Liquid Packaging
      • Cartons
      • Paperboard
      • Plastics PET bottles
      • Others

    Liquid Packaging by Material Type Outlook

    • Paperboard
    • Plastics
    • Glass
    • Metal

    Liquid Packaging by End-Use Outlook

    • Beverage
    • Personal Care Cosmetic
    • Pharmaceutical
    • Household
    • Industrial

    Liquid Packaging Regional Outlook

    • North America
      • US
      • Canada
      • Mexico
    • Europe
      • Germany
      • France
      • Russia
      • Italy
      • Spain
      • Rest of Europe
    • Asia-Pacific
      • China
      • India
      • Japan
      • South Korea
      • Malaysia
      • Thailand
      • Indonesia
      • Rest of Asia-Pacific
    • South America
      • Brazil
      • Argentina
      • Rest of South America
    • Middle East & Africa
      • GCC Countries
      • South Africa
      • Rest of MEA

    Future Outlook

    Liquid packaging market Future Outlook

    The Global Liquid Packaging Market is projected to grow at a 4.90% CAGR from 2025 to 2035, driven by sustainability trends, technological advancements, and increasing demand for convenience packaging.

    New opportunities lie in:

    • Invest in biodegradable packaging solutions to meet rising consumer demand for eco-friendly products.
    • Leverage smart packaging technologies to enhance product tracking and consumer engagement.
    • Expand into emerging markets with tailored packaging solutions for local beverage industries.

    By 2035, the Liquid Packaging Market is expected to achieve substantial growth, reflecting evolving consumer preferences and technological innovations.

    Market Segmentation

    Regional Outlook

    • US
    • Canada
    • Mexico

    Liquid Packaging Regional Outlook

    • US
    • Canada
    • Mexico

    Liquid Packaging by End-Use Outlook

    • Beverage
    • Personal Care Cosmetic
    • Pharmaceutical
    • Household
    • Industrial

    Liquid Packaging by Material Type Outlook

    • Paperboard
    • Plastics
    • Glass
    • Metal

    Liquid Packaging by Packaging Type Outlook

    • Cartons
    • Paperboard
    • Plastics PET bottles
    • Others

    Report Scope

    Report Attribute/Metric

    Details

    Market Size 2024

    USD 348.0 Billion

    Market Size 2025

    USD 363.6 Billion

    Market Size 2035

    621.19

    Compound Annual Growth Rate (CAGR)

    4.90% (2025 - 2035)

    Base Year

    2024

    Forecast Period

    2025 - 2035

    Historical Data

    2019-2023

    Forecast Units

    Value (USD Billion)

    Report Coverage

    Revenue Forecast, Competitive Landscape, Growth Factors, and Trends

    Segments Covered

    By Packaging Type, By Material Type, By End-Use

    Geographies Covered

    North America, Europe, Asia Pacific, South America, Middle East & Africa

    Countries Covered

    The US, Canada, Mexico, Belgium, Germany, France, Russia, Spain, Italy, Rest of Europe, China, India, Japan, South Korea, Malaysia, Thailand, Indonesia, Rest of Asia-Pacific, GCC Countries, South Africa, Rest of MEA, Brazil, Argentina, Rest of South America

    Key Companies Profiled

    Amcor Plc, Sealed Air Corporation, Mondi Plc, UFLEX Limited, Berry Global Group, Inc, International Paper Company, Tetra Pak International S.A, Smurfit Kappa Group / Smurfit Westrock, DS Smith Plc, Sig COMBIBLOC Group Ag

    Key Market Opportunities

    ·         Rising Demand for Sustainable and Eco-Friendly Packaging

    Key Market Dynamics

    ·         Rising Demand for Packaged Beverages

    ·         Advancements in Packaging Technologies

    Market Highlights

    Author

    Snehal Singh
    Assistant Manager - Research

    She holds an experience of about 6+ years in market research and business consulting, working under the spectrum of information communication technology, telecommunications and semiconductor domains. aarti conceptualizes and implements a scalable business strategy and provides strategic leadership to the clients. her expertise lies in market estimation, competitive intelligence, pipeline analysis, customer assessment, etc.

    Leave a Comment

    Latest Comments

    John Doe
    john@example.com

    This is a great article! Really helped me understand the topic better.

    Posted on July 23, 2025, 10:15 AM
    Jane Smith
    jane@domain.com

    Thanks for sharing this. I’ve bookmarked it for later reference.

    Posted on July 22, 2025, 7:45 PM

    FAQs

    How much is the Liquid Packaging Market?

    USD 348.0 Billion is the Liquid Packaging Market in 2024

    Which Packaging Type holds the largest market share?

    Liquid packaging market is expected to grow with a CAGR of 4.9% in the period 2025-2035

    Which region holds the largest market share in the Liquid Packaging Market?

    Asia-Pacific holds the largest market share in the Liquid Packaging Market.

    Who are the prominent players in the Liquid Packaging Market?

    Amcor Plc, Sealed Air Corporation, Mondi Plc, UFLEX Limited, Berry Global Group, Inc, International Paper Company, Tetra Pak International S.A, Smurfit Kappa Group / Smurfit Westrock, DS Smith Plc, Sig COMBIBLOC Group Ag are prominent players in the Liquid Packaging Market.

    Which Material Type segment led the Liquid Packaging Market?

    The Plastics segment dominated the market in 2024.

    1. Table of Contents
    2. Executive Summary
    3. Market Introduction
      1. DEFINITION
      2. Scope of the Study
      3. RESEARCH OBJECTIVE
      4. MARKET STRUCTURE
    4. Research Methodology
      1. OVERVIEW
      2. DATA FLOW
        1. DATA MINING PROCESS
      3. PURCHASED DATABASE:
      4. SECONDARY SOURCES:
        1. SECONDARY RESEARCH DATA FLOW:
      5. PRIMARY RESEARCH:
        1. PRIMARY RESEARCH DATA FLOW:
        2. PRIMARY RESEARCH: NUMBER OF INTERVIEWS CONDUCTED
        3. PRIMARY RESEARCH: REGIONAL COVERAGE
      6. APPROACHES FOR MARKET SIZE ESTIMATION:
        1. REVENUE ANALYSIS APPROACH
      7. DATA FORECASTING
        1. DATA FORECASTING TECHNIQUE
      8. DATA MODELING
        1. MICROECONOMIC FACTOR ANALYSIS:
        2. DATA MODELING:
      9. TEAMS AND ANALYST CONTRIBUTION
    5. MARKET DYNAMICS
      1. INTRODUCTION
      2. DRIVERS
        1. RISING DEMAND FOR PACKAGED BEVERAGES
        2. ADVANCEMENTS IN PACKAGING TECHNOLOGIES
        3. DRIVERS IMPACT ANALYSIS
      3. RESTRAINT
        1. ENVIRONMENTAL CONCERNS AND REGULATORY RESTRICTIONS
        2. RESTRAINT IMPACT ANALYSIS
      4. OPPORTUNITY
        1. RISING DEMAND FOR SUSTAINABLE AND ECO-FRIENDLY PACKAGING
      5. COVID-19 IMPACT ANALYSIS
        1. IMPACT ON OVERALL PACKAGING INDUSTRY
        2. IMPACT ON SUPPLY CHAIN
        3. IMPACT ON MARKET DEMAND
        4. IMPACT ON PRICING
    6. MARKET FACTOR ANALYSIS
      1. SUPPLY CHAIN ANALYSIS
        1. RAW COMPONENT/MATERIAL SUPPLY
        2. MANUFACTURE
        3. DISTRIBUTION
        4. END-USE
      2. PORTER’S FIVE FORCES MODEL
        1. THREAT OF NEW ENTRANTS
        2. BARGAINING POWER OF SUPPLIERS
        3. THREAT OF SUBSTITUTES
        4. BARGAINING POWER OF BUYERS
        5. INTENSITY OF RIVALRY
    7. GLOBAL LIQUID PACKAGING MARKET, BY PACKAGING TYPE
      1. INTRODUCTION
      2. FLEXIBLE LIQUID PACKAGING
      3. RIGID LIQUID PACKAGING
    8. GLOBAL LIQUID PACKAGING MARKET, BY MATERIAL TYPE
      1. INTRODUCTION
      2. PAPERBOARD
      3. PLASTIC
      4. GLASS
      5. METAL
    9. GLOBAL LIQUID PACKAGING MARKET, BY END-USE
      1. INTRODUCTION
      2. BEVERAGE
      3. PERSONAL CARE AND COSMETICS
      4. PHARMACEUTICALS
      5. HOUSEHOLD
      6. INDUSTRIAL
    10. GLOBAL LIQUID PACKAGING MARKET, BY REGION
      1. OVERVIEW
      2. NORTH AMERICA
        1. US
        2. CANADA
        3. MEXICO
      3. EUROPE
        1. GERMANY
        2. FRANCE
        3. RUSSIA
        4. ITALY
        5. SPAIN
        6. REST OF EUROPE
      4. ASIA-PACIFIC
        1. CHINA
        2. INDIA
        3. JAPAN
        4. SOUTH KOREA
        5. MALAYSIA
        6. THAILAND
        7. INDONESIA
        8. REST OF ASIA-PACIFIC
      5. MIDDLE EAST & AFRICA (MEA)
        1. GCC COUNTRIES
        2. SOUTH AFRICA
        3. REST OF MEA
      6. SOUTH AMERICA
        1. BRAZIL
        2. ARGENTINA
        3. REST OF SOUTH AMERICA
    11. Competitive Landscape
      1. INTRODUCTION
      2. MARKET SHARE ANALYSIS, 2024
      3. COMPETITOR DASHBOARD
      4. KEY DEVELOPMENTS & GROWTH STRATEGIES
        1. PRODUCT LAUNCH
        2. ACQUISITION
    12. COMPANY PROFILES
      1. AMCOR PLC
        1. COMPANY OVERVIEW
        2. FINANCIAL OVERVIEW
        3. PRODUCTS OFFERED
        4. KEY DEVELOPMENTS
        5. SWOT ANALYSIS
        6. KEY STRATEGY
      2. SEALED AIR CORPORATION
        1. COMPANY OVERVIEW
        2. FINANCIAL OVERVIEW
        3. PRODUCTS OFFERED
        4. KEY DEVELOPMENTS
        5. SWOT ANALYSIS
        6. KEY STRATEGIES
      3. MONDI PLC
        1. COMPANY OVERVIEW
        2. FINANCIAL OVERVIEW
        3. PRODUCTS OFFERED
        4. KEY DEVELOPMENTS
        5. SWOT ANALYSIS
        6. KEY STRATEGIES
      4. UFLEX LIMITED
        1. COMPANY OVERVIEW
        2. FINANCIAL OVERVIEW
        3. PRODUCTS OFFERED
        4. KEY DEVELOPMENTS
        5. SWOT ANALYSIS
        6. KEY STRATEGIES
      5. BERRY GLOBAL GROUP, INC.
        1. COMPANY OVERVIEW
        2. FINANCIAL OVERVIEW
        3. PRODUCTS OFFERED
        4. KEY DEVELOPMENTS
        5. SWOT ANALYSIS
        6. KEY STRATEGIES
      6. INTERNATIONAL PAPER COMPANY
        1. COMPANY OVERVIEW
        2. FINANCIAL OVERVIEW
        3. PRODUCTS OFFERED
        4. KEY DEVELOPMENTS
        5. SWOT ANALYSIS
        6. KEY STRATEGIES
      7. TETRA PAK INTERNATIONAL S.A.
        1. COMPANY OVERVIEW
        2. PRODUCTS OFFERED
        3. KEY DEVELOPMENTS
        4. SWOT ANALYSIS
        5. KEY STRATEGIES
      8. SMURFIT KAPPA GROUP / SMURFIT WESTROCK
        1. COMPANY OVERVIEW
        2. FINANCIAL OVERVIEW
        3. PRODUCTS OFFERED
        4. KEY DEVELOPMENTS
        5. SWOT ANALYSIS
        6. KEY STRATEGIES
      9. DS SMITH PLC
        1. COMPANY OVERVIEW
        2. PRODUCTS OFFERED
        3. KEY DEVELOPMENTS
        4. SWOT ANALYSIS
        5. KEY STRATEGIES
      10. SIG COMBIBLOC GROUP AG
        1. COMPANY OVERVIEW
        2. PRODUCTS OFFERED
        3. KEY DEVELOPMENTS
        4. SWOT ANALYSIS
    13. List of Tables and Figures
      1. 11.10.5 KEY STRATEGIES LIST OF TABLES
      2. TABLE 1 QFD MODELING FOR MARKET SHARE ASSESSMENT
      3. TABLE 2 GLOBAL LIQUID PACKAGING MARKET, BY PACKAGING TYPE, 2019-2035 (USD BILLION)
      4. TABLE 3 GLOBAL LIQUID PACKAGING MARKET, BY RIGID LIQUID PACKAGING, 2019-2035 (USD BILLION)
      5. TABLE 4 GLOBAL LIQUID PACKAGING MARKET, BY MATERIAL TYPE, 2019-2035 (USD BILLION)
      6. TABLE 5 GLOBAL LIQUID PACKAGING MARKET, BY END-USE, 2019-2035 (USD BILLION)
      7. TABLE 6 GLOBAL LIQUID PACKAGING MARKET, BY REGION, 2019-2035 (USD BILLION)
      8. TABLE 7 NORTH AMERICA: LIQUID PACKAGING MARKET, BY COUNTRY, 2019-2035 (USD BILLION)
      9. TABLE 8 NORTH AMERICA: LIQUID PACKAGING MARKET, BY PACKAGING TYPE, 2019-2035 (USD BILLION)
      10. TABLE 9 NORTH AMERICA: LIQUID PACKAGING MARKET, BY RIGID LIQUID PACKAGING, 2019-2035 (USD BILLION)
      11. TABLE 10 NORTH AMERICA: LIQUID PACKAGING MARKET, BY MATERIAL TYPE, 2019-2035 (USD BILLION)
      12. TABLE 11 NORTH AMERICA: LIQUID PACKAGING MARKET, BY END-USE, 2019-2035 (USD BILLION)
      13. TABLE 12 US: LIQUID PACKAGING MARKET, BY PACKAGING TYPE, 2019-2035 (USD BILLION)
      14. TABLE 13 US: LIQUID PACKAGING MARKET, BY RIGID LIQUID PACKAGING, 2019-2035 (USD BILLION)
      15. TABLE 14 US: LIQUID PACKAGING MARKET, BY MATERIAL TYPE, 2019-2035 (USD BILLION)
      16. TABLE 15 US: LIQUID PACKAGING MARKET, BY END-USE, 2019-2035 (USD BILLION)
      17. TABLE 16 CANADA: LIQUID PACKAGING MARKET, BY PACKAGING TYPE, 2019-2035 (USD BILLION)
      18. TABLE 17 CANADA: LIQUID PACKAGING MARKET, BY RIGID LIQUID PACKAGING, 2019-2035 (USD BILLION)
      19. TABLE 18 CANADA: LIQUID PACKAGING MARKET, BY MATERIAL TYPE, 2019-2035 (USD BILLION)
      20. TABLE 19 CANADA: LIQUID PACKAGING MARKET, BY END-USE, 2019-2035 (USD BILLION)
      21. TABLE 20 MEXICO: LIQUID PACKAGING MARKET, BY PACKAGING TYPE, 2019-2035 (USD BILLION)
      22. TABLE 21 MEXICO: LIQUID PACKAGING MARKET, BY RIGID LIQUID PACKAGING, 2019-2035 (USD BILLION)
      23. TABLE 22 MEXICO: LIQUID PACKAGING MARKET, BY MATERIAL TYPE, 2019-2035 (USD BILLION)
      24. TABLE 23 MEXICO: LIQUID PACKAGING MARKET, BY END-USE, 2019-2035 (USD BILLION)
      25. TABLE 24 EUROPE: LIQUID PACKAGING MARKET, BY COUNTRY, 2019-2035 (USD BILLION)
      26. TABLE 25 EUROPE: LIQUID PACKAGING MARKET, BY PACKAGING TYPE, 2019-2035 (USD BILLION)
      27. TABLE 26 EUROPE: LIQUID PACKAGING MARKET, BY RIGID LIQUID PACKAGING, 2019-2035 (USD BILLION)
      28. TABLE 27 EUROPE: LIQUID PACKAGING MARKET, BY MATERIAL TYPE, 2019-2035 (USD BILLION)
      29. TABLE 28 EUROPE: LIQUID PACKAGING MARKET, BY END-USE, 2019-2035 (USD BILLION)
      30. TABLE 29 GERMANY: LIQUID PACKAGING MARKET, BY PACKAGING TYPE, 2019-2035 (USD BILLION)
      31. TABLE 30 GERMANY: LIQUID PACKAGING MARKET, BY RIGID LIQUID PACKAGING, 2019-2035 (USD BILLION)
      32. TABLE 31 GERMANY: LIQUID PACKAGING MARKET, BY MATERIAL TYPE, 2019-2035 (USD BILLION)
      33. TABLE 32 GERMANY: LIQUID PACKAGING MARKET, BY END-USE, 2019-2035 (USD BILLION)
      34. TABLE 33 FRANCE: LIQUID PACKAGING MARKET, BY PACKAGING TYPE, 2019-2035 (USD BILLION)
      35. TABLE 34 FRANCE: LIQUID PACKAGING MARKET, BY RIGID LIQUID PACKAGING, 2019-2035 (USD BILLION)
      36. TABLE 35 FRANCE: LIQUID PACKAGING MARKET, BY MATERIAL TYPE, 2019-2035 (USD BILLION)
      37. TABLE 36 FRANCE: LIQUID PACKAGING MARKET, BY END-USE, 2019-2035 (USD BILLION)
      38. TABLE 37 RUSSIA: LIQUID PACKAGING MARKET, BY PACKAGING TYPE, 2019-2035 (USD BILLION)
      39. TABLE 38 RUSSIA: LIQUID PACKAGING MARKET, BY RIGID LIQUID PACKAGING, 2019-2035 (USD BILLION)
      40. TABLE 39 RUSSIA: LIQUID PACKAGING MARKET, BY MATERIAL TYPE, 2019-2035 (USD BILLION)
      41. TABLE 40 RUSSIA: LIQUID PACKAGING MARKET, BY END-USE, 2019-2035 (USD BILLION)
      42. TABLE 41 ITALY: LIQUID PACKAGING MARKET, BY PACKAGING TYPE, 2019-2035 (USD BILLION)
      43. TABLE 42 ITALY: LIQUID PACKAGING MARKET, BY RIGID LIQUID PACKAGING, 2019-2035 (USD BILLION)
      44. TABLE 43 ITALY: LIQUID PACKAGING MARKET, BY MATERIAL TYPE, 2019-2035 (USD BILLION)
      45. TABLE 44 ITALY: LIQUID PACKAGING MARKET, BY END-USE, 2019-2035 (USD BILLION)
      46. TABLE 45 SPAIN: LIQUID PACKAGING MARKET, BY PACKAGING TYPE, 2019-2035 (USD BILLION)
      47. TABLE 46 SPAIN: LIQUID PACKAGING MARKET, BY RIGID LIQUID PACKAGING, 2019-2035 (USD BILLION)
      48. TABLE 47 SPAIN: LIQUID PACKAGING MARKET, BY MATERIAL TYPE, 2019-2035 (USD BILLION)
      49. TABLE 48 SPAIN: LIQUID PACKAGING MARKET, BY END-USE, 2019-2035 (USD BILLION)
      50. TABLE 49 REST OF EUROPE: LIQUID PACKAGING MARKET, BY PACKAGING TYPE, 2019-2035 (USD BILLION)
      51. TABLE 50 REST OF EUROPE: LIQUID PACKAGING MARKET, BY RIGID LIQUID PACKAGING, 2019-2035 (USD BILLION)
      52. TABLE 51 REST OF EUROPE: LIQUID PACKAGING MARKET, BY MATERIAL TYPE, 2019-2035 (USD BILLION)
      53. TABLE 52 REST OF EUROPE: LIQUID PACKAGING MARKET, BY END-USE, 2019-2035 (USD BILLION)
      54. TABLE 53 ASIA-PACIFIC: LIQUID PACKAGING MARKET, BY COUNTRY, 2019-2035 (USD BILLION)
      55. TABLE 54 ASIA-PACIFIC: LIQUID PACKAGING MARKET, BY PACKAGING TYPE, 2019-2035 (USD BILLION)
      56. TABLE 55 ASIA-PACIFIC: LIQUID PACKAGING MARKET, BY RIGID LIQUID PACKAGING, 2019-2035 (USD BILLION)
      57. TABLE 56 ASIA-PACIFIC: LIQUID PACKAGING MARKET, BY MATERIAL TYPE, 2019-2035 (USD BILLION)
      58. TABLE 57 ASIA-PACIFIC: LIQUID PACKAGING MARKET, BY END-USE, 2019-2035 (USD BILLION)
      59. TABLE 58 CHINA: LIQUID PACKAGING MARKET, BY PACKAGING TYPE, 2019-2035 (USD BILLION)
      60. TABLE 59 CHINA: LIQUID PACKAGING MARKET, BY RIGID LIQUID PACKAGING, 2019-2035 (USD BILLION)
      61. TABLE 60 CHINA: LIQUID PACKAGING MARKET, BY MATERIAL TYPE, 2019-2035 (USD BILLION)
      62. TABLE 61 CHINA: LIQUID PACKAGING MARKET, BY END-USE, 2019-2035 (USD BILLION)
      63. TABLE 62 INDIA: LIQUID PACKAGING MARKET, BY PACKAGING TYPE, 2019-2035 (USD BILLION)
      64. TABLE 63 INDIA: LIQUID PACKAGING MARKET, BY RIGID LIQUID PACKAGING, 2019-2035 (USD BILLION)
      65. TABLE 64 INDIA: LIQUID PACKAGING MARKET, BY MATERIAL TYPE, 2019-2035 (USD BILLION)
      66. TABLE 65 INDIA: LIQUID PACKAGING MARKET, BY END-USE, 2019-2035 (USD BILLION)
      67. TABLE 66 JAPAN: LIQUID PACKAGING MARKET, BY PACKAGING TYPE, 2019-2035 (USD BILLION)
      68. TABLE 67 JAPAN: LIQUID PACKAGING MARKET, BY RIGID LIQUID PACKAGING, 2019-2035 (USD BILLION)
      69. TABLE 68 JAPAN: LIQUID PACKAGING MARKET, BY MATERIAL TYPE, 2019-2035 (USD BILLION)
      70. TABLE 69 JAPAN: LIQUID PACKAGING MARKET, BY END-USE, 2019-2035 (USD BILLION)
      71. TABLE 70 SOUTH KOREA: LIQUID PACKAGING MARKET, BY PACKAGING TYPE, 2019-2035 (USD BILLION)
      72. TABLE 71 SOUTH KOREA: LIQUID PACKAGING MARKET, BY RIGID LIQUID PACKAGING, 2019-2035 (USD BILLION)
      73. TABLE 72 SOUTH KOREA: LIQUID PACKAGING MARKET, BY MATERIAL TYPE, 2019-2035 (USD BILLION)
      74. TABLE 73 SOUTH KOREA: LIQUID PACKAGING MARKET, BY END-USE, 2019-2035 (USD BILLION)
      75. TABLE 74 MALAYSIA: LIQUID PACKAGING MARKET, BY PACKAGING TYPE, 2019-2035 (USD BILLION)
      76. TABLE 75 MALAYSIA: LIQUID PACKAGING MARKET, BY RIGID LIQUID PACKAGING, 2019-2035 (USD BILLION)
      77. TABLE 76 MALAYSIA: LIQUID PACKAGING MARKET, BY MATERIAL TYPE, 2019-2035 (USD BILLION)
      78. TABLE 77 MALAYSIA: LIQUID PACKAGING MARKET, BY END-USE, 2019-2035 (USD BILLION)
      79. TABLE 78 THAILAND: LIQUID PACKAGING MARKET, BY PACKAGING TYPE, 2019-2035 (USD BILLION)
      80. TABLE 79 THAILAND: LIQUID PACKAGING MARKET, BY RIGID LIQUID PACKAGING, 2019-2035 (USD BILLION)
      81. TABLE 80 THAILAND: LIQUID PACKAGING MARKET, BY MATERIAL TYPE, 2019-2035 (USD BILLION)
      82. TABLE 81 THAILAND: LIQUID PACKAGING MARKET, BY END-USE, 2019-2035 (USD BILLION)
      83. TABLE 82 INDONESIA: LIQUID PACKAGING MARKET, BY PACKAGING TYPE, 2019-2035 (USD BILLION)
      84. TABLE 83 INDONESIA: LIQUID PACKAGING MARKET, BY RIGID LIQUID PACKAGING, 2019-2035 (USD BILLION)
      85. TABLE 84 INDONESIA: LIQUID PACKAGING MARKET, BY MATERIAL TYPE, 2019-2035 (USD BILLION)
      86. TABLE 85 INDONESIA: LIQUID PACKAGING MARKET, BY END-USE, 2019-2035 (USD BILLION)
      87. TABLE 86 REST OF ASIA-PACIFIC: LIQUID PACKAGING MARKET, BY PACKAGING TYPE, 2019-2035 (USD BILLION)
      88. TABLE 87 REST OF ASIA-PACIFIC: LIQUID PACKAGING MARKET, BY RIGID LIQUID PACKAGING, 2019-2035 (USD BILLION)
      89. TABLE 88 REST OF ASIA-PACIFIC: LIQUID PACKAGING MARKET, BY MATERIAL TYPE, 2019-2035 (USD BILLION)
      90. TABLE 89 REST OF ASIA-PACIFIC: LIQUID PACKAGING MARKET, BY END-USE, 2019-2035 (USD BILLION)
      91. TABLE 90 MEA: LIQUID PACKAGING MARKET, BY COUNTRY, 2019-2035 (USD BILLION)
      92. TABLE 91 MEA: LIQUID PACKAGING MARKET, BY PACKAGING TYPE, 2019-2035 (USD BILLION)
      93. TABLE 92 MEA: LIQUID PACKAGING MARKET, BY RIGID LIQUID PACKAGING, 2019-2035 (USD BILLION)
      94. TABLE 93 MEA: LIQUID PACKAGING MARKET, BY MATERIAL TYPE, 2019-2035 (USD BILLION)
      95. TABLE 94 MEA: LIQUID PACKAGING MARKET, BY END-USE, 2019-2035 (USD BILLION)
      96. TABLE 95 GCC COUNTRIES: LIQUID PACKAGING MARKET, BY PACKAGING TYPE, 2019-2035 (USD BILLION)
      97. TABLE 96 GCC COUNTRIES: LIQUID PACKAGING MARKET, BY RIGID LIQUID PACKAGING, 2019-2035 (USD BILLION)
      98. TABLE 97 GCC COUNTRIES: LIQUID PACKAGING MARKET, BY MATERIAL TYPE, 2019-2035 (USD BILLION)
      99. TABLE 98 GCC COUNTRIES: LIQUID PACKAGING MARKET, BY END-USE, 2019-2035 (USD BILLION)
      100. TABLE 99 SOUTH AFRICA: LIQUID PACKAGING MARKET, BY PACKAGING TYPE, 2019-2035 (USD BILLION)
      101. TABLE 100 SOUTH AFRICA: LIQUID PACKAGING MARKET, BY RIGID LIQUID PACKAGING, 2019-2035 (USD BILLION)
      102. TABLE 101 SOUTH AFRICA: LIQUID PACKAGING MARKET, BY MATERIAL TYPE, 2019-2035 (USD BILLION)
      103. TABLE 102 SOUTH AFRICA: LIQUID PACKAGING MARKET, BY END-USE, 2019-2035 (USD BILLION)
      104. TABLE 103 REST OF MEA: LIQUID PACKAGING MARKET, BY PACKAGING TYPE, 2019-2035 (USD BILLION)
      105. TABLE 104 REST OF MEA: LIQUID PACKAGING MARKET, BY RIGID LIQUID PACKAGING, 2019-2035 (USD BILLION)
      106. TABLE 105 REST OF MEA: LIQUID PACKAGING MARKET, BY MATERIAL TYPE, 2019-2035 (USD BILLION)
      107. TABLE 106 REST OF MEA: LIQUID PACKAGING MARKET, BY END-USE, 2019-2035 (USD BILLION)
      108. TABLE 107 SOUTH AMERICA: LIQUID PACKAGING MARKET, BY COUNTRY, 2019-2035 (USD BILLION)
      109. TABLE 108 SOUTH AMERICA: LIQUID PACKAGING MARKET, BY PACKAGING TYPE, 2019-2035 (USD BILLION)
      110. TABLE 109 SOUTH AMERICA: LIQUID PACKAGING MARKET, BY RIGID LIQUID PACKAGING, 2019-2035 (USD BILLION)
      111. TABLE 110 SOUTH AMERICA: LIQUID PACKAGING MARKET, BY MATERIAL TYPE, 2019-2035 (USD BILLION)
      112. TABLE 111 SOUTH AMERICA: LIQUID PACKAGING MARKET, BY END-USE, 2019-2035 (USD BILLION)
      113. TABLE 112 BRAZIL: LIQUID PACKAGING MARKET, BY PACKAGING TYPE, 2019-2035 (USD BILLION)
      114. TABLE 113 BRAZIL: LIQUID PACKAGING MARKET, BY RIGID LIQUID PACKAGING, 2019-2035 (USD BILLION)
      115. TABLE 114 BRAZIL: LIQUID PACKAGING MARKET, BY MATERIAL TYPE, 2019-2035 (USD BILLION)
      116. TABLE 115 BRAZIL: LIQUID PACKAGING MARKET, BY END-USE, 2019-2035 (USD BILLION)
      117. TABLE 116 ARGENTINA: LIQUID PACKAGING MARKET, BY PACKAGING TYPE, 2019-2035 (USD BILLION)
      118. TABLE 117 ARGENTINA: LIQUID PACKAGING MARKET, BY RIGID LIQUID PACKAGING, 2019-2035 (USD BILLION)
      119. TABLE 118 ARGENTINA: LIQUID PACKAGING MARKET, BY MATERIAL TYPE, 2019-2035 (USD BILLION)
      120. TABLE 119 ARGENTINA: LIQUID PACKAGING MARKET, BY END-USE, 2019-2035 (USD BILLION)
      121. TABLE 120 REST OF SOUTH AMERICA: LIQUID PACKAGING MARKET, BY PACKAGING TYPE, 2019-2035 (USD BILLION)
      122. TABLE 121 REST OF SOUTH AMERICA: LIQUID PACKAGING MARKET, BY RIGID LIQUID PACKAGING, 2019-2035 (USD BILLION)
      123. TABLE 122 REST OF SOUTH AMERICA: LIQUID PACKAGING MARKET, BY MATERIAL TYPE, 2019-2035 (USD BILLION)
      124. TABLE 123 REST OF SOUTH AMERICA: LIQUID PACKAGING MARKET, BY END-USE, 2019-2035 (USD BILLION)
      125. TABLE 124 PRODUCT LAUNCH
      126. TABLE 125 ACQUISITION
      127. TABLE 126 AMCOR PLC: PRODUCTS OFFERED
      128. TABLE 127 AMCOR PLC: KEY DEVELOPMENTS
      129. TABLE 128 SEALED AIR: PRODUCTS OFFERED
      130. TABLE 129 SEALED AIR: KEY DEVELOPMENT
      131. TABLE 130 MONDI: PRODUCTS OFFERED
      132. TABLE 131 MONDI: KEY DEVELOPMENTS
      133. TABLE 132 UFLEX LIMITED: PRODUCTS OFFERED
      134. TABLE 133 UFLEX LIMITED: KEY DEVELOPMENTS
      135. TABLE 134 BERRY GLOBAL GROUP, INC.: PRODUCTS OFFERED
      136. TABLE 135 BERRY GLOBAL GROUP, INC.: KEY DEVELOPMENTS
      137. TABLE 136 INTERNATIONAL PAPER: PRODUCTS OFFERED
      138. TABLE 137 INTERNATIONAL PAPER: KEY DEVELOPMENTS
      139. TABLE 138 TETRA PAK INTERNATIONAL S.A.: PRODUCTS OFFERED
      140. TABLE 139 TETRA PAK INTERNATIONAL S.A: KEY DEVELOPMENTS
      141. TABLE 140 SMURFIT KAPPA GROUP / SMURFIT WESTROCK: PRODUCTS OFFERED
      142. TABLE 141 SMURFIT KAPPA GROUP / SMURFIT WESTROCK: KEY DEVELOPMENTS
      143. TABLE 142 DS SMITH: PRODUCTS OFFERED
      144. TABLE 143 DS SMITH: KEY DEVELOPMENTS
      145. TABLE 144 SIG COMBIBLOC GROUP AG: PRODUCTS OFFERED
      146. TABLE 145 SIG COMBIBLOC GROUP AG: KEY DEVELOPMENTS LIST OF FIGURES
      147. FIGURE 1 GLOBAL LIQUID PACKAGING MARKET: STRUCTURE
      148. FIGURE 2 MARKET DYNAMICS: GLOBAL LIQUID PACKAGING MARKET
      149. FIGURE 3 DRIVERS: IMPACT ANALYSIS: GLOBAL LIQUID PACKAGING MARKET
      150. FIGURE 4 RESTRAINT IMPACT ANALYSIS: GLOBAL LIQUID PACKAGING MARKET
      151. FIGURE 5 SUPPLY CHAIN ANALYSIS: GLOBAL LIQUID PACKAGING MARKET
      152. FIGURE 6 PORTER’S FIVE FORCES ANALYSIS: GLOBAL LIQUID PACKAGING MARKET
      153. FIGURE 7 GLOBAL LIQUID PACKAGING MARKET, BY PACKAGING TYPE, 2024 (% SHARE)
      154. FIGURE 8 GLOBAL LIQUID PACKAGING MARKET, BY MATERIAL TYPE, 2024 (% SHARE)
      155. FIGURE 9 GLOBAL LIQUID PACKAGING MARKET, BY END-USE, 2024 (% SHARE)
      156. FIGURE 10 GLOBAL LIQUID PACKAGING MARKET, BY REGION, 2024 (% SHARE)
      157. FIGURE 11 GLOBAL LIQUID PACKAGING PLAYERS: COMPETITIVE ANALSIS, 2024
      158. FIGURE 12 COMPETITOR DASHBOARD: GLOBAL LIQUID PACKAGING
      159. FIGURE 13 AMCOR PLC: FINANCIAL SNAPSHOT
      160. FIGURE 14 AMCOR PLC: SWOT ANALYSIS
      161. FIGURE 15 SEALED AIR: FINANCIAL OVERVIEW SNAPSHOT
      162. FIGURE 16 SEALED AIR: SWOT ANALYSIS
      163. FIGURE 17 MONDI: FINANCIAL OVERVIEW SNAPSHOT
      164. FIGURE 18 MONDI: SWOT ANALYSIS
      165. FIGURE 19 UFLEX LIMITED: FINANCIAL OVERVIEW SNAPSHOT
      166. FIGURE 20 UFLEX LIMITED: SWOT ANALYSIS
      167. FIGURE 21 BERRY GLOBAL GROUP, INC.: FINANCIAL SNAPSHOT
      168. FIGURE 22 BERRY GLOBAL GROUP, INC.: SWOT ANALYSIS
      169. FIGURE 23 INTERNATIONAL PAPER: FINANCIAL OVERVIEW SNAPSHOT
      170. FIGURE 24 INTERNATIONAL PAPER: SWOT ANALYSIS
      171. FIGURE 25 TETRA PAK INTERNATIONAL S.A: SWOT ANALYSIS
      172. FIGURE 26 SMURFIT KAPPA GROUP / SMURFIT WESTROCK: FINANCIAL OVERVIEW SNAPSHOT
      173. FIGURE 27 INTERNATIONAL PAPER: SWOT ANALYSIS
      174. FIGURE 28 DS SMITH: SWOT ANALYSIS
      175. FIGURE 29 DS SMITH: SWOT ANALYSIS    

    Global Outlook (USD Billion, 2019-2035)

    Global Liquid Packaging, By Packaging Type (USD Billion, 2019-2035)

    • Flexible Liquid Packaging
    • Rigid Liquid Packaging
      • Cartons
      • Paperboard
      • Plastics PET bottles
      • Others

    Global Liquid Packaging, By Material Type (USD Billion, 2019-2035)

    • Paperboard
    • Plastics
    • Glass
    • Metal

    Global Liquid Packaging, By End-Use (USD Billion, 2019-2035)

    • Beverage
    • Personal Care Cosmetic
    • Pharmaceutical
    • Household
    • Industrial

    North America Outlook (USD Billion, 2019-2035)

    North America Liquid Packaging, By Packaging Type (USD Billion, 2019-2035)

    • Flexible Liquid Packaging
    • Rigid Liquid Packaging
      • Cartons
      • Paperboard
      • Plastics PET bottles
      • Others

    North America Liquid Packaging, By Material Type (USD Billion, 2019-2035)

    • Paperboard
    • Plastics
    • Glass
    • Metal

    North America Liquid Packaging, By End-Use (USD Billion, 2019-2035)

    • Beverage
    • Personal Care Cosmetic
    • Pharmaceutical
    • Household
    • Industrial

    US Outlook (USD Billion, 2019-2035)

    US Liquid Packaging, By Packaging Type (USD Billion, 2019-2035)

    • Flexible Liquid Packaging
    • Rigid Liquid Packaging
      • Cartons
      • Paperboard
      • Plastics PET bottles
      • Others

    US Liquid Packaging, By Material Type (USD Billion, 2019-2035)

    • Paperboard
    • Plastics
    • Glass
    • Metal

    US Liquid Packaging, By End-Use (USD Billion, 2019-2035)

    • Beverage
    • Personal Care Cosmetic
    • Pharmaceutical
    • Household
    • Industrial

    Canada Outlook (USD Billion, 2019-2035)

    Canada Liquid Packaging, By Packaging Type (USD Billion, 2019-2035)

    • Flexible Liquid Packaging
    • Rigid Liquid Packaging
      • Cartons
      • Paperboard
      • Plastics PET bottles
      • Others

    Canada Liquid Packaging, By Material Type (USD Billion, 2019-2035)

    • Paperboard
    • Plastics
    • Glass
    • Metal

    Canada Liquid Packaging, By End-Use (USD Billion, 2019-2035)

    • Beverage
    • Personal Care Cosmetic
    • Pharmaceutical
    • Household
    • Industrial

    Mexico Outlook (USD Billion, 2019-2035)

    Mexico Liquid Packaging, By Packaging Type (USD Billion, 2019-2035)

    • Flexible Liquid Packaging
    • Rigid Liquid Packaging
      • Cartons
      • Paperboard
      • Plastics PET bottles
      • Others

    Mexico Liquid Packaging, By Material Type (USD Billion, 2019-2035)

    • Paperboard
    • Plastics
    • Glass
    • Metal

    Mexico Liquid Packaging, By End-Use (USD Billion, 2019-2035)

    • Beverage
    • Personal Care Cosmetic
    • Pharmaceutical
    • Household
    • Industrial

    Europe Outlook (USD Billion, 2019-2035)

    Europe Liquid Packaging, By Packaging Type (USD Billion, 2019-2035)

    • Flexible Liquid Packaging
    • Rigid Liquid Packaging
      • Cartons
      • Paperboard
      • Plastics PET bottles
      • Others

    Europe Liquid Packaging, By Material Type (USD Billion, 2019-2035)

    • Paperboard
    • Plastics
    • Glass
    • Metal

    Europe Liquid Packaging, By End-Use (USD Billion, 2019-2035)

    • Beverage
    • Personal Care Cosmetic
    • Pharmaceutical
    • Household
    • Industrial

    Germany Outlook (USD Billion, 2019-2035)

    Germany Liquid Packaging, By Packaging Type (USD Billion, 2019-2035)

    • Flexible Liquid Packaging
    • Rigid Liquid Packaging
      • Cartons
      • Paperboard
      • Plastics PET bottles
      • Others

    Germany Liquid Packaging, By Material Type (USD Billion, 2019-2035)

    • Paperboard
    • Plastics
    • Glass
    • Metal

    Germany Liquid Packaging, By End-Use (USD Billion, 2019-2035)

    • Beverage
    • Personal Care Cosmetic
    • Pharmaceutical
    • Household
    • Industrial

    France Outlook (USD Billion, 2019-2035)

    France Liquid Packaging, By Packaging Type (USD Billion, 2019-2035)

    • Flexible Liquid Packaging
    • Rigid Liquid Packaging
      • Cartons
      • Paperboard
      • Plastics PET bottles
      • Others

    France Liquid Packaging, By Material Type (USD Billion, 2019-2035)

    • Paperboard
    • Plastics
    • Glass
    • Metal

    France Liquid Packaging, By End-Use (USD Billion, 2019-2035)

    • Beverage
    • Personal Care Cosmetic
    • Pharmaceutical
    • Household
    • Industrial

    Russia Outlook (USD Billion, 2019-2035)

    Russia Liquid Packaging, By Packaging Type (USD Billion, 2019-2035)

    • Flexible Liquid Packaging
    • Rigid Liquid Packaging
      • Cartons
      • Paperboard
      • Plastics PET bottles
      • Others

    Russia Liquid Packaging, By Material Type (USD Billion, 2019-2035)

    • Paperboard
    • Plastics
    • Glass
    • Metal

    Russia Liquid Packaging, By End-Use (USD Billion, 2019-2035)

    • Beverage
    • Personal Care Cosmetic
    • Pharmaceutical
    • Household
    • Industrial

    Italy Outlook (USD Billion, 2019-2035)

    Italy Liquid Packaging, By Packaging Type (USD Billion, 2019-2035)

    • Flexible Liquid Packaging
    • Rigid Liquid Packaging
      • Cartons
      • Paperboard
      • Plastics PET bottles
      • Others

    Italy Liquid Packaging, By Material Type (USD Billion, 2019-2035)

    • Paperboard
    • Plastics
    • Glass
    • Metal

    Italy Liquid Packaging, By End-Use (USD Billion, 2019-2035)

    • Beverage
    • Personal Care Cosmetic
    • Pharmaceutical
    • Household
    • Industrial

    Spain Outlook (USD Billion, 2019-2035)

    Spain Liquid Packaging, By Packaging Type (USD Billion, 2019-2035)

    • Flexible Liquid Packaging
    • Rigid Liquid Packaging
      • Cartons
      • Paperboard
      • Plastics PET bottles
      • Others

    Spain Liquid Packaging, By Material Type (USD Billion, 2019-2035)

    • Paperboard
    • Plastics
    • Glass
    • Metal

    Spain Liquid Packaging, By End-Use (USD Billion, 2019-2035)

    • Beverage
    • Personal Care Cosmetic
    • Pharmaceutical
    • Household
    • Industrial

    Rest of Europe Outlook (USD Billion, 2019-2035)

    Rest of Europe Liquid Packaging, By Packaging Type (USD Billion, 2019-2035)

    • Flexible Liquid Packaging
    • Rigid Liquid Packaging
      • Cartons
      • Paperboard
      • Plastics PET bottles
      • Others

    Rest of Europe Liquid Packaging, By Material Type (USD Billion, 2019-2035)

    • Paperboard
    • Plastics
    • Glass
    • Metal

    Rest of Europe Liquid Packaging, By End-Use (USD Billion, 2019-2035)

    • Beverage
    • Personal Care Cosmetic
    • Pharmaceutical
    • Household
    • Industrial

    Asia-Pacific Outlook (USD Billion, 2019-2035)

    Asia-Pacific Liquid Packaging, By Packaging Type (USD Billion, 2019-2035)

    • Flexible Liquid Packaging
    • Rigid Liquid Packaging
      • Cartons
      • Paperboard
      • Plastics PET bottles
      • Others

    Asia-Pacific Liquid Packaging, By Material Type (USD Billion, 2019-2035)

    • Paperboard
    • Plastics
    • Glass
    • Metal

    Asia-Pacific Liquid Packaging, By End-Use (USD Billion, 2019-2035)

    • Beverage
    • Personal Care Cosmetic
    • Pharmaceutical
    • Household
    • Industrial

    China Outlook (USD Billion, 2019-2035)

    China Liquid Packaging, By Packaging Type (USD Billion, 2019-2035)

    • Flexible Liquid Packaging
    • Rigid Liquid Packaging
      • Cartons
      • Paperboard
      • Plastics PET bottles
      • Others

    China Liquid Packaging, By Material Type (USD Billion, 2019-2035)

    • Paperboard
    • Plastics
    • Glass
    • Metal

    China Liquid Packaging, By End-Use (USD Billion, 2019-2035)

    • Beverage
    • Personal Care Cosmetic
    • Pharmaceutical
    • Household
    • Industrial

    India Outlook (USD Billion, 2019-2035)

    India Liquid Packaging, By Packaging Type (USD Billion, 2019-2035)

    • Flexible Liquid Packaging
    • Rigid Liquid Packaging
      • Cartons
      • Paperboard
      • Plastics PET bottles
      • Others

    India Liquid Packaging, By Material Type (USD Billion, 2019-2035)

    • Paperboard
    • Plastics
    • Glass
    • Metal

    India Liquid Packaging, By End-Use (USD Billion, 2019-2035)

    • Beverage
    • Personal Care Cosmetic
    • Pharmaceutical
    • Household
    • Industrial

    Japan Outlook (USD Billion, 2019-2035)

    Japan Liquid Packaging, By Packaging Type (USD Billion, 2019-2035)

    • Flexible Liquid Packaging
    • Rigid Liquid Packaging
      • Cartons
      • Paperboard
      • Plastics PET bottles
      • Others

    Japan Liquid Packaging, By Material Type (USD Billion, 2019-2035)

    • Paperboard
    • Plastics
    • Glass
    • Metal

    Japan Liquid Packaging, By End-Use (USD Billion, 2019-2035)

    • Beverage
    • Personal Care Cosmetic
    • Pharmaceutical
    • Household
    • Industrial

    South Korea Outlook (USD Billion, 2019-2035)

    South Korea Liquid Packaging, By Packaging Type (USD Billion, 2019-2035)

    • Flexible Liquid Packaging
    • Rigid Liquid Packaging
      • Cartons
      • Paperboard
      • Plastics PET bottles
      • Others

    South Korea Liquid Packaging, By Material Type (USD Billion, 2019-2035)

    • Paperboard
    • Plastics
    • Glass
    • Metal

    South Korea Liquid Packaging, By End-Use (USD Billion, 2019-2035)

    • Beverage
    • Personal Care Cosmetic
    • Pharmaceutical
    • Household
    • Industrial

    Malaysia Outlook (USD Billion, 2019-2035)

    Malaysia Liquid Packaging, By Packaging Type (USD Billion, 2019-2035)

    • Flexible Liquid Packaging
    • Rigid Liquid Packaging
      • Cartons
      • Paperboard
      • Plastics PET bottles
      • Others

    Malaysia Liquid Packaging, By Material Type (USD Billion, 2019-2035)

    • Paperboard
    • Plastics
    • Glass
    • Metal

    Malaysia Liquid Packaging, By End-Use (USD Billion, 2019-2035)

    • Beverage
    • Personal Care Cosmetic
    • Pharmaceutical
    • Household
    • Industrial

    Thailand Outlook (USD Billion, 2019-2035)

    Thailand Liquid Packaging, By Packaging Type (USD Billion, 2019-2035)

    • Flexible Liquid Packaging
    • Rigid Liquid Packaging
      • Cartons
      • Paperboard
      • Plastics PET bottles
      • Others

    Thailand Liquid Packaging, By Material Type (USD Billion, 2019-2035)

    • Paperboard
    • Plastics
    • Glass
    • Metal

    Thailand Liquid Packaging, By End-Use (USD Billion, 2019-2035)

    • Beverage
    • Personal Care Cosmetic
    • Pharmaceutical
    • Household
    • Industrial

    Indonesia Outlook (USD Billion, 2019-2035)

    Indonesia Liquid Packaging, By Packaging Type (USD Billion, 2019-2035)

    • Flexible Liquid Packaging
    • Rigid Liquid Packaging
      • Cartons
      • Paperboard
      • Plastics PET bottles
      • Others

    Indonesia Liquid Packaging, By Material Type (USD Billion, 2019-2035)

    • Paperboard
    • Plastics
    • Glass
    • Metal

    Indonesia Liquid Packaging, By End-Use (USD Billion, 2019-2035)

    • Beverage
    • Personal Care Cosmetic
    • Pharmaceutical
    • Household
    • Industrial

    Rest of Asia-Pacific Outlook (USD Billion, 2019-2035)

    Rest of Asia-Pacific Liquid Packaging, By Packaging Type (USD Billion, 2019-2035)

    • Flexible Liquid Packaging
    • Rigid Liquid Packaging
      • Cartons
      • Paperboard
      • Plastics PET bottles
      • Others

    Rest of Asia-Pacific Liquid Packaging, By Material Type (USD Billion, 2019-2035)

    • Paperboard
    • Plastics
    • Glass
    • Metal

    Rest of Asia-Pacific Liquid Packaging, By End-Use (USD Billion, 2019-2035)

    • Beverage
    • Personal Care Cosmetic
    • Pharmaceutical
    • Household
    • Industrial

    Middle East & Africa Outlook (USD Billion, 2019-2035)

    Middle East & Africa Liquid Packaging, By Packaging Type (USD Billion, 2019-2035)

    • Flexible Liquid Packaging
    • Rigid Liquid Packaging
      • Cartons
      • Paperboard
      • Plastics PET bottles
      • Others

    Middle East & Africa Liquid Packaging, By Material Type (USD Billion, 2019-2035)

    • Paperboard
    • Plastics
    • Glass
    • Metal

    Middle East & Africa Liquid Packaging, By End-Use (USD Billion, 2019-2035)

    • Beverage
    • Personal Care Cosmetic
    • Pharmaceutical
    • Household
    • Industrial

    GCC Countries Outlook (USD Billion, 2019-2035)

    GCC Countries Liquid Packaging, By Packaging Type (USD Billion, 2019-2035)

    • Flexible Liquid Packaging
    • Rigid Liquid Packaging
      • Cartons
      • Paperboard
      • Plastics PET bottles
      • Others

    GCC Countries Liquid Packaging, By Material Type (USD Billion, 2019-2035)

    • Paperboard
    • Plastics
    • Glass
    • Metal

    GCC Countries Liquid Packaging, By End-Use (USD Billion, 2019-2035)

    • Beverage
    • Personal Care Cosmetic
    • Pharmaceutical
    • Household
    • Industrial

    South Africa Outlook (USD Billion, 2019-2035)

    South Africa Liquid Packaging, By Packaging Type (USD Billion, 2019-2035)

    • Flexible Liquid Packaging
    • Rigid Liquid Packaging
      • Cartons
      • Paperboard
      • Plastics PET bottles
      • Others

    South Africa Liquid Packaging, By Material Type (USD Billion, 2019-2035)

    • Paperboard
    • Plastics
    • Glass
    • Metal

    South Africa Liquid Packaging, By End-Use (USD Billion, 2019-2035)

    • Beverage
    • Personal Care Cosmetic
    • Pharmaceutical
    • Household
    • Industrial

    Rest of MEA Outlook (USD Billion, 2019-2035)

    Rest of MEA Liquid Packaging, By Packaging Type (USD Billion, 2019-2035)

    • Flexible Liquid Packaging
    • Rigid Liquid Packaging
      • Cartons
      • Paperboard
      • Plastics PET bottles
      • Others

    Rest of MEA Liquid Packaging, By Material Type (USD Billion, 2019-2035)

    • Paperboard
    • Plastics
    • Glass
    • Metal

    Rest of MEA Liquid Packaging, By End-Use (USD Billion, 2019-2035)

    • Beverage
    • Personal Care Cosmetic
    • Pharmaceutical
    • Household
    • Industrial

    South America Outlook (USD Billion, 2019-2035)

    South America Liquid Packaging, By Packaging Type (USD Billion, 2019-2035)

    • Flexible Liquid Packaging
    • Rigid Liquid Packaging
      • Cartons
      • Paperboard
      • Plastics PET bottles
      • Others

    South America Liquid Packaging, By Material Type (USD Billion, 2019-2035)

    • Paperboard
    • Plastics
    • Glass
    • Metal

    South America Liquid Packaging, By End-Use (USD Billion, 2019-2035)

    • Beverage
    • Personal Care Cosmetic
    • Pharmaceutical
    • Household
    • Industrial

    Brazil Outlook (USD Billion, 2019-2035)

    Brazil Liquid Packaging, By Packaging Type (USD Billion, 2019-2035)

    • Flexible Liquid Packaging
    • Rigid Liquid Packaging
      • Cartons
      • Paperboard
      • Plastics PET bottles
      • Others

    Brazil Liquid Packaging, By Material Type (USD Billion, 2019-2035)

    • Paperboard
    • Plastics
    • Glass
    • Metal

    Brazil Liquid Packaging, By End-Use (USD Billion, 2019-2035)

    • Beverage
    • Personal Care Cosmetic
    • Pharmaceutical
    • Household
    • Industrial

    Argentina Outlook (USD Billion, 2019-2035)

    Argentina Liquid Packaging, By Packaging Type (USD Billion, 2019-2035)

    • Flexible Liquid Packaging
    • Rigid Liquid Packaging
      • Cartons
      • Paperboard
      • Plastics PET bottles
      • Others

    Argentina Liquid Packaging, By Material Type (USD Billion, 2019-2035)

    • Paperboard
    • Plastics
    • Glass
    • Metal

    Argentina Liquid Packaging, By End-Use (USD Billion, 2019-2035)

    • Beverage
    • Personal Care Cosmetic
    • Pharmaceutical
    • Household
    • Industrial

    Rest of South America Outlook (USD Billion, 2019-2035)

    Rest of South America Liquid Packaging, By Packaging Type (USD Billion, 2019-2035)

    • Flexible Liquid Packaging
    • Rigid Liquid Packaging
      • Cartons
      • Paperboard
      • Plastics PET bottles
      • Others

    Rest of South America Liquid Packaging, By Material Type (USD Billion, 2019-2035)

    • Paperboard
    • Plastics
    • Glass
    • Metal

    Rest of South America Liquid Packaging, By End-Use (USD Billion, 2019-2035)

    • Beverage
    • Personal Care Cosmetic
    • Pharmaceutical
    • Household
    • Industrial
    Infographic

    Free Sample Request

    Kindly complete the form below to receive a free sample of this Report

    Get Free Sample

    Customer Strories

    “I am very pleased with how market segments have been defined in a relevant way for my purposes (such as "Portable Freezers & refrigerators" and "last-mile"). In general the report is well structured. Thanks very much for your efforts.”

    Victoria Milne

    Founder
    Case Study
    Chemicals and Materials