Request Free Sample ×

Kindly complete the form below to receive a free sample of this Report

* Please use a valid business email

Leading companies partner with us for data-driven Insights

clients tt-cursor
Hero Background

Arbeitsplatzsoftwaremarkt

ID: MRFR/ICT/35682-HCR
128 Pages
Aarti Dhapte
Last Updated: April 06, 2026

Marktforschungsbericht zur Software für Arbeitsstationen nach Anwendung (3D-Modellierung, Grafikdesign, Datenanalyse, Videobearbeitung), nach Bereitstellungstyp (Vor-Ort, Cloud-basiert, Hybrid), nach Endbenutzer (Architekten, Ingenieure, Medienprofis, Datenwissenschaftler), nach Betriebssystem (Windows, Linux, macOS) und nach Region (Nordamerika, Europa, Südamerika, Asien-Pazifik, Naher Osten und Afrika) - Prognose bis 2035.

Teilen
Download PDF ×

We do not share your information with anyone. However, we may send you emails based on your report interest from time to time. You may contact us at any time to opt-out.

Workstation Software Market Infographic
Purchase Options
  1. 1 ABSCHNITT I: ZUSAMMENFASSUNG UND WICHTIGE HIGHLIGHTS
    1. 1.1 ZUSAMMENFASSUNG
      1. 1.1.1 Marktübersicht
      2. 1.1.2 Wichtige Ergebnisse
      3. 1.1.3 Marktsegmentierung
      4. 1.1.4 Wettbewerbslandschaft
      5. 1.1.5 Herausforderungen und Chancen
      6. 1.1.6 Zukünftige Aussichten
  2. 2 ABSCHNITT II: ABGRENZUNG, METHODOLOGIE UND MARKTSTRUKTUR
    1. 2.1 MARKTEINFÜHRUNG
      1. 2.1.1 Definition
      2. 2.1.2 Umfang der Studie
        1. 2.1.2.1 Forschungsziel
        2. 2.1.2.2 Annahme
        3. 2.1.2.3 Einschränkungen
    2. 2.2 FORSCHUNGSMETHODOLOGIE
      1. 2.2.1 Übersicht
      2. 2.2.2 Datenanalyse
      3. 2.2.3 Sekundärforschung
      4. 2.2.4 Primärforschung
        1. 2.2.4.1 Primärinterviews und Informationssammlungsprozess
        2. 2.2.4.2 Aufschlüsselung der primären Befragten
      5. 2.2.5 Prognosemodell
      6. 2.2.6 Marktschätzung
        1. 2.2.6.1 Bottom-Up-Ansatz
        2. 2.2.6.2 Top-Down-Ansatz
      7. 2.2.7 Datentriangulation
      8. 2.2.8 Validierung
  3. 3 ABSCHNITT III: QUALITATIVE ANALYSE
    1. 3.1 MARKTDYNAMIK
      1. 3.1.1 Übersicht
      2. 3.1.2 Treiber
      3. 3.1.3 Einschränkungen
      4. 3.1.4 Chancen
    2. 3.2 MARKTFACHT ANALYSE
      1. 3.2.1 Wertschöpfungskettenanalyse
      2. 3.2.2 Porters Fünf Kräfte Analyse
        1. 3.2.2.1 Verhandlungsmacht der Lieferanten
        2. 3.2.2.2 Verhandlungsmacht der Käufer
        3. 3.2.2.3 Bedrohung durch neue Anbieter
        4. 3.2.2.4 Bedrohung durch Substitute
        5. 3.2.2.5 Intensität der Rivalität
      3. 3.2.3 COVID-19 Auswirkungen Analyse
        1. 3.2.3.1 Markt Auswirkungen Analyse
        2. 3.2.3.2 Regionale Auswirkungen
        3. 3.2.3.3 Chancen- und Bedrohungsanalyse
  4. 4 ABSCHNITT IV: QUANTITATIVE ANALYSE
    1. 4.1 Informations- und Kommunikationstechnologie, NACH Anwendung (Milliarden USD)
      1. 4.1.1 3D-Modellierung
      2. 4.1.2 Grafikdesign
      3. 4.1.3 Datenanalyse
      4. 4.1.4 Video-Bearbeitung
    2. 4.2 Informations- und Kommunikationstechnologie, NACH Bereitstellungstyp (Milliarden USD)
      1. 4.2.1 Vor-Ort
      2. 4.2.2 Cloud-basiert
      3. 4.2.3 Hybrid
    3. 4.3 Informations- und Kommunikationstechnologie, NACH Endbenutzer (Milliarden USD)
      1. 4.3.1 Architekten
      2. 4.3.2 Ingenieure
      3. 4.3.3 Medienprofis
      4. 4.3.4 Datenwissenschaftler
    4. 4.4 Informations- und Kommunikationstechnologie, NACH Betriebssystem (Milliarden USD)
      1. 4.4.1 Windows
      2. 4.4.2 Linux
      3. 4.4.3 macOS
    5. 4.5 Informations- und Kommunikationstechnologie, NACH Region (Milliarden USD)
      1. 4.5.1 Nordamerika
        1. 4.5.1.1 USA
        2. 4.5.1.2 Kanada
      2. 4.5.2 Europa
        1. 4.5.2.1 Deutschland
        2. 4.5.2.2 UK
        3. 4.5.2.3 Frankreich
        4. 4.5.2.4 Russland
        5. 4.5.2.5 Italien
        6. 4.5.2.6 Spanien
        7. 4.5.2.7 Rest von Europa
      3. 4.5.3 APAC
        1. 4.5.3.1 China
        2. 4.5.3.2 Indien
        3. 4.5.3.3 Japan
        4. 4.5.3.4 Südkorea
        5. 4.5.3.5 Malaysia
        6. 4.5.3.6 Thailand
        7. 4.5.3.7 Indonesien
        8. 4.5.3.8 Rest von APAC
      4. 4.5.4 Südamerika
        1. 4.5.4.1 Brasilien
        2. 4.5.4.2 Mexiko
        3. 4.5.4.3 Argentinien
        4. 4.5.4.4 Rest von Südamerika
      5. 4.5.5 MEA
        1. 4.5.5.1 GCC-Länder
        2. 4.5.5.2 Südafrika
        3. 4.5.5.3 Rest von MEA
  5. 5 ABSCHNITT V: WETTBEWERBSANALYSE
    1. 5.1 Wettbewerbslandschaft
      1. 5.1.1 Übersicht
      2. 5.1.2 Wettbewerbsanalyse
      3. 5.1.3 Marktanteilsanalyse
      4. 5.1.4 Hauptwachstumsstrategie in der Informations- und Kommunikationstechnologie
      5. 5.1.5 Wettbewerbsbenchmarking
      6. 5.1.6 Führende Akteure in Bezug auf die Anzahl der Entwicklungen in der Informations- und Kommunikationstechnologie
      7. 5.1.7 Wichtige Entwicklungen und Wachstumsstrategien
        1. 5.1.7.1 Neue Produkteinführungen/Dienstleistungsbereitstellungen
        2. 5.1.7.2 Fusionen & Übernahmen
        3. 5.1.7.3 Joint Ventures
      8. 5.1.8 Finanzmatrix der Hauptakteure
        1. 5.1.8.1 Umsatz und Betriebseinkommen
        2. 5.1.8.2 F&E-Ausgaben der Hauptakteure. 2023
    2. 5.2 Unternehmensprofile
      1. 5.2.1 Autodesk (USA)
        1. 5.2.1.1 Finanzübersicht
        2. 5.2.1.2 Angebotene Produkte
        3. 5.2.1.3 Wichtige Entwicklungen
        4. 5.2.1.4 SWOT-Analyse
        5. 5.2.1.5 Schlüsselstrategien
      2. 5.2.2 Adobe (USA)
        1. 5.2.2.1 Finanzübersicht
        2. 5.2.2.2 Angebotene Produkte
        3. 5.2.2.3 Wichtige Entwicklungen
        4. 5.2.2.4 SWOT-Analyse
        5. 5.2.2.5 Schlüsselstrategien
      3. 5.2.3 Siemens (DE)
        1. 5.2.3.1 Finanzübersicht
        2. 5.2.3.2 Angebotene Produkte
        3. 5.2.3.3 Wichtige Entwicklungen
        4. 5.2.3.4 SWOT-Analyse
        5. 5.2.3.5 Schlüsselstrategien
      4. 5.2.4 Dassault Systemes (FR)
        1. 5.2.4.1 Finanzübersicht
        2. 5.2.4.2 Angebotene Produkte
        3. 5.2.4.3 Wichtige Entwicklungen
        4. 5.2.4.4 SWOT-Analyse
        5. 5.2.4.5 Schlüsselstrategien
      5. 5.2.5 PTC (USA)
        1. 5.2.5.1 Finanzübersicht
        2. 5.2.5.2 Angebotene Produkte
        3. 5.2.5.3 Wichtige Entwicklungen
        4. 5.2.5.4 SWOT-Analyse
        5. 5.2.5.5 Schlüsselstrategien
      6. 5.2.6 Bentley Systems (USA)
        1. 5.2.6.1 Finanzübersicht
        2. 5.2.6.2 Angebotene Produkte
        3. 5.2.6.3 Wichtige Entwicklungen
        4. 5.2.6.4 SWOT-Analyse
        5. 5.2.6.5 Schlüsselstrategien
      7. 5.2.7 ANSYS (USA)
        1. 5.2.7.1 Finanzübersicht
        2. 5.2.7.2 Angebotene Produkte
        3. 5.2.7.3 Wichtige Entwicklungen
        4. 5.2.7.4 SWOT-Analyse
        5. 5.2.7.5 Schlüsselstrategien
      8. 5.2.8 Altair (USA)
        1. 5.2.8.1 Finanzübersicht
        2. 5.2.8.2 Angebotene Produkte
        3. 5.2.8.3 Wichtige Entwicklungen
        4. 5.2.8.4 SWOT-Analyse
        5. 5.2.8.5 Schlüsselstrategien
      9. 5.2.9 MathWorks (USA)
        1. 5.2.9.1 Finanzübersicht
        2. 5.2.9.2 Angebotene Produkte
        3. 5.2.9.3 Wichtige Entwicklungen
        4. 5.2.9.4 SWOT-Analyse
        5. 5.2.9.5 Schlüsselstrategien
    3. 5.3 Anhang
      1. 5.3.1 Referenzen
      2. 5.3.2 Verwandte Berichte
  6. 6 LISTE DER ABBILDUNGEN
    1. 6.1 MARKTSYNOPSIS
    2. 6.2 NORDAMERIKA MARKTANALYSE
    3. 6.3 USA MARKTANALYSE NACH ANWENDUNG
    4. 6.4 USA MARKTANALYSE NACH BEREITSTELLUNGSTYP
    5. 6.5 USA MARKTANALYSE NACH ENDBENUTZER
    6. 6.6 USA MARKTANALYSE NACH BETRIEBSSYSTEM
    7. 6.7 KANADA MARKTANALYSE NACH ANWENDUNG
    8. 6.8 KANADA MARKTANALYSE NACH BEREITSTELLUNGSTYP
    9. 6.9 KANADA MARKTANALYSE NACH ENDBENUTZER
    10. 6.10 KANADA MARKTANALYSE NACH BETRIEBSSYSTEM
    11. 6.11 EUROPA MARKTANALYSE
    12. 6.12 DEUTSCHLAND MARKTANALYSE NACH ANWENDUNG
    13. 6.13 DEUTSCHLAND MARKTANALYSE NACH BEREITSTELLUNGSTYP
    14. 6.14 DEUTSCHLAND MARKTANALYSE NACH ENDBENUTZER
    15. 6.15 DEUTSCHLAND MARKTANALYSE NACH BETRIEBSSYSTEM
    16. 6.16 UK MARKTANALYSE NACH ANWENDUNG
    17. 6.17 UK MARKTANALYSE NACH BEREITSTELLUNGSTYP
    18. 6.18 UK MARKTANALYSE NACH ENDBENUTZER
    19. 6.19 UK MARKTANALYSE NACH BETRIEBSSYSTEM
    20. 6.20 FRANKREICH MARKTANALYSE NACH ANWENDUNG
    21. 6.21 FRANKREICH MARKTANALYSE NACH BEREITSTELLUNGSTYP
    22. 6.22 FRANKREICH MARKTANALYSE NACH ENDBENUTZER
    23. 6.23 FRANKREICH MARKTANALYSE NACH BETRIEBSSYSTEM
    24. 6.24 RUSSLAND MARKTANALYSE NACH ANWENDUNG
    25. 6.25 RUSSLAND MARKTANALYSE NACH BEREITSTELLUNGSTYP
    26. 6.26 RUSSLAND MARKTANALYSE NACH ENDBENUTZER
    27. 6.27 RUSSLAND MARKTANALYSE NACH BETRIEBSSYSTEM
    28. 6.28 ITALIEN MARKTANALYSE NACH ANWENDUNG
    29. 6.29 ITALIEN MARKTANALYSE NACH BEREITSTELLUNGSTYP
    30. 6.30 ITALIEN MARKTANALYSE NACH ENDBENUTZER
    31. 6.31 ITALIEN MARKTANALYSE NACH BETRIEBSSYSTEM
    32. 6.32 SPANIEN MARKTANALYSE NACH ANWENDUNG
    33. 6.33 SPANIEN MARKTANALYSE NACH BEREITSTELLUNGSTYP
    34. 6.34 SPANIEN MARKTANALYSE NACH ENDBENUTZER
    35. 6.35 SPANIEN MARKTANALYSE NACH BETRIEBSSYSTEM
    36. 6.36 REST VON EUROPA MARKTANALYSE NACH ANWENDUNG
    37. 6.37 REST VON EUROPA MARKTANALYSE NACH BEREITSTELLUNGSTYP
    38. 6.38 REST VON EUROPA MARKTANALYSE NACH ENDBENUTZER
    39. 6.39 REST VON EUROPA MARKTANALYSE NACH BETRIEBSSYSTEM
    40. 6.40 APAC MARKTANALYSE
    41. 6.41 CHINA MARKTANALYSE NACH ANWENDUNG
    42. 6.42 CHINA MARKTANALYSE NACH BEREITSTELLUNGSTYP
    43. 6.43 CHINA MARKTANALYSE NACH ENDBENUTZER
    44. 6.44 CHINA MARKTANALYSE NACH BETRIEBSSYSTEM
    45. 6.45 INDIEN MARKTANALYSE NACH ANWENDUNG
    46. 6.46 INDIEN MARKTANALYSE NACH BEREITSTELLUNGSTYP
    47. 6.47 INDIEN MARKTANALYSE NACH ENDBENUTZER
    48. 6.48 INDIEN MARKTANALYSE NACH BETRIEBSSYSTEM
    49. 6.49 JAPAN MARKTANALYSE NACH ANWENDUNG
    50. 6.50 JAPAN MARKTANALYSE NACH BEREITSTELLUNGSTYP
    51. 6.51 JAPAN MARKTANALYSE NACH ENDBENUTZER
    52. 6.52 JAPAN MARKTANALYSE NACH BETRIEBSSYSTEM
    53. 6.53 SüDKOREA MARKTANALYSE NACH ANWENDUNG
    54. 6.54 SüDKOREA MARKTANALYSE NACH BEREITSTELLUNGSTYP
    55. 6.55 SüDKOREA MARKTANALYSE NACH ENDBENUTZER
    56. 6.56 SüDKOREA MARKTANALYSE NACH BETRIEBSSYSTEM
    57. 6.57 MALAYSIA MARKTANALYSE NACH ANWENDUNG
    58. 6.58 MALAYSIA MARKTANALYSE NACH BEREITSTELLUNGSTYP
    59. 6.59 MALAYSIA MARKTANALYSE NACH ENDBENUTZER
    60. 6.60 MALAYSIA MARKTANALYSE NACH BETRIEBSSYSTEM
    61. 6.61 THAILAND MARKTANALYSE NACH ANWENDUNG
    62. 6.62 THAILAND MARKTANALYSE NACH BEREITSTELLUNGSTYP
    63. 6.63 THAILAND MARKTANALYSE NACH ENDBENUTZER
    64. 6.64 THAILAND MARKTANALYSE NACH BETRIEBSSYSTEM
    65. 6.65 INDONESIEN MARKTANALYSE NACH ANWENDUNG
    66. 6.66 INDONESIEN MARKTANALYSE NACH BEREITSTELLUNGSTYP
    67. 6.67 INDONESIEN MARKTANALYSE NACH ENDBENUTZER
    68. 6.68 INDONESIEN MARKTANALYSE NACH BETRIEBSSYSTEM
    69. 6.69 REST VON APAC MARKTANALYSE NACH ANWENDUNG
    70. 6.70 REST VON APAC MARKTANALYSE NACH BEREITSTELLUNGSTYP
    71. 6.71 REST VON APAC MARKTANALYSE NACH ENDBENUTZER
    72. 6.72 REST VON APAC MARKTANALYSE NACH BETRIEBSSYSTEM
    73. 6.73 SÜDAMERIKA MARKTANALYSE
    74. 6.74 BRASILIEN MARKTANALYSE NACH ANWENDUNG
    75. 6.75 BRASILIEN MARKTANALYSE NACH BEREITSTELLUNGSTYP
    76. 6.76 BRASILIEN MARKTANALYSE NACH ENDBENUTZER
    77. 6.77 BRASILIEN MARKTANALYSE NACH BETRIEBSSYSTEM
    78. 6.78 MEXIKO MARKTANALYSE NACH ANWENDUNG
    79. 6.79 MEXIKO MARKTANALYSE NACH BEREITSTELLUNGSTYP
    80. 6.80 MEXIKO MARKTANALYSE NACH ENDBENUTZER
    81. 6.81 MEXIKO MARKTANALYSE NACH BETRIEBSSYSTEM
    82. 6.82 ARGENTINIEN MARKTANALYSE NACH ANWENDUNG
    83. 6.83 ARGENTINIEN MARKTANALYSE NACH BEREITSTELLUNGSTYP
    84. 6.84 ARGENTINIEN MARKTANALYSE NACH ENDBENUTZER
    85. 6.85 ARGENTINIEN MARKTANALYSE NACH BETRIEBSSYSTEM
    86. 6.86 REST VON SÜDAMERIKA MARKTANALYSE NACH ANWENDUNG
    87. 6.87 REST VON SÜDAMERIKA MARKTANALYSE NACH BEREITSTELLUNGSTYP
    88. 6.88 REST VON SÜDAMERIKA MARKTANALYSE NACH ENDBENUTZER
    89. 6.89 REST VON SÜDAMERIKA MARKTANALYSE NACH BETRIEBSSYSTEM
    90. 6.90 MEA MARKTANALYSE
    91. 6.91 GCC-LÄNDER MARKTANALYSE NACH ANWENDUNG
    92. 6.92 GCC-LÄNDER MARKTANALYSE NACH BEREITSTELLUNGSTYP
    93. 6.93 GCC-LÄNDER MARKTANALYSE NACH ENDBENUTZER
    94. 6.94 GCC-LÄNDER MARKTANALYSE NACH BETRIEBSSYSTEM
    95. 6.95 SÜDAFRIKA MARKTANALYSE NACH ANWENDUNG
    96. 6.96 SÜDAFRIKA MARKTANALYSE NACH BEREITSTELLUNGSTYP
    97. 6.97 SÜDAFRIKA MARKTANALYSE NACH ENDBENUTZER
    98. 6.98 SÜDAFRIKA MARKTANALYSE NACH BETRIEBSSYSTEM
    99. 6.99 REST VON MEA MARKTANALYSE NACH ANWENDUNG
    100. 6.100 REST VON MEA MARKTANALYSE NACH BEREITSTELLUNGSTYP
    101. 6.101 REST VON MEA MARKTANALYSE NACH ENDBENUTZER
    102. 6.102 REST VON MEA MARKTANALYSE NACH BETRIEBSSYSTEM
    103. 6.103 WICHTIGE KAUFKRITERIEN DER INFORMATIONEN UND KOMMUNIKATIONSTECHNOLOGIE
    104. 6.104 FORSCHUNGSPROZESS VON MRFR
    105. 6.105 DRO-ANALYSE DER INFORMATIONEN UND KOMMUNIKATIONSTECHNOLOGIE
    106. 6.106 TREIBERWIRKUNGSANALYSE: INFORMATIONEN UND KOMMUNIKATIONSTECHNOLOGIE
    107. 6.107 EINSCHRÄNKUNGENWIRKUNGSANALYSE: INFORMATIONEN UND KOMMUNIKATIONSTECHNOLOGIE
    108. 6.108 LIEFER-/WERTSCHÖPFUNGSKETTE: INFORMATIONEN UND KOMMUNIKATIONSTECHNOLOGIE
    109. 6.109 INFORMATIONEN UND KOMMUNIKATIONSTECHNOLOGIE, NACH ANWENDUNG, 2024 (% ANTEIL)
    110. 6.110 INFORMATIONEN UND KOMMUNIKATIONSTECHNOLOGIE, NACH ANWENDUNG, 2024 BIS 2035 (Milliarden USD)
    111. 6.111 INFORMATIONEN UND KOMMUNIKATIONSTECHNOLOGIE, NACH BEREITSTELLUNGSTYP, 2024 (% ANTEIL)
    112. 6.112 INFORMATIONEN UND KOMMUNIKATIONSTECHNOLOGIE, NACH BEREITSTELLUNGSTYP, 2024 BIS 2035 (Milliarden USD)
    113. 6.113 INFORMATIONEN UND KOMMUNIKATIONSTECHNOLOGIE, NACH ENDBENUTZER, 2024 (% ANTEIL)
    114. 6.114 INFORMATIONEN UND KOMMUNIKATIONSTECHNOLOGIE, NACH ENDBENUTZER, 2024 BIS 2035 (Milliarden USD)
    115. 6.115 INFORMATIONEN UND KOMMUNIKATIONSTECHNOLOGIE, NACH BETRIEBSSYSTEM, 2024 (% ANTEIL)
    116. 6.116 INFORMATIONEN UND KOMMUNIKATIONSTECHNOLOGIE, NACH BETRIEBSSYSTEM, 2024 BIS 2035 (Milliarden USD)
    117. 6.117 BENCHMARKING DER HAUPTWETTBEWERBER
  7. 7 LISTE DER TABELLEN
    1. 7.1 LISTE DER ANNAHMEN
    2. 7.2 NORDAMERIKA MARKTGRÖSSENSCHÄTZUNGEN; PROGNOSE
      1. 7.2.1 NACH ANWENDUNG, 2025-2035 (Milliarden USD)
      2. 7.2.2 NACH BEREITSTELLUNGSTYP, 2025-2035 (Milliarden USD)
      3. 7.2.3 NACH ENDBENUTZER, 2025-2035 (Milliarden USD)
      4. 7.2.4 NACH BETRIEBSSYSTEM, 2025-2035 (Milliarden USD)
    3. 7.3 USA MARKTGRÖSSENSCHÄTZUNGEN; PROGNOSE
      1. 7.3.1 NACH ANWENDUNG, 2025-2035 (Milliarden USD)
      2. 7.3.2 NACH BEREITSTELLUNGSTYP, 2025-2035 (Milliarden USD)
      3. 7.3.3 NACH ENDBENUTZER, 2025-2035 (Milliarden USD)
      4. 7.3.4 NACH BETRIEBSSYSTEM, 2025-2035 (Milliarden USD)
    4. 7.4 KANADA MARKTGRÖSSENSCHÄTZUNGEN; PROGNOSE
      1. 7.4.1 NACH ANWENDUNG, 2025-2035 (Milliarden USD)
      2. 7.4.2 NACH BEREITSTELLUNGSTYP, 2025-2035 (Milliarden USD)
      3. 7.4.3 NACH ENDBENUTZER, 2025-2035 (Milliarden USD)
      4. 7.4.4 NACH BETRIEBSSYSTEM, 2025-2035 (Milliarden USD)
    5. 7.5 EUROPA MARKTGRÖSSENSCHÄTZUNGEN; PROGNOSE
      1. 7.5.1 NACH ANWENDUNG, 2025-2035 (Milliarden USD)
      2. 7.5.2 NACH BEREITSTELLUNGSTYP, 2025-2035 (Milliarden USD)
      3. 7.5.3 NACH ENDBENUTZER, 2025-2035 (Milliarden USD)
      4. 7.5.4 NACH BETRIEBSSYSTEM, 2025-2035 (Milliarden USD)
    6. 7.6 DEUTSCHLAND MARKTGRÖSSENSCHÄTZUNGEN; PROGNOSE
      1. 7.6.1 NACH ANWENDUNG, 2025-2035 (Milliarden USD)
      2. 7.6.2 NACH BEREITSTELLUNGSTYP, 2025-2035 (Milliarden USD)
      3. 7.6.3 NACH ENDBENUTZER, 2025-2035 (Milliarden USD)
      4. 7.6.4 NACH BETRIEBSSYSTEM, 2025-2035 (Milliarden USD)
    7. 7.7 UK MARKTGRÖSSENSCHÄTZUNGEN; PROGNOSE
      1. 7.7.1 NACH ANWENDUNG, 2025-2035 (Milliarden USD)
      2. 7.7.2 NACH BEREITSTELLUNGSTYP, 2025-2035 (Milliarden USD)
      3. 7.7.3 NACH ENDBENUTZER, 2025-2035 (Milliarden USD)
      4. 7.7.4 NACH BETRIEBSSYSTEM, 2025-2035 (Milliarden USD)
    8. 7.8 FRANKREICH MARKTGRÖSSENSCHÄTZUNGEN; PROGNOSE
      1. 7.8.1 NACH ANWENDUNG, 2025-2035 (Milliarden USD)
      2. 7.8.2 NACH BEREITSTELLUNGSTYP, 2025-2035 (Milliarden USD)
      3. 7.8.3 NACH ENDBENUTZER, 2025-2035 (Milliarden USD)
      4. 7.8.4 NACH BETRIEBSSYSTEM, 2025-2035 (Milliarden USD)
    9. 7.9 RUSSLAND MARKTGRÖSSENSCHÄTZUNGEN; PROGNOSE
      1. 7.9.1 NACH ANWENDUNG, 2025-2035 (Milliarden USD)
      2. 7.9.2 NACH BEREITSTELLUNGSTYP, 2025-2035 (Milliarden USD)
      3. 7.9.3 NACH ENDBENUTZER, 2025-2035 (Milliarden USD)
      4. 7.9.4 NACH BETRIEBSSYSTEM, 2025-2035 (Milliarden USD)
    10. 7.10 ITALIEN MARKTGRÖSSENSCHÄTZUNGEN; PROGNOSE
      1. 7.10.1 NACH ANWENDUNG, 2025-2035 (Milliarden USD)
      2. 7.10.2 NACH BEREITSTELLUNGSTYP, 2025-2035 (Milliarden USD)
      3. 7.10.3 NACH ENDBENUTZER, 2025-2035 (Milliarden USD)
      4. 7.10.4 NACH BETRIEBSSYSTEM, 2025-2035 (Milliarden USD)
    11. 7.11 SPANIEN MARKTGRÖSSENSCHÄTZUNGEN; PROGNOSE
      1. 7.11.1 NACH ANWENDUNG, 2025-2035 (Milliarden USD)
      2. 7.11.2 NACH BEREITSTELLUNGSTYP, 2025-2035 (Milliarden USD)
      3. 7.11.3 NACH ENDBENUTZER, 2025-2035 (Milliarden USD)
      4. 7.11.4 NACH BETRIEBSSYSTEM, 2025-2035 (Milliarden USD)
    12. 7.12 REST VON EUROPA MARKTGRÖSSENSCHÄTZUNGEN; PROGNOSE
      1. 7.12.1 NACH ANWENDUNG, 2025-2035 (Milliarden USD)
      2. 7.12.2 NACH BEREITSTELLUNGSTYP, 2025-2035 (Milliarden USD)
      3. 7.12.3 NACH ENDBENUTZER, 2025-2035 (Milliarden USD)
      4. 7.12.4 NACH BETRIEBSSYSTEM, 2025-2035 (Milliarden USD)
    13. 7.13 APAC MARKTGRÖSSENSCHÄTZUNGEN; PROGNOSE
      1. 7.13.1 NACH ANWENDUNG, 2025-2035 (Milliarden USD)
      2. 7.13.2 NACH BEREITSTELLUNGSTYP, 2025-2035 (Milliarden USD)
      3. 7.13.3 NACH ENDBENUTZER, 2025-2035 (Milliarden USD)
      4. 7.13.4 NACH BETRIEBSSYSTEM, 2025-2035 (Milliarden USD)
    14. 7.14 CHINA MARKTGRÖSSENSCHÄTZUNGEN; PROGNOSE
      1. 7.14.1 NACH ANWENDUNG, 2025-2035 (Milliarden USD)
      2. 7.14.2 NACH BEREITSTELLUNGSTYP, 2025-2035 (Milliarden USD)
      3. 7.14.3 NACH ENDBENUTZER, 2025-2035 (Milliarden USD)
      4. 7.14.4 NACH BETRIEBSSYSTEM, 2025-2035 (Milliarden USD)
    15. 7.15 INDIEN MARKTGRÖSSENSCHÄTZUNGEN; PROGNOSE
      1. 7.15.1 NACH ANWENDUNG, 2025-2035 (Milliarden USD)
      2. 7.15.2 NACH BEREITSTELLUNGSTYP, 2025-2035 (Milliarden USD)
      3. 7.15.3 NACH ENDBENUTZER, 2025-2035 (Milliarden USD)
      4. 7.15.4 NACH BETRIEBSSYSTEM, 2025-2035 (Milliarden USD)
    16. 7.16 JAPAN MARKTGRÖSSENSCHÄTZUNGEN; PROGNOSE
      1. 7.16.1 NACH ANWENDUNG, 2025-2035 (Milliarden USD)
      2. 7.16.2 NACH BEREITSTELLUNGSTYP, 2025-2035 (Milliarden USD)
      3. 7.16.3 NACH ENDBENUTZER, 2025-2035 (Milliarden USD)
      4. 7.16.4 NACH BETRIEBSSYSTEM, 2025-2035 (Milliarden USD)
    17. 7.17 SüDKOREA MARKTGRÖSSENSCHÄTZUNGEN; PROGNOSE
      1. 7.17.1 NACH ANWENDUNG, 2025-2035 (Milliarden USD)
      2. 7.17.2 NACH BEREITSTELLUNGSTYP, 2025-2035 (Milliarden USD)
      3. 7.17.3 NACH ENDBENUTZER, 2025-2035 (Milliarden USD)
      4. 7.17.4 NACH BETRIEBSSYSTEM, 2025-2035 (Milliarden USD)
    18. 7.18 MALAYSIA MARKTGRÖSSENSCHÄTZUNGEN; PROGNOSE
      1. 7.18.1 NACH ANWENDUNG, 2025-2035 (Milliarden USD)
      2. 7.18.2 NACH BEREITSTELLUNGSTYP, 2025-2035 (Milliarden USD)
      3. 7.18.3 NACH ENDBENUTZER, 2025-2035 (Milliarden USD)
      4. 7.18.4 NACH BETRIEBSSYSTEM, 2025-2035 (Milliarden USD)
    19. 7.19 THAILAND MARKTGRÖSSENSCHÄTZUNGEN; PROGNOSE
      1. 7.19.1 NACH ANWENDUNG, 2025-2035 (Milliarden USD)
      2. 7.19.2 NACH BEREITSTELLUNGSTYP, 2025-2035 (Milliarden USD)
      3. 7.19.3 NACH ENDBENUTZER, 2025-2035 (Milliarden USD)
      4. 7.19.4 NACH BETRIEBSSYSTEM, 2025-2035 (Milliarden USD)
    20. 7.20 INDONESIEN MARKTGRÖSSENSCHÄTZUNGEN; PROGNOSE
      1. 7.20.1 NACH ANWENDUNG, 2025-2035 (Milliarden USD)
      2. 7.20.2 NACH BEREITSTELLUNGSTYP, 2025-2035 (Milliarden USD)
      3. 7.20.3 NACH ENDBENUTZER, 2025-2035 (Milliarden USD)
      4. 7.20.4 NACH BETRIEBSSYSTEM, 2025-2035 (Milliarden USD)
    21. 7.21 REST VON APAC MARKTGRÖSSENSCHÄTZUNGEN; PROGNOSE
      1. 7.21.1 NACH ANWENDUNG, 2025-2035 (Milliarden USD)
      2. 7.21.2 NACH BEREITSTELLUNGSTYP, 2025-2035 (Milliarden USD)
      3. 7.21.3 NACH ENDBENUTZER, 2025-2035 (Milliarden USD)
      4. 7.21.4 NACH BETRIEBSSYSTEM, 2025-2035 (Milliarden USD)
    22. 7.22 SÜDAMERIKA MARKTGRÖSSENSCHÄTZUNGEN; PROGNOSE
      1. 7.22.1 NACH ANWENDUNG, 2025-2035 (Milliarden USD)
      2. 7.22.2 NACH BEREITSTELLUNGSTYP, 2025-2035 (Milliarden USD)
      3. 7.22.3 NACH ENDBENUTZER, 2025-2035 (Milliarden USD)
      4. 7.22.4 NACH BETRIEBSSYSTEM, 2025-2035 (Milliarden USD)
    23. 7.23 BRASILIEN MARKTGRÖSSENSCHÄTZUNGEN; PROGNOSE
      1. 7.23.1 NACH ANWENDUNG, 2025-2035 (Milliarden USD)
      2. 7.23.2 NACH BEREITSTELLUNGSTYP, 2025-2035 (Milliarden USD)
      3. 7.23.3 NACH ENDBENUTZER, 2025-2035 (Milliarden USD)
      4. 7.23.4 NACH BETRIEBSSYSTEM, 2025-2035 (Milliarden USD)
    24. 7.24 MEXIKO MARKTGRÖSSENSCHÄTZUNGEN; PROGNOSE
      1. 7.24.1 NACH ANWENDUNG, 2025-2035 (Milliarden USD)
      2. 7.24.2 NACH BEREITSTELLUNGSTYP, 2025-2035 (Milliarden USD)
      3. 7.24.3 NACH ENDBENUTZER, 2025-2035 (Milliarden USD)
      4. 7.24.4 NACH BETRIEBSSYSTEM, 2025-2035 (Milliarden USD)
    25. 7.25 ARGENTINIEN MARKTGRÖSSENSCHÄTZUNGEN; PROGNOSE
      1. 7.25.1 NACH ANWENDUNG, 2025-2035 (Milliarden USD)
      2. 7.25.2 NACH BEREITSTELLUNGSTYP, 2025-2035 (Milliarden USD)
      3. 7.25.3 NACH ENDBENUTZER, 2025-2035 (Milliarden USD)
      4. 7.25.4 NACH BETRIEBSSYSTEM, 2025-2035 (Milliarden USD)
    26. 7.26 REST VON SÜDAMERIKA MARKTGRÖSSENSCHÄTZUNGEN; PROGNOSE
      1. 7.26.1 NACH ANWENDUNG, 2025-2035 (Milliarden USD)
      2. 7.26.2 NACH BEREITSTELLUNGSTYP, 2025-2035 (Milliarden USD)
      3. 7.26.3 NACH ENDBENUTZER, 2025-2035 (Milliarden USD)
      4. 7.26.4 NACH BETRIEBSSYSTEM, 2025-2035 (Milliarden USD)
    27. 7.27 MEA MARKTGRÖSSENSCHÄTZUNGEN; PROGNOSE
      1. 7.27.1 NACH ANWENDUNG, 2025-2035 (Milliarden USD)
      2. 7.27.2 NACH BEREITSTELLUNGSTYP, 2025-2035 (Milliarden USD)
      3. 7.27.3 NACH ENDBENUTZER, 2025-2035 (Milliarden USD)
      4. 7.27.4 NACH BETRIEBSSYSTEM, 2025-2035 (Milliarden USD)
    28. 7.28 GCC-LÄNDER MARKTGRÖSSENSCHÄTZUNGEN; PROGNOSE
      1. 7.28.1 NACH ANWENDUNG, 2025-2035 (Milliarden USD)
      2. 7.28.2 NACH BEREITSTELLUNGSTYP, 2025-2035 (Milliarden USD)
      3. 7.28.3 NACH ENDBENUTZER, 2025-2035 (Milliarden USD)
      4. 7.28.4 NACH BETRIEBSSYSTEM, 2025-2035 (Milliarden USD)
    29. 7.29 SÜDAFRIKA MARKTGRÖSSENSCHÄTZUNGEN; PROGNOSE
      1. 7.29.1 NACH ANWENDUNG, 2025-2035 (Milliarden USD)
      2. 7.29.2 NACH BEREITSTELLUNGSTYP, 2025-2035 (Milliarden USD)
      3. 7.29.3 NACH ENDBENUTZER, 2025-2035 (Milliarden USD)
      4. 7.29.4 NACH BETRIEBSSYSTEM, 2025-2035 (Milliarden USD)
    30. 7.30 REST VON MEA MARKTGRÖSSENSCHÄTZUNGEN; PROGNOSE
      1. 7.30.1 NACH ANWENDUNG, 2025-2035 (Milliarden USD)
      2. 7.30.2 NACH BEREITSTELLUNGSTYP, 2025-2035 (Milliarden USD)
      3. 7.30.3 NACH ENDBENUTZER, 2025-2035 (Milliarden USD)
      4. 7.30.4 NACH BETRIEBSSYSTEM, 2025-2035 (Milliarden USD)
    31. 7.31 PRODUKTEINFÜHRUNG/PRODUKTENTWICKLUNG/GENEHMIGUNG
    32. 7.32 AKQUISITION/PARTNERSCHAFT
Marktsegmentierung der Workstation-Software
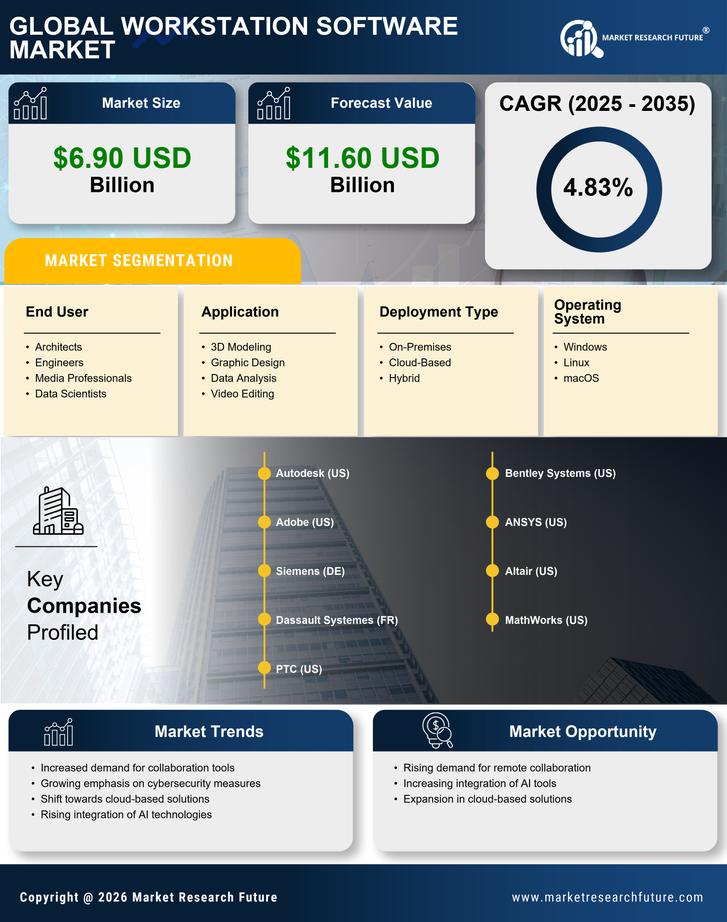
  • Markt für Workstation-Software nach Anwendung (Milliarden USD, 2019-2032)

    • 3D-Modellierung

    • Grafikdesign

    • Datenanalyse

    • Video-Bearbeitung

  • Markt für Workstation-Software nach Bereitstellungstyp (Milliarden USD, 2019-2032)

    • Vor Ort

    • Cloud-basiert

    • Hybrid

  • Markt für Workstation-Software nach Endbenutzer (Milliarden USD, 2019-2032)

    • Architekten

    • Ingenieure

    • Medienprofis

    • Datenwissenschaftler

  • Markt für Workstation-Software nach Betriebssystem (Milliarden USD, 2019-2032)

    • Windows

    • Linux

    • macOS

  • Markt für Workstation-Software nach Region (Milliarden USD, 2019-2032)

    • Nordamerika

    • Europa

    • Südamerika

    • Asien-Pazifik

    • Mittlerer Osten und Afrika

Regionale Perspektive des Marktes für Workstation-Software (Milliarden USD, 2019-2032)
  • Perspektive Nordamerika (Milliarden USD, 2019-2032)

    • Markt für Workstation-Software in Nordamerika nach Anwendungstyp

      • 3D-Modellierung

      • Grafikdesign

      • Datenanalyse

      • Video-Bearbeitung

    • Markt für Workstation-Software in Nordamerika nach Bereitstellungstyp

      • Vor Ort

      • Cloud-basiert

      • Hybrid

    • Markt für Workstation-Software in Nordamerika nach Endbenutzertyp

      • Architekten

      • Ingenieure

      • Medienprofis

      • Datenwissenschaftler

    • Markt für Workstation-Software in Nordamerika nach Betriebssystemtyp

      • Windows

      • Linux

      • macOS

    • Markt für Workstation-Software in Nordamerika nach regionalem Typ

      • USA

      • Kanada

    • Perspektive USA (Milliarden USD, 2019-2032)

    • Markt für Workstation-Software in den USA nach Anwendungstyp

      • 3D-Modellierung

      • Grafikdesign

      • Datenanalyse

      • Video-Bearbeitung

    • Markt für Workstation-Software in den USA nach Bereitstellungstyp

      • Vor Ort

      • Cloud-basiert

      • Hybrid

    • Markt für Workstation-Software in den USA nach Endbenutzertyp

      • Architekten

      • Ingenieure

      • Medienprofis

      • Datenwissenschaftler

    • Markt für Workstation-Software in den USA nach Betriebssystemtyp

      • Windows

      • Linux

      • macOS

    • Perspektive KANADA (Milliarden USD, 2019-2032)

    • Markt für Workstation-Software in KANADA nach Anwendungstyp

      • 3D-Modellierung

      • Grafikdesign

      • Datenanalyse

      • Video-Bearbeitung

    • Markt für Workstation-Software in KANADA nach Bereitstellungstyp

      • Vor Ort

      • Cloud-basiert

      • Hybrid

    • Markt für Workstation-Software in KANADA nach Endbenutzertyp

      • Architekten

      • Ingenieure

      • Medienprofis

      • Datenwissenschaftler

    • Markt für Workstation-Software in KANADA nach Betriebssystemtyp

      • Windows

      • Linux

      • macOS

  • Perspektive Europa (Milliarden USD, 2019-2032)

    • Markt für Workstation-Software in Europa nach Anwendungstyp

      • 3D-Modellierung

      • Grafikdesign

      • Datenanalyse

      • Video-Bearbeitung

    • Markt für Workstation-Software in Europa nach Bereitstellungstyp

      • Vor Ort

      • Cloud-basiert

      • Hybrid

    • Markt für Workstation-Software in Europa nach Endbenutzertyp

      • Architekten

      • Ingenieure

      • Medienprofis

      • Datenwissenschaftler

    • Markt für Workstation-Software in Europa nach Betriebssystemtyp

      • Windows

      • Linux

      • macOS

    • Markt für Workstation-Software in Europa nach regionalem Typ

      • Deutschland

      • Vereinigtes Königreich

      • Frankreich

      • Russland

      • Italien

      • Spanien

      • Rest von Europa

    • Perspektive DEUTSCHLAND (Milliarden USD, 2019-2032)

    • Markt für Workstation-Software in DEUTSCHLAND nach Anwendungstyp

      • 3D-Modellierung

      • Grafikdesign

      • Datenanalyse

      • Video-Bearbeitung

    • Markt für Workstation-Software in DEUTSCHLAND nach Bereitstellungstyp

      • Vor Ort

      • Cloud-basiert

      • Hybrid

    • Markt für Workstation-Software in DEUTSCHLAND nach Endbenutzertyp

      • Architekten

      • Ingenieure

      • Medienprofis

      • Datenwissenschaftler

    • Markt für Workstation-Software in DEUTSCHLAND nach Betriebssystemtyp

      • Windows

      • Linux

      • macOS

    • Perspektive VEREINIGTES KÖNIGREICH (Milliarden USD, 2019-2032)

    • Markt für Workstation-Software im VEREINIGTEN KÖNIGREICH nach Anwendungstyp

      • 3D-Modellierung

      • Grafikdesign

      • Datenanalyse

      • Video-Bearbeitung

    • Markt für Workstation-Software im VEREINIGTEN KÖNIGREICH nach Bereitstellungstyp

      • Vor Ort

      • Cloud-basiert

      • Hybrid

    • Markt für Workstation-Software im VEREINIGTEN KÖNIGREICH nach Endbenutzertyp

      • Architekten

      • Ingenieure

      • Medienprofis

      • Datenwissenschaftler

    • Markt für Workstation-Software im VEREINIGTEN KÖNIGREICH nach Betriebssystemtyp

      • Windows

      • Linux

      • macOS

    • Perspektive FRANKREICH (Milliarden USD, 2019-2032)

    • Markt für Workstation-Software in FRANKREICH nach Anwendungstyp

      • 3D-Modellierung

      • Grafikdesign

      • Datenanalyse

      • Video-Bearbeitung

    • Markt für Workstation-Software in FRANKREICH nach Bereitstellungstyp

      • Vor Ort

      • Cloud-basiert

      • Hybrid

    • Markt für Workstation-Software in FRANKREICH nach Endbenutzertyp

      • Architekten

      • Ingenieure

      • Medienprofis

      • Datenwissenschaftler

    • Markt für Workstation-Software in FRANKREICH nach Betriebssystemtyp

      • Windows

      • Linux

      • macOS

    • Perspektive RUSSLAND (Milliarden USD, 2019-2032)

    • Markt für Workstation-Software in RUSSLAND nach Anwendungstyp

      • 3D-Modellierung

      • Grafikdesign

      • Datenanalyse

      • Video-Bearbeitung

    • Markt für Workstation-Software in RUSSLAND nach Bereitstellungstyp

      • Vor Ort

      • Cloud-basiert

      • Hybrid

    • Markt für Workstation-Software in RUSSLAND nach Endbenutzertyp

      • Architekten

      • Ingenieure

      • Medienprofis

      • Datenwissenschaftler

    • Markt für Workstation-Software in RUSSLAND nach Betriebssystemtyp

      • Windows

      • Linux

      • macOS

    • Perspektive ITALIEN (Milliarden USD, 2019-2032)

    • Markt für Workstation-Software in ITALIEN nach Anwendungstyp

      • 3D-Modellierung

      • Grafikdesign

      • Datenanalyse

      • Video-Bearbeitung

    • Markt für Workstation-Software in ITALIEN nach Bereitstellungstyp

      • Vor Ort

      • Cloud-basiert

      • Hybrid

    • Markt für Workstation-Software in ITALIEN nach Endbenutzertyp

      • Architekten

      • Ingenieure

      • Medienprofis

      • Datenwissenschaftler

    • Markt für Workstation-Software in ITALIEN nach Betriebssystemtyp

      • Windows

      • Linux

      • macOS

    • Perspektive SPANIEN (Milliarden USD, 2019-2032)

    • Markt für Workstation-Software in SPANIEN nach Anwendungstyp

      • 3D-Modellierung

      • Grafikdesign

      • Datenanalyse

      • Video-Bearbeitung

    • Markt für Workstation-Software in SPANIEN nach Bereitstellungstyp

      • Vor Ort

      • Cloud-basiert

      • Hybrid

    • Markt für Workstation-Software in SPANIEN nach Endbenutzertyp

      • Architekten

      • Ingenieure

      • Medienprofis

      • Datenwissenschaftler

    • Markt für Workstation-Software in SPANIEN nach Betriebssystemtyp

      • Windows

      • Linux

      • macOS

    • Perspektive REST VON EUROPA (Milliarden USD, 2019-2032)

    • Markt für Workstation-Software in REST VON EUROPA nach Anwendungstyp

      • 3D-Modellierung

      • Grafikdesign

      • Datenanalyse

      • Video-Bearbeitung

    • Markt für Workstation-Software in REST VON EUROPA nach Bereitstellungstyp

      • Vor Ort

      • Cloud-basiert

      • Hybrid

    • Markt für Workstation-Software in REST VON EUROPA nach Endbenutzertyp

      • Architekten

      • Ingenieure

      • Medienprofis

      • Datenwissenschaftler

    • Markt für Workstation-Software in REST VON EUROPA nach Betriebssystemtyp

      • Windows

      • Linux

      • macOS

  • Perspektive APAC (Milliarden USD, 2019-2032)

    • Markt für Workstation-Software in APAC nach Anwendungstyp

      • 3D-Modellierung

      • Grafikdesign

      • Datenanalyse

      • Video-Bearbeitung

    • Markt für Workstation-Software in APAC nach Bereitstellungstyp

      • Vor Ort

      • Cloud-basiert

      • Hybrid

    • Markt für Workstation-Software in APAC nach Endbenutzertyp

      • Architekten

      • Ingenieure

      • Medienprofis

      • Datenwissenschaftler

    • Markt für Workstation-Software in APAC nach Betriebssystemtyp

      • Windows

      • Linux

      • macOS

    • Markt für Workstation-Software in APAC nach regionalem Typ

      • China

      • Indien

      • Japan

      • Südkorea

      • Malaysia

      • Thailand

      • Indonesien

      • Rest von APAC

    • Perspektive CHINA (Milliarden USD, 2019-2032)

    • Markt für Workstation-Software in CHINA nach Anwendungstyp

      • 3D-Modellierung

      • Grafikdesign

      • Datenanalyse

      • Video-Bearbeitung

    • Markt für Workstation-Software in CHINA nach Bereitstellungstyp

      • Vor Ort

      • Cloud-basiert

      • Hybrid

    • Markt für Workstation-Software in CHINA nach Endbenutzertyp

      • Architekten

      • Ingenieure

      • Medienprofis

      • Datenwissenschaftler

    • Markt für Workstation-Software in CHINA nach Betriebssystemtyp

      • Windows

      • Linux

      • macOS

    • Perspektive INDIEN (Milliarden USD, 2019-2032)

    • Markt für Workstation-Software in INDIEN nach Anwendungstyp

      • 3D-Modellierung

      • Grafikdesign

      • Datenanalyse

      • Video-Bearbeitung

    • Markt für Workstation-Software in INDIEN nach Bereitstellungstyp

      • Vor Ort

      • Cloud-basiert

      • Hybrid

    • Markt für Workstation-Software in INDIEN nach Endbenutzertyp

      • Architekten

      • Ingenieure

      • Medienprofis

      • Datenwissenschaftler

    • Markt für Workstation-Software in INDIEN nach Betriebssystemtyp

      • Windows

      • Linux

      • macOS

    • Perspektive JAPAN (Milliarden USD, 2019-2032)

    • Markt für Workstation-Software in JAPAN nach Anwendungstyp

      • 3D-Modellierung

      • Grafikdesign

      • Datenanalyse

      • Video-Bearbeitung

    • Markt für Workstation-Software in JAPAN nach Bereitstellungstyp

      • Vor Ort

      • Cloud-basiert

      • Hybrid

    • Markt für Workstation-Software in JAPAN nach Endbenutzertyp

      • Architekten

      • Ingenieure

      • Medienprofis

      • Datenwissenschaftler

    • Markt für Workstation-Software in JAPAN nach Betriebssystemtyp

      • Windows

      • Linux

      • macOS

    • Perspektive SÜDKOREA (Milliarden USD, 2019-2032)

    • Markt für Workstation-Software in SÜDKOREA nach Anwendungstyp

      • 3D-Modellierung

      • Grafikdesign

      • Datenanalyse

      • Video-Bearbeitung

    • Markt für Workstation-Software in SÜDKOREA nach Bereitstellungstyp

      • Vor Ort

      • Cloud-basiert

      • Hybrid

    • Markt für Workstation-Software in SÜDKOREA nach Endbenutzertyp

      • Architekten

      • Ingenieure

      • Medienprofis

      • Datenwissenschaftler

    • Markt für Workstation-Software in SÜDKOREA nach Betriebssystemtyp

      • Windows

      • Linux

      • macOS

    • Perspektive MALAYSIA (Milliarden USD, 2019-2032)

    • Markt für Workstation-Software in MALAYSIA nach Anwendungstyp

      • 3D-Modellierung

      • Grafikdesign

      • Datenanalyse

      • Video-Bearbeitung

    • Markt für Workstation-Software in MALAYSIA nach Bereitstellungstyp

      • Vor Ort

      • Cloud-basiert

      • Hybrid

    • Markt für Workstation-Software in MALAYSIA nach Endbenutzertyp

      • Architekten

      • Ingenieure

      • Medienprofis

      • Datenwissenschaftler

    • Markt für Workstation-Software in MALAYSIA nach Betriebssystemtyp

      • Windows

      • Linux

      • macOS

    • Perspektive THAILAND (Milliarden USD, 2019-2032)

    • Markt für Workstation-Software in THAILAND nach Anwendungstyp

      • 3D-Modellierung

      • Grafikdesign

      • Datenanalyse

      • Video-Bearbeitung

    • Markt für Workstation-Software in THAILAND nach Bereitstellungstyp

      • Vor Ort

      • Cloud-basiert

      • Hybrid

    • Markt für Workstation-Software in THAILAND nach Endbenutzertyp

      • Architekten

      • Ingenieure

      • Medienprofis

      • Datenwissenschaftler

    • Markt für Workstation-Software in THAILAND nach Betriebssystemtyp

      • Windows

      • Linux

      • macOS

    • Perspektive INDONESIEN (Milliarden USD, 2019-2032)

    • Markt für Workstation-Software in INDONESIEN nach Anwendungstyp

      • 3D-Modellierung

      • Grafikdesign

      • Datenanalyse

      • Video-Bearbeitung

    • Markt für Workstation-Software in INDONESIEN nach Bereitstellungstyp

      • Vor Ort

      • Cloud-basiert

      • Hybrid

    • Markt für Workstation-Software in INDONESIEN nach Endbenutzertyp

      • Architekten

      • Ingenieure

      • Medienprofis

      • Datenwissenschaftler

    • Markt für Workstation-Software in INDONESIEN nach Betriebssystemtyp

      • Windows

      • Linux

      • macOS

    • Perspektive REST VON APAC (Milliarden USD, 2019-2032)

    • Markt für Workstation-Software in REST VON APAC nach Anwendungstyp

      • 3D-Modellierung

      • Grafikdesign

      • Datenanalyse

      • Video-Bearbeitung

    • Markt für Workstation-Software in REST VON APAC nach Bereitstellungstyp

      • Vor Ort

      • Cloud-basiert

      • Hybrid

    • Markt für Workstation-Software in REST VON APAC nach Endbenutzertyp

      • Architekten

      • Ingenieure

      • Medienprofis

      • Datenwissenschaftler

    • Markt für Workstation-Software in REST VON APAC nach Betriebssystemtyp

      • Windows

      • Linux

      • macOS

  • Perspektive Südamerika (Milliarden USD, 2019-2032)

    • Markt für Workstation-Software in Südamerika nach Anwendungstyp

      • 3D-Modellierung

      • Grafikdesign

      • Datenanalyse

      • Video-Bearbeitung

    • Markt für Workstation-Software in Südamerika nach Bereitstellungstyp

      • Vor Ort

      • Cloud-basiert

      • Hybrid

    • Markt für Workstation-Software in Südamerika nach Endbenutzertyp

      • Architekten

      • Ingenieure

      • Medienprofis

      • Datenwissenschaftler

    • Markt für Workstation-Software in Südamerika nach Betriebssystemtyp

      • Windows

      • Linux

      • macOS

    • Markt für Workstation-Software in Südamerika nach regionalem Typ

      • Brasilien

      • Mexiko

      • Argentinien

      • Rest von Südamerika

    • Perspektive BRASILIEN (Milliarden USD, 2019-2032)

    • Markt für Workstation-Software in BRASILIEN nach Anwendungstyp

      • 3D-Modellierung

      • Grafikdesign

      • Datenanalyse

      • Video-Bearbeitung

    • Markt für Workstation-Software in BRASILIEN nach Bereitstellungstyp

      • Vor Ort

      • Cloud-basiert

      • Hybrid

    • Markt für Workstation-Software in BRASILIEN nach Endbenutzertyp

      • Architekten

      • Ingenieure

      • Medienprofis

      • Datenwissenschaftler

    • Markt für Workstation-Software in BRASILIEN nach Betriebssystemtyp

      • Windows

      • Linux

      • macOS

    • Perspektive MEXIKO (Milliarden USD, 2019-2032)

    • Markt für Workstation-Software in MEXIKO nach Anwendungstyp

      • 3D-Modellierung

      • Grafikdesign

      • Datenanalyse

      • Video-Bearbeitung

    • Markt für Workstation-Software in MEXIKO nach Bereitstellungstyp

      • Vor Ort

      • Cloud-basiert

      • Hybrid

    • Markt für Workstation-Software in MEXIKO nach Endbenutzertyp

      • Architekten

      • Ingenieure

      • Medienprofis

      • Datenwissenschaftler

    • Markt für Workstation-Software in MEXIKO nach Betriebssystemtyp

      • Windows

      • Linux

      • macOS

    • Perspektive ARGENTINIEN (Milliarden USD, 2019-2032)

    • Markt für Workstation-Software in ARGENTINIEN nach Anwendungstyp

      • 3D-Modellierung

      • Grafikdesign

      • Datenanalyse

      • Video-Bearbeitung

    • Markt für Workstation-Software in ARGENTINIEN nach Bereitstellungstyp

      • Vor Ort

      • Cloud-basiert

      • Hybrid

    • Markt für Workstation-Software in ARGENTINIEN nach Endbenutzertyp

      • Architekten

      • Ingenieure

      • Medienprofis

      • Datenwissenschaftler

    • Markt für Workstation-Software in ARGENTINIEN nach Betriebssystemtyp

      • Windows

      • Linux

      • macOS

    • Perspektive REST VON SÜDAMERIKA (Milliarden USD, 2019-2032)

    • Markt für Workstation-Software in REST VON SÜDAMERIKA nach Anwendungstyp

      • 3D-Modellierung

      • Grafikdesign

      • Datenanalyse

      • Video-Bearbeitung

    • Markt für Workstation-Software in REST VON SÜDAMERIKA nach Bereitstellungstyp

      • Vor Ort

      • Cloud-basiert

      • Hybrid

    • Markt für Workstation-Software in REST VON SÜDAMERIKA nach Endbenutzertyp

      • Architekten

      • Ingenieure

      • Medienprofis

      • Datenwissenschaftler

    • Markt für Workstation-Software in REST VON SÜDAMERIKA nach Betriebssystemtyp

      • Windows

      • Linux

      • macOS

  • Perspektive MEA (Milliarden USD, 2019-2032)

    • Markt für Workstation-Software in MEA nach Anwendungstyp

      • 3D-Modellierung

      • Grafikdesign

      • Datenanalyse

      • Video-Bearbeitung

    • Markt für Workstation-Software in MEA nach Bereitstellungstyp

      • Vor Ort

      • Cloud-basiert

      • Hybrid

    • Markt für Workstation-Software in MEA nach Endbenutzertyp

      • Architekten

      • Ingenieure

      • Medienprofis

      • Datenwissenschaftler

    • Markt für Workstation-Software in MEA nach Betriebssystemtyp

      • Windows

      • Linux

      • macOS

    • Markt für Workstation-Software in MEA nach regionalem Typ

      • GCC-Staaten

      • Südafrika

      • Rest von MEA

    • Perspektive GCC-STÄDTE (Milliarden USD, 2019-2032)

    • Markt für Workstation-Software in GCC-STÄDTE nach Anwendungstyp

      • 3D-Modellierung

      • Grafikdesign

      • Datenanalyse

      • Video-Bearbeitung

    • Markt für Workstation-Software in GCC-STÄDTE nach Bereitstellungstyp

      • Vor Ort

      • Cloud-basiert

      • Hybrid

    • Markt für Workstation-Software in GCC-STÄDTE nach Endbenutzertyp

      • Architekten

      • Ingenieure

      • Medienprofis

      • Datenwissenschaftler

    • Markt für Workstation-Software in GCC-STÄDTE nach Betriebssystemtyp

      • Windows

      • Linux

      • macOS

    • Perspektive SÜDAFRIKA (Milliarden USD, 2019-2032)

    • Markt für Workstation-Software in SÜDAFRIKA nach Anwendungstyp

      • 3D-Modellierung

      • Grafikdesign

      • Datenanalyse

      • Video-Bearbeitung

    • Markt für Workstation-Software in SÜDAFRIKA nach Bereitstellungstyp

      • Vor Ort

      • Cloud-basiert

      • Hybrid

    • Markt für Workstation-Software in SÜDAFRIKA nach Endbenutzertyp

      • Architekten

      • Ingenieure

      • Medienprofis

      • Datenwissenschaftler

    • Markt für Workstation-Software in SÜDAFRIKA nach Betriebssystemtyp

      • Windows

      • Linux

      • macOS

    • Perspektive REST VON MEA (Milliarden USD, 2019-2032)

    • Markt für Workstation-Software in REST VON MEA nach Anwendungstyp

      • 3D-Modellierung

      • Grafikdesign

      • Datenanalyse

      • Video-Bearbeitung

    • Markt für Workstation-Software in REST VON MEA nach Bereitstellungstyp

      • Vor Ort

      • Cloud-basiert

      • Hybrid

    • Markt für Workstation-Software in REST VON MEA nach Endbenutzertyp

      • Architekten

      • Ingenieure

      • Medienprofis

      • Datenwissenschaftler

    • Markt für Workstation-Software in REST VON MEA nach Betriebssystemtyp

      • Windows

      • Linux

      • macOS

Compare Licence

×
Features License Type
Single User Multiuser License Enterprise User
Price $4,950 $5,950 $7,250
Maximum User Access Limit 1 User Upto 10 Users Unrestricted Access Throughout the Organization
Free Customization
Direct Access to Analyst
Deliverable Format
Platform Access
Discount on Next Purchase 10% 15% 15%
Printable Versions