
South Africa AdBlue Oil Market
Informationen zum südafrikanischen Adblue-Marktforschungsbericht nach Anwendung (Automobilindustrie, Baumaschinen, Landmaschinen, elektronische Generatoren, Eisenbahnmotoren und andere) – Marktprognose bis 2032

- 1 Zusammenfassung
-
2 Markteinführung
- 2.1 Definition 12
- 2.2 Umfang der Studie 12
- 2.3 Liste der Annahmen 12
- 2.4 Marktstruktur 13
-
3 Forschungsmethodik
- 3.1 Forschungsprozess 15
- 3.2 Primärforschung 15
- 3.3 Sekundärforschung 16
- 3.4 Schätzung der Marktgröße 17
- 3.5 Prognosemodell 18
-
4 Marktdynamik
- 4.1 Einleitung 20
-
4.2 Treiberanalyse 21
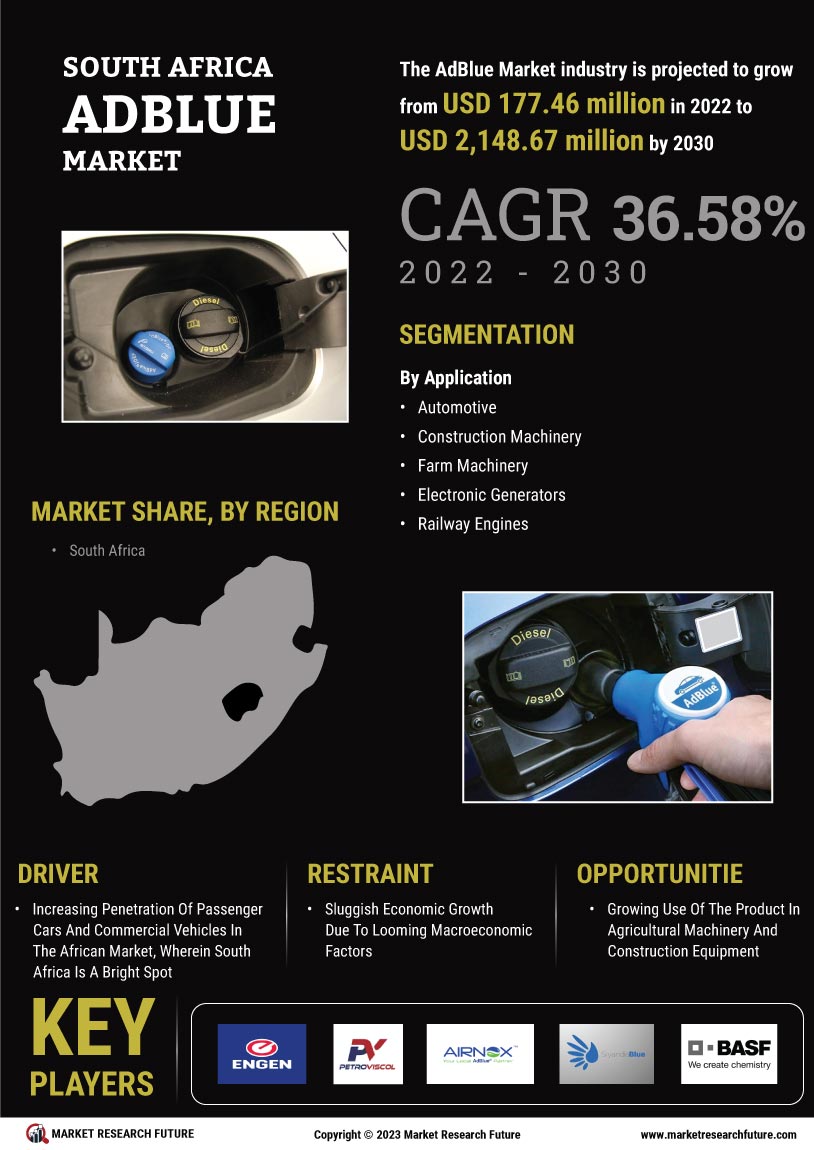
- 4.2.1 Zunehmende Durchdringung des afrikanischen Marktes mit Personenkraftwagen und Nutzfahrzeugen, wobei Südafrika ein Lichtblick ist 21
- 4.2.2 Allmähliche Übernahme der globalen Emissionsreduktionsnormen 22
-
4.3 Hemmnisanalyse 24
- 4.3.1 Schwache Konjunktur Wachstum aufgrund drohender makroökonomischer Faktoren 24
-
4.4 Chancen 24
- 4.4.1 Zunehmende Verwendung des Produkts in Landmaschinen und Baugeräten 24
-
4.5 Herausforderungen 25
- 4.5.1 Schwankende Harnstoffpreise, die stark von den globalen Trends beeinflusst werden 25
-
5 Marktfaktoranalyse
-
5.1 Lieferkettenanalyse 27
- 5.1.1 Rohstoff 27
- 5.1.2 AdBlue-Hersteller 27
- 5.1.3 Vertriebskanal 27
- 5.1.4 Anwendungen 28
-
5.2 Porters Fünf-Kräfte-Modell 28
- 5.2.1 Bedrohung durch neue Marktteilnehmer 28
- 5.2.2 Bedrohung durch Konkurrenz 28
- 5.2.3 Bedrohung durch Ersatzprodukte 28
- 5.2.4 Verhandlungsmacht des Lieferanten 29
- 5.2.5 Verhandlungsmacht des Käufers 29
-
5.1 Lieferkettenanalyse 27
-
6 Südafrikanischer AdBlue-Markt, nach Technologie
- 6.1 Einleitung 31
- 6.2 Abgasrückführung 32
- 6.3 Selektive katalytische Reduktion 33
-
7 Südafrikanischer AdBlue-Markt, nach Anwendung
- 7.1 Einleitung 35
- 7.2 Automobilindustrie 37
- 7.3 Landmaschinen 38
- 7.4 Baumaschinen 38
- 7.5 Elektronische Generatoren 38
- 7.6 Eisenbahnmotoren 38
- 7.7 Sonstige 38
-
8 Wettbewerbslandschaft
- 8.1 Einleitung 40
- 8.2 Analyse der wichtigsten Entwicklungen 40
-
9 Unternehmensprofile
-
9.1 BASF SE 43
- 9.1.1 Unternehmensübersicht 43
- 9.1.2 Finanzübersicht 43
- 9.1.3 Produkte Angebote 44
- 9.1.4 Wichtige Entwicklungen 44
- 9.1.5 SWOT-Analyse 44
- 9.1.6 Schlüsselstrategie 44
-
9.2 Engen Petroleum Ltd. 45
- 9.2.1 Unternehmensübersicht 45
- 9.2.2 Finanzübersicht 45
- 9.2.3 Produktangebote 45
- 9.2.4 Wichtige Entwicklungen 46
- 9.2.5 SWOT-Analyse 46
- 9.2.6 Schlüsselstrategie 46
-
9.3 Viscol.Co.Za. 47
- 9.3.1 Unternehmensübersicht 47
- 9.3.2 Finanzübersicht 47
- 9.3.3 Produktangebot 47
- 9.3.4 Wichtige Entwicklungen 47
- 9.3.5 Schlüsselstrategie 47
-
9.1 BASF SE 43
-
10 Schlussfolgerung
-
10.1 Wichtige Ergebnisse 49
- 10.1.1 Sicht des CEO 49
-
10.1 Wichtige Ergebnisse 49
-
11 Tabellenverzeichnis
- TABELLE 1 MARKTÜBERSICHT 10
- TABELLE 2 LISTE DER ANNAHMEN 12
- TABELLE 3 SÜDAFRIKA: ADBLUE-MARKT NACH TECHNOLOGIE (MIO. USD) (2022–2030) 31
- TABELLE 4 SÜDAFRIKA: ADBLUE-MARKT NACH TECHNOLOGIE (KT) (2022–2030) 32
- TABELLE 5 SÜDAFRIKA AFRIKANISCHER ADBLUE-MARKT NACH ANWENDUNGEN (MIO. USD) (2022–2030) 35
- TABELLE 6 SÜDAFRIKANISCHER ADBLUE-MARKT NACH ANWENDUNGEN (KT) (2022–2030) 36
- TABELLE 7 SÜDAFRIKANISCHER MARKT NACH ANWENDUNG FÜR DIE AUTOMOBILINDUSTRIE (MIO. USD) (2022–2030) 37
- TABELLE 8 SÜDAFRIKANISCHER MARKT NACH ANWENDUNG FÜR DIE AUTOMOBILINDUSTRIE (KT) (2022–2030) 37
- TABELLE 9 ANALYSE DES STRATEGISCHEN ANSATZES 40
- ?
-
12 Abbildungsverzeichnis
- ABBILDUNG 1 SÜDAFRIKANISCHER ADBLUE-MARKT: MARKTSTRUKTUR 13
- ABBILDUNG 2 FORSCHUNGSPROZESS VON MRFR 15
- ABBILDUNG 3 TOP-DOWN- & BOTTOM-UP-ANSATZ 18
- ABBILDUNG 4 ÜBERBLICK ÜBER DIE MARKENDYNAMIK 20
- ABBILDUNG 5 AUTOMOBILPRODUKTION & VERKAUFSTATISTIKEN FÜR SÜDAFRIKA (2022–2030) 22
- ABBILDUNG 6 MARKTANTEIL VERSCHIEDENER KRAFTSTOFFE NACH FAHRZEUGTYP (2020) 23
- ABBILDUNG 7 LIEFERKETTE: SÜDAFRIKANISCHER ADBLUE-MARKT 27
- ABBILDUNG 8 PORTERS FIVE-FORCE-ANALYSE DES SÜDAFRIKANISCHEN ADBLUE-MARKTES 28
- ABBILDUNG 9 SÜDAFRIKANISCHER ADBLUE-MARKT NACH TECHNOLOGIE (MIO. USD) (2022–2030) 31
- ABBILDUNG 10 SÜDAFRIKANISCHER ADBLUE-MARKT NACH TECHNOLOGIE (KT) (2022–2030) 32
- ABBILDUNG 11 SÜDAFRIKANISCHER ADBLUE-MARKT NACH ANWENDUNGEN MILLIONEN) (2022–2030) 35
- ABBILDUNG 12 SÜDAFRIKANISCHER ADBLUE-MARKT NACH ANWENDUNGEN (KT) (2022–2030) 36
Customer Stories

“This is really good guys. Excellent work on a tight deadline. I will continue to use you going forward and recommend you to others. Nice job”

“Thanks. It’s been a pleasure working with you, please use me as reference with any other Intel employees.”

“Thanks for sending the report it gives us a good global view of the Betaïne market.”

“Thank you, this will be very helpful for OQS.”

“We found the report very insightful! we found your research firm very helpful. I'm sending this email to secure our future business.”

“I am very pleased with how market segments have been defined in a relevant way for my purposes (such as "Portable Freezers & refrigerators" and "last-mile"). In general the report is well structured. Thanks very much for your efforts.”

“I have been reading the first document or the study, ,the Global HVAC and FP market report 2021 till 2026. Must say, good info! I have not gone in depth at all parts, but got a good indication of the data inside!”

“We got the report in time, we really thank you for your support in this process. I also thank to all of your team as they did a great job.”
