Isocyanate Market
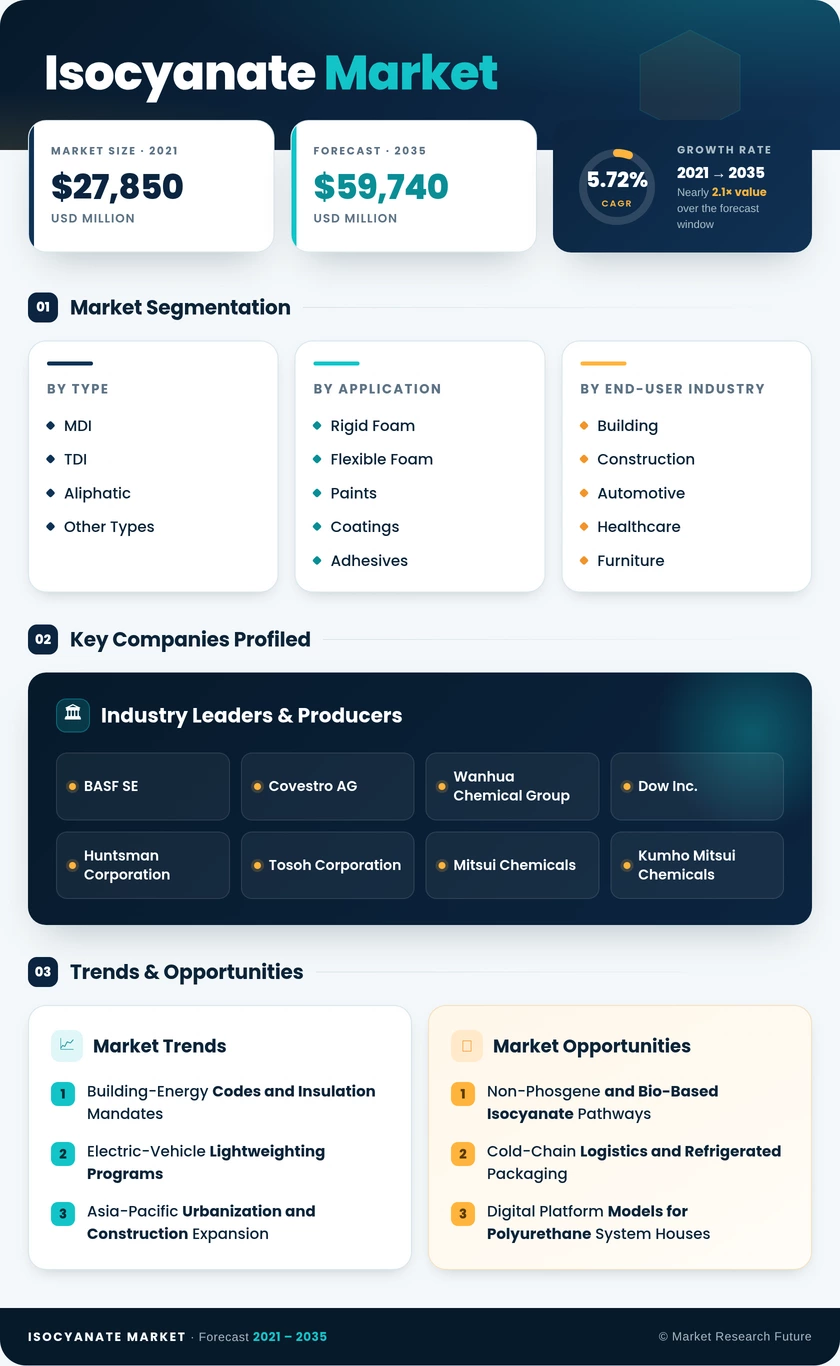
Market Size
Key Players
- Building-Energy Codes and Insulation Mandates
- Electric-Vehicle Lightweighting Programs
- Asia-Pacific Urbanization and Construction Expansion
- Non-Phosgene and Bio-Based Isocyanate Pathways
- Cold-Chain Logistics and Refrigerated Packaging
- Digital Platform Models for Polyurethane System Houses
-
1 Market Overview |
- 1.1 Study Assumptions & Market Definition |
- 1.2 Scope of the Study |
- 1.3 Research Methodology
- 2 Market Summary & Key Takeaways
-
3 Market Dynamics |
-
3.1 Market Drivers Analysis | |
- 3.1.1 Tighter Building-Energy Insulation Codes | |
- 3.1.2 EV Lightweighting and Battery-Pack Encapsulation | |
- 3.1.3 Asia-Pacific Urbanization and Construction Expansion | |
- 3.1.4 Aliphatic Isocyanate Adoption in Coatings | |
- 3.1.5 Cold-Chain and Refrigerated-Logistics Expansion | |
- 3.1.6 GCC Downstream Diversification Investment | |
- 3.1.7 Appliance Energy-Efficiency Labeling Upgrades |
-
3.2 Market Restraints Analysis | |
- 3.2.1 Benzene and Aniline Feedstock Price Volatility | |
- 3.2.2 REACH/EPA Regulatory Tightening on Diisocyanate Exposure | |
- 3.2.3 Bio-Based and Non-Isocyanate Polyurethane Substitution | |
- 3.2.4 Overcapacity Risk from Concurrent Mega-Plant Commissioning | |
- 3.2.5 Downstream Recycling Mandates Reducing Virgin Demand |
-
3.3 Market Opportunity Analysis | |
- 3.3.1 Non-Phosgene and Bio-Based Isocyanate Pathways | |
- 3.3.2 Cold-Chain Logistics and Refrigerated Packaging | |
- 3.3.3 Digital Platform Models for Polyurethane System Houses | |
- 3.3.4 GCC and Southeast Asian Downstream Diversification | |
- 3.3.5 Circular Economy and Chemical Recycling of Polyurethane |
- 3.4 Industry Value Chain Analysis |
- 3.5 Porter's Five Forces Analysis
-
3.1 Market Drivers Analysis | |
-
4 Global Isocyanates Market Size & Forecast (2021–2035) |
- 4.1 Historical Market Size (2021–2025) |
- 4.2 Current & Forecast Market Size (2026–2035) |
- 4.3 Market Size by Revenue (USD Million) |
- 4.4 Year-over-Year Growth Analysis
-
5 Segmentation Analysis |
-
5.1 By Type | |
- 5.1.1 MDI | |
- 5.1.2 TDI | |
- 5.1.3 Aliphatic | |
- 5.1.4 Other Types |
-
5.2 By Application | |
- 5.2.1 Rigid Foam | |
- 5.2.2 Flexible Foam | |
- 5.2.3 Paints and Coatings | |
- 5.2.4 Adhesives and Sealants | |
- 5.2.5 Elastomers | |
- 5.2.6 Binders | |
- 5.2.7 Other Applications |
-
5.3 By End-User Industry | |
- 5.3.1 Building and Construction | |
- 5.3.2 Automotive | |
- 5.3.3 Healthcare | |
- 5.3.4 Furniture | |
- 5.3.5 Other End-Users
-
5.1 By Type | |
-
6 Regional Analysis |
-
6.1 North America | |
- 6.1.1 United States | |
- 6.1.2 Canada | |
- 6.1.3 Mexico |
-
6.2 Europe | |
- 6.2.1 Germany | |
- 6.2.2 United Kingdom | |
- 6.2.3 France | |
- 6.2.4 Italy | |
- 6.2.5 Spain | |
- 6.2.6 Nordic Countries | |
- 6.2.7 Russia | |
- 6.2.8 Rest of Europe |
-
6.3 Asia-Pacific | |
- 6.3.1 China | |
- 6.3.2 India | |
- 6.3.3 Japan | |
- 6.3.4 South Korea | |
- 6.3.5 ASEAN | |
- 6.3.6 Rest of Asia-Pacific |
-
6.4 South America | |
- 6.4.1 Brazil | |
- 6.4.2 Argentina | |
- 6.4.3 Rest of South America |
-
6.5 Middle East & Africa | |
- 6.5.1 Saudi Arabia | |
- 6.5.2 UAE | |
- 6.5.3 South Africa | |
- 6.5.4 Egypt | |
- 6.5.5 Rest of MEA
-
6.1 North America | |
-
7 Competitive Landscape |
- 7.1 Market Share Analysis (2025) |
- 7.2 Competitive Benchmarking Matrix |
-
7.3 Company Profiles | |
- 7.3.1 BASF SE | |
- 7.3.2 Covestro AG | |
- 7.3.3 Wanhua Chemical Group | |
- 7.3.4 Dow Inc. | |
- 7.3.5 Huntsman Corporation | |
- 7.3.6 Tosoh Corporation | |
- 7.3.7 Mitsui Chemicals | |
- 7.3.8 Kumho Mitsui Chemicals | |
- 7.3.9 Sadara Chemical Company | |
- 7.3.10 Vencorex
-
8 Future Outlook & Strategic Recommendations (2026–2035) |
- 8.1 Electrification Supercycle and Material Substitution |
- 8.2 Sustainability Reporting and ESG-Driven Procurement |
- 8.3 Digital and AI-Optimized Production |
- 8.4 Regional Capacity Rebalancing
- 9 Recent Developments & News
- 10 Frequently Asked Questions (FAQs)
-
11 Report Scope & Methodology |
- 11.1 Study Period & Base Year |
- 11.2 Data Sources & Citations |
- 11.3 Abbreviations
- 12 LIST OF TABLES |
- TABLE 1 Global Isocyanates Market Size & Forecast, by Revenue (USD Million), 2021–2035 |
- TABLE 2 Global Isocyanates Market — Year-over-Year Growth Analysis, 2021–2035 |
- TABLE 3 Global Isocyanates Market — Driver Impact Analysis |
- TABLE 4 Global Isocyanates Market — Restraints Impact Analysis |
- TABLE 5 Global Isocyanates Market Size, by Type, 2021–2035 (USD Million) |
- TABLE 6 Global Isocyanates Market Size, by Application, 2021–2035 (USD Million) |
- TABLE 7 Global Isocyanates Market Size, by End-User Industry, 2021–2035 (USD Million) |
- TABLE 8 Global Isocyanates Market Size, by Region, 2021–2035 (USD Million) |
- TABLE 9 North America Isocyanates Market Size, by Country, 2021–2035 (USD Million) |
- TABLE 10 Europe Isocyanates Market Size, by Country, 2021–2035 (USD Million) |
- TABLE 11 Asia-Pacific Isocyanates Market Size, by Country, 2021–2035 (USD Million) |
- TABLE 12 South America Isocyanates Market Size, by Country, 2021–2035 (USD Million) |
- TABLE 13 Middle East & Africa Isocyanates Market Size, by Country, 2021–2035 (USD Million) |
- TABLE 14 Competitive Benchmarking Matrix — Global Isocyanates Market, 2025 |
- TABLE 15 Company Profiles — Key Players, Global Isocyanates Market |
- TABLE 16 Recent Developments & Strategic Announcements, 2023–2025 |
- TABLE 17 Report Scope & Methodology Summary |
- TABLE 18 Detailed Sources and Citations |
- TABLE 19 North America Isocyanates Market Size, by Type, 2021–2035 (USD Million) |
- TABLE 20 North America Isocyanates Market Size, by Application, 2021–2035 (USD Million) |
- TABLE 21 North America Isocyanates Market Size, by End-User Industry, 2021–2035 (USD Million) |
- TABLE 22 Europe Isocyanates Market Size, by Type, 2021–2035 (USD Million) |
- TABLE 23 Europe Isocyanates Market Size, by Application, 2021–2035 (USD Million) |
- TABLE 24 Europe Isocyanates Market Size, by End-User Industry, 2021–2035 (USD Million) |
- TABLE 25 Asia-Pacific Isocyanates Market Size, by Type, 2021–2035 (USD Million) |
- TABLE 26 Asia-Pacific Isocyanates Market Size, by Application, 2021–2035 (USD Million) |
- TABLE 27 Asia-Pacific Isocyanates Market Size, by End-User Industry, 2021–2035 (USD Million) |
- TABLE 28 South America Isocyanates Market Size, by Type, 2021–2035 (USD Million) |
- TABLE 29 South America Isocyanates Market Size, by Application, 2021–2035 (USD Million) |
- TABLE 30 South America Isocyanates Market Size, by End-User Industry, 2021–2035 (USD Million) |
- TABLE 31 Middle East & Africa Isocyanates Market Size, by Type, 2021–2035 (USD Million) |
- TABLE 32 Middle East & Africa Isocyanates Market Size, by Application, 2021–2035 (USD Million) |
- TABLE 33 Middle East & Africa Isocyanates Market Size, by End-User Industry, 2021–2035 (USD Million)
- 13 LIST OF FIGURES |
- FIGURE 1 Global Isocyanates Market Dynamics — Drivers, Restraints, and Opportunities |
- FIGURE 2 Industry Value Chain Analysis — Isocyanates Market |
- FIGURE 3 Porter's Five Forces Analysis — Isocyanates Market |
- FIGURE 4 Global Isocyanates Market Size Trend & Forecast (USD Million), 2021–2035 |
- FIGURE 5 Global Isocyanates Market Share, by Type, 2025 |
- FIGURE 6 Global Isocyanates Market Share, by Application, 2025 |
- FIGURE 7 Global Isocyanates Market Share, by End-User Industry, 2025 |
- FIGURE 8 Global Isocyanates Market Share, by Region, 2025 |
- FIGURE 9 North America Isocyanates Market Size Trend, 2021–2035 |
- FIGURE 10 Europe Isocyanates Market Size Trend, 2021–2035 |
- FIGURE 11 Asia-Pacific Isocyanates Market Size Trend, 2021–2035 |
- FIGURE 12 South America Isocyanates Market Size Trend, 2021–2035 |
- FIGURE 13 Middle East & Africa Isocyanates Market Size Trend, 2021–2035 |
- FIGURE 14 Competitive Landscape — Market Share Distribution, 2025
Customer Stories

“This is really good guys. Excellent work on a tight deadline. I will continue to use you going forward and recommend you to others. Nice job”

“Thanks. It’s been a pleasure working with you, please use me as reference with any other Intel employees.”

“Thanks for sending the report it gives us a good global view of the Betaïne market.”

“Thank you, this will be very helpful for OQS.”

“We found the report very insightful! we found your research firm very helpful. I'm sending this email to secure our future business.”

“I am very pleased with how market segments have been defined in a relevant way for my purposes (such as "Portable Freezers & refrigerators" and "last-mile"). In general the report is well structured. Thanks very much for your efforts.”

“I have been reading the first document or the study, ,the Global HVAC and FP market report 2021 till 2026. Must say, good info! I have not gone in depth at all parts, but got a good indication of the data inside!”

“We got the report in time, we really thank you for your support in this process. I also thank to all of your team as they did a great job.”