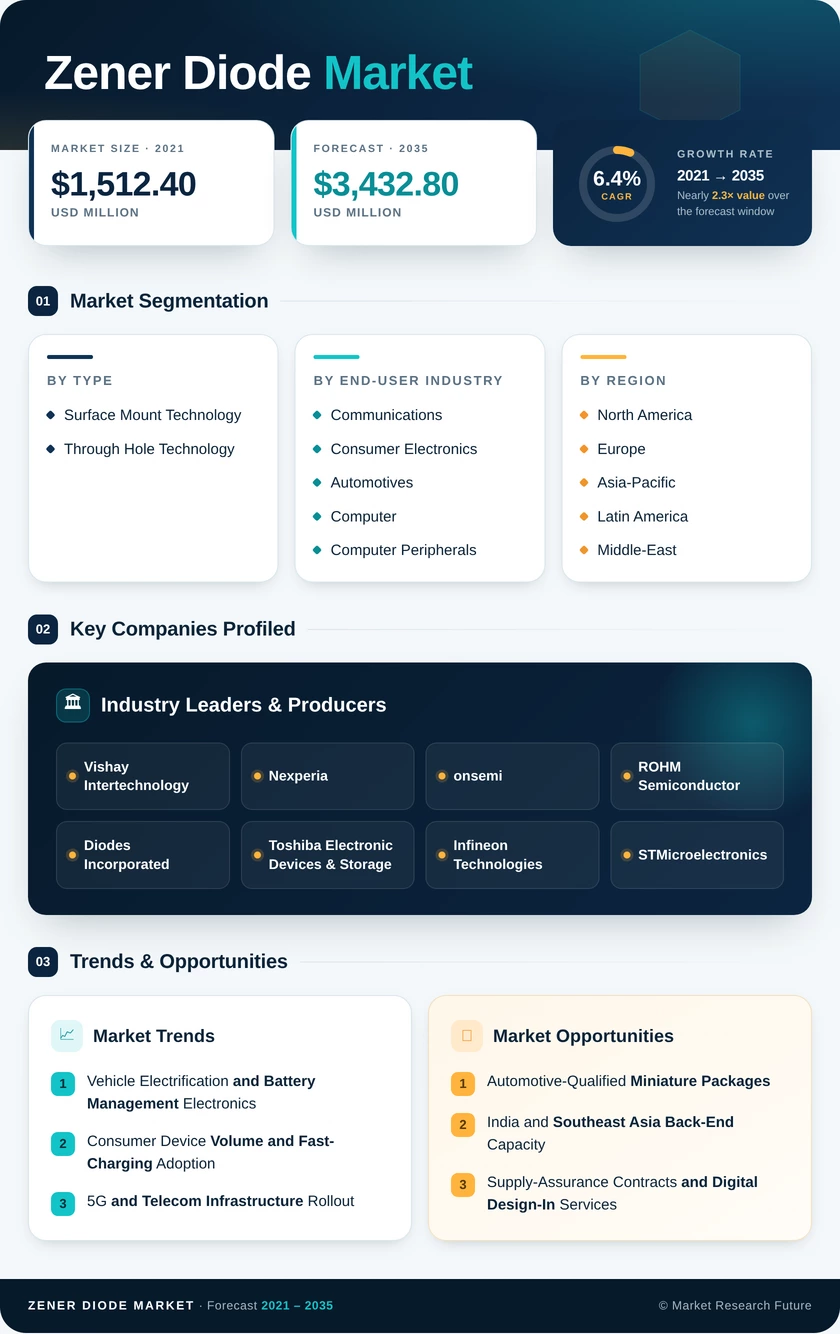
Zener Diode Market (2026 - 2035)

ID: MRFR/SEM/41366-HCR 200 Pages Aarti Dhapte Last Updated: October 21, 2026
Zener Diode Market Size, Share and Research Report By Type (Surface Mount Technology, and Through Hole Technology), By End-user Industry (Communications, Consumer Electronics, Automotives, Computer and Computer Peripherals, and Others) – Industry Forecast Till 2035
Zener Diode Market
Market Size
Forecast Period2026-2035
CAGR (2026-2035)6.4%
2025 Market SizeUSD 1,846.0 Million
2035 Market SizeUSD 3,432.8 Million
Key Players
Vishay Intertechnology
Nexperia
onsemi
ROHM Semiconductor
Diodes Incorporated
Toshiba Electronic Devices & Storage
Opportunities
  • Automotive-Qualified Miniature Packages
  • India and Southeast Asia Back-End Capacity
  • Supply-Assurance Contracts and Digital Design-In Services
  1. 1 Market Summary | |
  2. 2 Key Report Takeaways | |
    1. 2.1 By Type | |
    2. 2.2 By End-user Industry | |
    3. 2.3 By Region | |
  3. 3 Market Size and Forecast (2021–2035) | |
  4. 4 Driver Impact Analysis | |
    1. 4.1 Vehicle Electrification and Battery Management Electronics | |
    2. 4.2 Consumer Device Volume and Fast-Charging Adoption | |
    3. 4.3 5G and Telecom Infrastructure Rollout | |
    4. 4.4 Semiconductor Reshoring Incentives | |
    5. 4.5 AI Data-Center Power Architecture | |
    6. 4.6 Industrial Automation and Surge-Immunity Standards | |
  5. 5 Restraints Impact Analysis | |
    1. 5.1 Substitution by TVS Diodes and Integrated Regulators | |
    2. 5.2 Price Erosion from Commoditized Chinese Supply | |
    3. 5.3 Geopolitical Supply Concentration and Ownership Disputes | |
    4. 5.4 Inventory Cycles in Discrete Components | |
    5. 5.5 Raw Material and Energy Cost Volatility | |
  6. 6 Opportunities | |
    1. 6.1 Automotive-Qualified Miniature Packages | |
    2. 6.2 India and Southeast Asia Back-End Capacity | |
    3. 6.3 Supply-Assurance Contracts and Digital Design-In Services | |
    4. 6.4 EV Charging and Grid-Edge Electronics | |
    5. 6.5 Ultra-Low-Leakage Parts for Battery-Powered IoT | |
  7. 7 Regional Market Share and Country-Level Analysis | |
    1. 7.1 North America | | |
      1. 7.1.1 United States | | |
      2. 7.1.2 Canada | | |
      3. 7.1.3 Mexico | |
    2. 7.2 Europe | | |
      1. 7.2.1 Germany | | |
      2. 7.2.2 United Kingdom | | |
      3. 7.2.3 France | | |
      4. 7.2.4 Italy | | |
      5. 7.2.5 Spain | | |
      6. 7.2.6 Nordic Countries | | |
      7. 7.2.7 Russia | | |
      8. 7.2.8 Rest of Europe | |
    3. 7.3 Asia-Pacific | | |
      1. 7.3.1 China | | |
      2. 7.3.2 India | | |
      3. 7.3.3 Japan | | |
      4. 7.3.4 South Korea | | |
      5. 7.3.5 ASEAN | | |
      6. 7.3.6 Rest of Asia-Pacific | |
    4. 7.4 Latin America | | |
      1. 7.4.1 Brazil | | |
      2. 7.4.2 Argentina | | |
      3. 7.4.3 Rest of Latin America | |
    5. 7.5 Middle East and Africa | | |
      1. 7.5.1 Saudi Arabia | | |
      2. 7.5.2 UAE | | |
      3. 7.5.3 South Africa | | |
      4. 7.5.4 Egypt | | |
      5. 7.5.5 Rest of Middle East and Africa | |
  8. 8 Future Outlook (2026–2035) | |
    1. 8.1 Electrification Supercycle | |
    2. 8.2 AI Infrastructure and Power Density | |
    3. 8.3 Supply-Chain Regionalization | |
    4. 8.4 Sustainability and Materials Compliance | |
  9. 9 Segmentation Analysis | |
    1. 9.1 By Type | | |
      1. 9.1.1 Surface Mount Technology | | |
      2. 9.1.2 Through Hole Technology | |
    2. 9.2 By End-user Industry | | |
      1. 9.2.1 Communications | | |
      2. 9.2.2 Consumer Electronics | | |
      3. 9.2.3 Automotives | | |
      4. 9.2.4 Computer and Computer Peripherals | | |
      5. 9.2.5 Others | |
  10. 10 Competitive Landscape | |
  11. 11 Recent News & Developments | |
  12. 12 Report Scope and Methodology | |
  13. 13 Detailed Sources and Citations | |
  14. 14 Frequently Asked Questions (FAQs) | | LIST OF TABLES | |
  15. TABLE 1 Report Snapshot, 2025–2035 | |
  16. TABLE 2 Global Market Size & Forecast, by Revenue, 2021–2035 (USD Million) | |
  17. TABLE 3 Driver Impact Analysis, 2026–2035 | |
  18. TABLE 4 Restraints Impact Analysis, 2026–2035 | |
  19. TABLE 5 Regional Summary, 2025 (USD Million) | |
  20. TABLE 6 North America Market, by Country, 2025 | |
  21. TABLE 7 Europe Market, by Country, 2025 | |
  22. TABLE 8 Asia-Pacific Market, by Country, 2025 | |
  23. TABLE 9 Latin America Market, by Country, 2025 | |
  24. TABLE 10 Middle East and Africa Market, by Country, 2025 | |
  25. TABLE 11 Market Segmentation, by Type, 2025 | |
  26. TABLE 12 Market Segmentation, by End-user Industry, 2025 | |
  27. TABLE 13 Competitive Benchmarking Matrix, 2025 | |
  28. TABLE 14 Report Scope and Methodology | |
  29. TABLE 15 Detailed Sources and Citations | |
  30. TABLE 16 Segmentation Quick Reference | | LIST OF FIGURES | |
  31. FIGURE 1 Market Dynamics Overview (Drivers, Restraints, Opportunities) | |
  32. FIGURE 2 Industry Value Chain Analysis | |
  33. FIGURE 3 Porter's Five Forces Analysis | |
  34. FIGURE 4 Global Market Size Trend, 2021–2035 (USD Million) | |
  35. FIGURE 5 Market Share by Type, 2025 | |
  36. FIGURE 6 Market Share by End-user Industry, 2025 | |
  37. FIGURE 7 Regional Market Share, 2025 | |
  38. FIGURE 8 Country-Level Share within Key Regions, 2025 | |
  39. FIGURE 9 Competitive Landscape, Estimated Revenue Share Ranges, 2025 | |
  40. FIGURE 10 Company Strategic Positioning Matrix

Segmentation Quick Reference

DimensionSub-SegmentsDominant SegmentFastest Growing Segment
By TypeSurface Mount Technology; Through Hole TechnologySurface Mount Technology (6.9% CAGR)Surface Mount Technology (6.9% CAGR)
By End-user IndustryCommunications; Consumer Electronics; Automotives; Computer and Computer Peripherals; OthersConsumer Electronics (31.2% share)Automotives (8.6% CAGR)
By RegionNorth America; Europe; Asia-Pacific; Latin America; Middle-East and AfricaAsia-Pacific (44.6% share)North America (7.3% CAGR)

Market Segmentation Overview

By Type

Sub-SegmentKey Trend
Surface Mount TechnologyMigration to SOD-323, SOD-923 and leadless DFN packages for automated reflow assembly
Through Hole TechnologyRetained in high-power axial, industrial and long-lifecycle designs

Surface Mount Technology leads by type and also grows fastest at a 6.9% CAGR, because automotive ECUs, handsets and server boards are assembled almost entirely by reflow and reward smaller footprints. Through Hole Technology keeps a 27.8% share where 3 W to 5 W axial parts, through-board mechanical strength and decades-long qualification records still matter, as in rail, aerospace and industrial power supplies.

By End-user Industry

Sub-SegmentKey Trend
Communications5G densification adds surge-exposed radio units and fiber terminals
Consumer ElectronicsHigh handset and charger volumes under persistent ASP pressure
AutomotivesAEC-Q101 Zeners proliferate across battery packs, chargers and ADAS
Computer and Computer Peripherals48 V server power and storage rails add reference and clamp points
OthersIndustrial, medical and aerospace demand for high-reliability parts

Consumer Electronics leads with a 31.2% share on sheer handset, charger and wearable volume, though price pressure keeps its value growth modest. Automotives grows fastest at an 8.6% CAGR because each EV battery pack, onboard charger and ADAS module adds AEC-Q101 Zeners for gate clamping and sensor protection. Communications follows at a 7.4% CAGR as 5G radio units multiply.


Download PDF ×

We do not share your information with anyone. However, we may send you emails based on your report interest from time to time. You may contact us at any time to opt-out.