Wine Packaging Market (2026 - 2035)

ID: MRFR/PCM/0819-CR 121 Pages Sakshi Gupta Last Updated: October 31, 2026
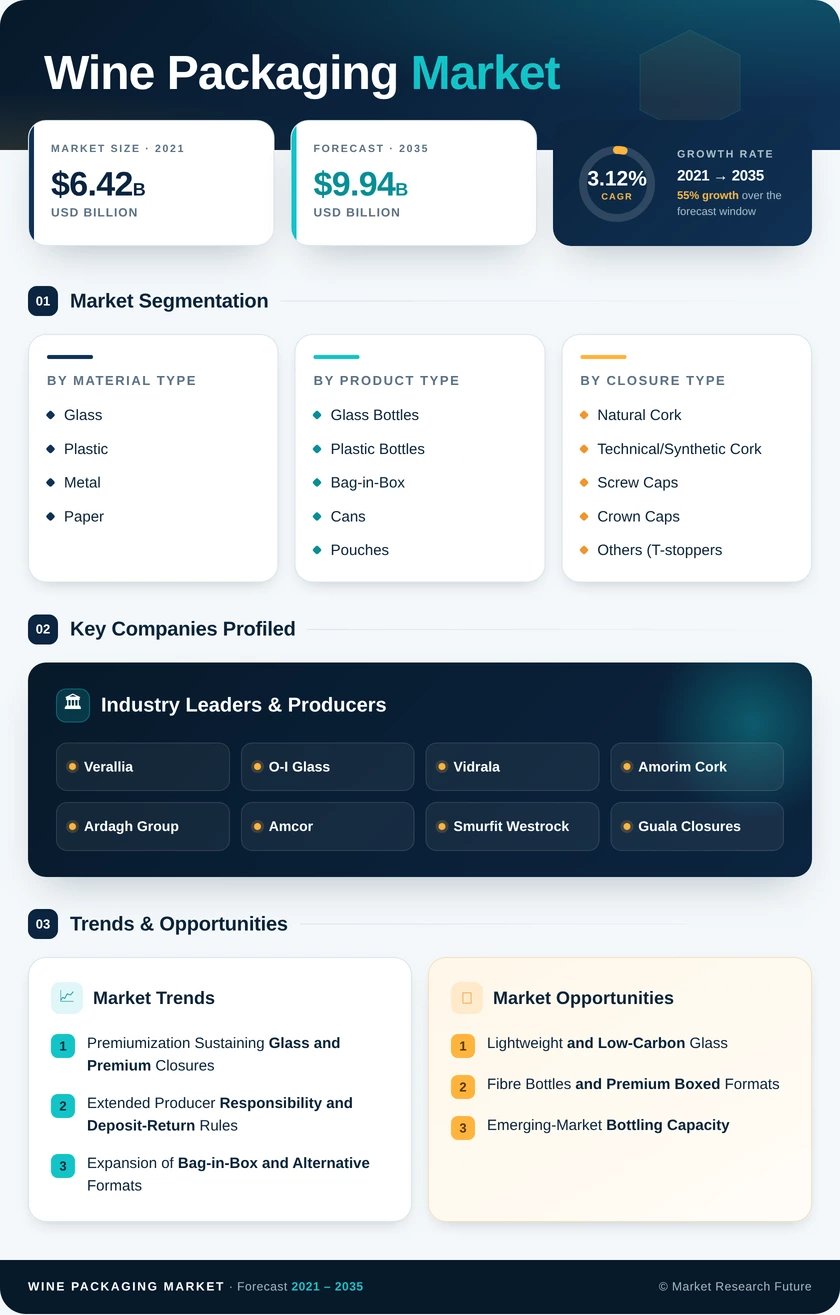
Wine Packaging Market Research Report Information By Material Type (Glass, Plastic, Metal, and Paper), By Product Type (Glass Bottles, Plastic Bottles, Bag-in-Box, Cans, Pouches, and Boxes and Other Products), By Closure Type (Natural Cork, Technical/Synthetic Cork, Screw Caps, Crown Caps, and Others), By Wine Type (Still Wine, Sparkling Wine, Fortified and Dessert Wine, and Low and No-Alcohol Wine), By Capacity (Less than 375 mL, 375–750 mL, 751–1,500 mL, and More than 1,500 mL), By Distribution Channel (Direct Sales and Indirect Sales), And By Region (North America, Europe, Asia-Pacific, and Rest of the World) – Market Forecast Till 2035.
Wine Packaging Market
Market Size
Forecast Period2026-2035
CAGR (2026-2035)3.12%
2025 Market SizeUSD 7.31 Billion
2035 Market SizeUSD 9.94 Billion
Key Players
Verallia
O-I Glass
Vidrala
Amorim Cork
Ardagh Group
Amcor
Opportunities
  • Lightweight and Low-Carbon Glass
  • Fibre Bottles and Premium Boxed Formats
  • Emerging-Market Bottling Capacity
  1. 1 Market Summary | |
  2. 2 Key Report Takeaways | |
    1. 2.1 By Material Type | |
    2. 2.2 By Product Type | |
    3. 2.3 By Closure Type | |
    4. 2.4 By Wine Type | |
    5. 2.5 By Capacity | |
    6. 2.6 By Distribution Channel | |
    7. 2.7 By Region | |
  3. 3 Market Size and Forecast (2021–2035) | |
    1. 3.1 Historical Market Size (2021–2025) | |
    2. 3.2 Forecast Market Size (2026–2035) | |
    3. 3.3 Year-over-Year Growth Analysis | |
  4. 4 Driver Impact Analysis | |
    1. 4.1 Premiumization Sustaining Glass and Premium Closures | |
    2. 4.2 Extended Producer Responsibility and Deposit-Return Rules | |
    3. 4.3 Expansion of Bag-in-Box and Alternative Formats | |
    4. 4.4 Low- and No-Alcohol Wine and Single-Serve Demand | |
    5. 4.5 Direct-to-Consumer and E-commerce Shipping | |
    6. 4.6 Rising Consumption and Domestic Winemaking in Asia-Pacific | |
    7. 4.7 Mandatory Digital Labelling and Traceability | |
  5. 5 Restraints Impact Analysis | |
    1. 5.1 Structural Decline in Global Wine Consumption | |
    2. 5.2 Energy-Cost Volatility in Glass Melting | |
    3. 5.3 Tariffs and Trade Friction | |
    4. 5.4 Cullet Quality and Recycling Infrastructure Gaps | |
    5. 5.5 Consumer Resistance to Alternative Formats in Premium Tiers | |
  6. 6 Opportunities | |
    1. 6.1 Lightweight and Low-Carbon Glass | |
    2. 6.2 Fibre Bottles and Premium Boxed Formats | |
    3. 6.3 Emerging-Market Bottling Capacity | |
    4. 6.4 Data Monetization Through Connected Labels | |
    5. 6.5 Reuse-as-a-Service Business Models | |
  7. 7 Regional Market Share and Country-Level Analysis | |
    1. 7.1 North America | | |
      1. 7.1.1 United States | | |
      2. 7.1.2 Canada | | |
      3. 7.1.3 Mexico | |
    2. 7.2 Europe | | |
      1. 7.2.1 Germany | | |
      2. 7.2.2 United Kingdom | | |
      3. 7.2.3 France | | |
      4. 7.2.4 Italy | | |
      5. 7.2.5 Spain | | |
      6. 7.2.6 Russia | | |
      7. 7.2.7 Rest of Europe | |
    3. 7.3 Asia-Pacific | | |
      1. 7.3.1 China | | |
      2. 7.3.2 India | | |
      3. 7.3.3 Japan | | |
      4. 7.3.4 South Korea | | |
      5. 7.3.5 Australia and New Zealand | | |
      6. 7.3.6 Rest of Asia-Pacific | |
    4. 7.4 Middle East and Africa | | |
      1. 7.4.1 Middle East | | |
      2. 7.4.2 United Arab Emirates | | |
      3. 7.4.3 Saudi Arabia | | |
      4. 7.4.4 Turkey | | |
      5. 7.4.5 Rest of Middle East | | |
      6. 7.4.6 Africa | | |
      7. 7.4.7 South Africa | | |
      8. 7.4.8 Nigeria | | |
      9. 7.4.9 Egypt | | |
      10. 7.4.10 Rest of Africa | |
    5. 7.5 South America | | |
      1. 7.5.1 Brazil | | |
      2. 7.5.2 Argentina | | |
      3. 7.5.3 Rest of South America | |
  8. 8 Future Outlook (2026–2035) | |
    1. 8.1 Decarbonized Glass Production | |
    2. 8.2 Format Diversification and Circular Reuse | |
    3. 8.3 Digital Product Passports and Connected Packaging | |
    4. 8.4 Moderation-Era Portfolios | |
  9. 9 Segmentation Analysis | |
    1. 9.1 By Material Type | | |
      1. 9.1.1 Glass | | |
      2. 9.1.2 Plastic | | |
      3. 9.1.3 Metal | | |
      4. 9.1.4 Paper | |
    2. 9.2 By Product Type | | |
      1. 9.2.1 Glass Bottles | | |
      2. 9.2.2 Plastic Bottles | | |
      3. 9.2.3 Bag-in-Box | | |
      4. 9.2.4 Cans | | |
      5. 9.2.5 Pouches | | |
      6. 9.2.6 Boxes and Other Products | |
    3. 9.3 By Closure Type | | |
      1. 9.3.1 Natural Cork | | |
      2. 9.3.2 Technical/Synthetic Cork | | |
      3. 9.3.3 Screw Caps | | |
      4. 9.3.4 Crown Caps | | |
      5. 9.3.5 Others (T-stoppers, Vino-Lok) | |
    4. 9.4 By Wine Type | | |
      1. 9.4.1 Still Wine | | |
      2. 9.4.2 Sparkling Wine | | |
      3. 9.4.3 Fortified and Dessert Wine | | |
      4. 9.4.4 Low and No-Alcohol Wine | |
    5. 9.5 By Capacity | | |
      1. 9.5.1 Less than 375 mL | | |
      2. 9.5.2 375-750 mL | | |
      3. 9.5.3 751-1,500 mL | | |
      4. 9.5.2 More than 1,500 mL | |
    6. 9.6 By Distribution Channel | | |
      1. 9.6.1 Direct Sales | | |
      2. 9.6.2 Indirect Sales | |
  10. 10 Competitive Landscape | |
    1. 10.1 Market Concentration Analysis | |
    2. 10.2 Competitive Benchmarking Matrix | |
    3. 10.3 Company Profiles | | |
      1. 10.3.1 Verallia | | |
      2. 10.3.2 O-I Glass | | |
      3. 10.3.3 Vidrala | | |
      4. 10.3.4 Amorim Cork | | |
      5. 10.3.5 Ardagh Group | | |
      6. 10.3.6 Amcor | | |
      7. 10.3.7 Smurfit Westrock | | |
      8. 10.3.8 Guala Closures | | |
      9. 10.3.9 Şişecam | | |
      10. 10.3.10 Vinventions | | |
      11. 10.3.11 Ball Corporation | |
  11. 11 Recent News & Developments | |
  12. 12 Report Scope and Methodology | |
  13. 13 Detailed Sources and Citations | |
  14. 14 Frequently Asked Questions (FAQs) | | LIST OF TABLES | |
  15. TABLE 1 Global Market Snapshot, 2025–2035 | |
  16. TABLE 2 Global Market Size & Forecast, by Revenue (USD Billion), 2021–2035 | |
  17. TABLE 3 Driver Impact Analysis | |
  18. TABLE 4 Restraints Impact Analysis | |
  19. TABLE 5 Regional Market Summary, 2025 | |
  20. TABLE 6 North America Market, by Country, 2025 | |
  21. TABLE 7 Europe Market, by Country, 2025 | |
  22. TABLE 8 Asia-Pacific Market, by Country, 2025 | |
  23. TABLE 9 Middle East and Africa Market, by Country, 2025 | |
  24. TABLE 10 South America Market, by Country, 2025 | |
  25. TABLE 11 Market by Material Type, 2025 | |
  26. TABLE 12 Market by Product Type, 2025 | |
  27. TABLE 13 Market by Closure Type, 2025 | |
  28. TABLE 14 Market by Wine Type, 2025 | |
  29. TABLE 15 Market by Capacity, 2025 | |
  30. TABLE 16 Market by Distribution Channel, 2025 | |
  31. TABLE 17 Competitive Benchmarking Matrix | |
  32. TABLE 18 Report Scope and Methodology | |
  33. TABLE 19 Detailed Sources and Citations | | LIST OF FIGURES | |
  34. FIGURE 1 Market Dynamics Overview (Drivers, Restraints, Opportunities) | |
  35. FIGURE 2 Industry Value Chain Analysis | |
  36. FIGURE 3 Porter's Five Forces Analysis | |
  37. FIGURE 4 Global Market Size Trend, 2021–2035 (USD Billion) | |
  38. FIGURE 5 Market Share by Material Type, 2025 | |
  39. FIGURE 6 Market Share by Product Type, 2025 | |
  40. FIGURE 7 Market Share by Closure Type, 2025 | |
  41. FIGURE 8 Market Share by Wine Type, 2025 | |
  42. FIGURE 9 Market Share by Capacity, 2025 | |
  43. FIGURE 10 Market Share by Distribution Channel, 2025 | |
  44. FIGURE 11 Regional Market Share, 2025 | |
  45. FIGURE 12 Competitive Landscape – Estimated Revenue Share Ranges

Segmentation Quick Reference

DimensionSub-SegmentsDominant SegmentFastest Growing Segment
By Material TypeGlass, Plastic, Metal, PaperGlass (63.3% share)Paper (6.4% CAGR)
By Product TypeGlass Bottles, Plastic Bottles, Bag-in-Box, Cans, Pouches, Boxes and Other ProductsGlass Bottles (58.9% share)Cans (7.1% CAGR)
By Closure TypeNatural Cork, Technical/Synthetic Cork, Screw Caps, Crown Caps, Others (T-stoppers, Vino-Lok)Screw Caps (50.8% share)Technical/Synthetic Cork (5.9% CAGR)
By Wine TypeStill Wine, Sparkling Wine, Fortified and Dessert Wine, Low and No-Alcohol WineStill Wine (65.9% share)Low and No-Alcohol Wine (4.76% CAGR)
By CapacityLess than 375 mL, 375-750 mL, 751-1,500 mL, More than 1,500 mL375-750 mL (67.0% share)Less than 375 mL (4.9% CAGR)
By Distribution ChannelDirect Sales, Indirect SalesDirect Sales (3.6% CAGR)Direct Sales (3.6% CAGR)
By RegionNorth America, Europe, Asia-Pacific, Middle East and Africa, South AmericaEurope (44.5% share)Asia-Pacific (4.6% CAGR)

Market Segmentation Overview

By Material Type

Sub-SegmentKey Trend
GlassLightweighting and hybrid-electric melting
PlasticBarrier-layer PET and recyclable mono-material films
MetalAluminum cans and resealable bottles
PaperFibre bottles entering mainstream retail

Glass leads on barrier performance and premium cues, and producers defend that position by cutting bottle weight and raising cullet content. Paper grows fastest because fibre bottles carry lower EPR fees and strong lifecycle claims, while Metal gains through cans that suit outdoor occasions. Plastic stays relevant mainly as the liner behind boxed formats.

By Product Type

Sub-SegmentKey Trend
Glass BottlesEmbossed premium designs alongside lighter standard bottles
Plastic BottlesAirline and event use with extended shelf life
Bag-in-BoxPremium graphics and improved taps
CansSingle-serve sizes for younger buyers
PouchesPortable festival formats
Boxes and Other ProductsGift and shelf-ready cartons

Glass Bottles lead because cellaring, gifting and restaurant service still depend on them. Cans grow fastest as brands target single-serve occasions, while Bag-in-Box expands under Nordic monopoly retail and lower footprint per litre. Pouches and Plastic Bottles remain niche formats for events and travel.

By Closure Type

Sub-SegmentKey Trend
Natural CorkTaint-screening technology protecting premium share
Technical/Synthetic CorkPlant-based polymers with specified oxygen transfer
Screw CapsAdvanced liners extending use into premium wines
Crown CapsSecondary fermentation in sparkling production
Others (T-stoppers, Vino-Lok)Fortified wines and design-led brands

Screw Caps lead through low cost, consistency and their near-universal use in Australia and New Zealand. Technical/Synthetic Cork grows fastest because winemakers can choose a defined oxygen transfer rate without taint risk. Natural Cork holds the premium tier, and Crown Caps stay tied to traditional-method sparkling production.

By Wine Type

Sub-SegmentKey Trend
Still WineLighter bottles and boxed value formats
Sparkling WinePressure-resistant glass and capsule-free necks
Fortified and Dessert WineSmaller bottles to limit oxidation
Low and No-Alcohol WineCalorie-forward labels and smaller containers

Still Wine dominates because it spans every price tier and packaging format. Low and No-Alcohol Wine grows fastest as moderation reshapes buying, requiring nutrition-led labels and smaller packs. Sparkling Wine keeps demand for heavy, pressure-rated glass, while Fortified and Dessert Wine moves toward compact bottles.

By Capacity

Sub-SegmentKey Trend
Less than 375 mLMinis and cans for trial and portion control
375-750 mLBottle weight reduction on standard lines
751-1,500 mLMagnums and value packs
More than 1,500 mLBoxed wine and keg systems for hospitality

The 375-750 mL tier leads because bottling lines and retail shelves are built around it. Less than 375 mL grows fastest on cans and minis that suit moderation and trial purchases. More than 1,500 mL formats advance through boxes and wine-on-tap kegs that cut per-litre packaging.

By Distribution Channel

Sub-SegmentKey Trend
Direct SalesCustom shippers for clubs and cellar-door sales
Indirect SalesShelf-ready cases and tamper-evident seals

Direct Sales lead and grow fastest as wineries invest in clubs, tourism and branded shipping kits that carry higher packaging value per order. Indirect Sales rely on pallet-efficient cases and retailer-compliant seals for grocery and e-commerce. Wineries running both channels need packs that survive parcel shipping and look right on the shelf.


Download PDF ×

We do not share your information with anyone. However, we may send you emails based on your report interest from time to time. You may contact us at any time to opt-out.