Wind Power Market Segmentation
Wind Power Market By Application (USD Billion, 2025-2035)
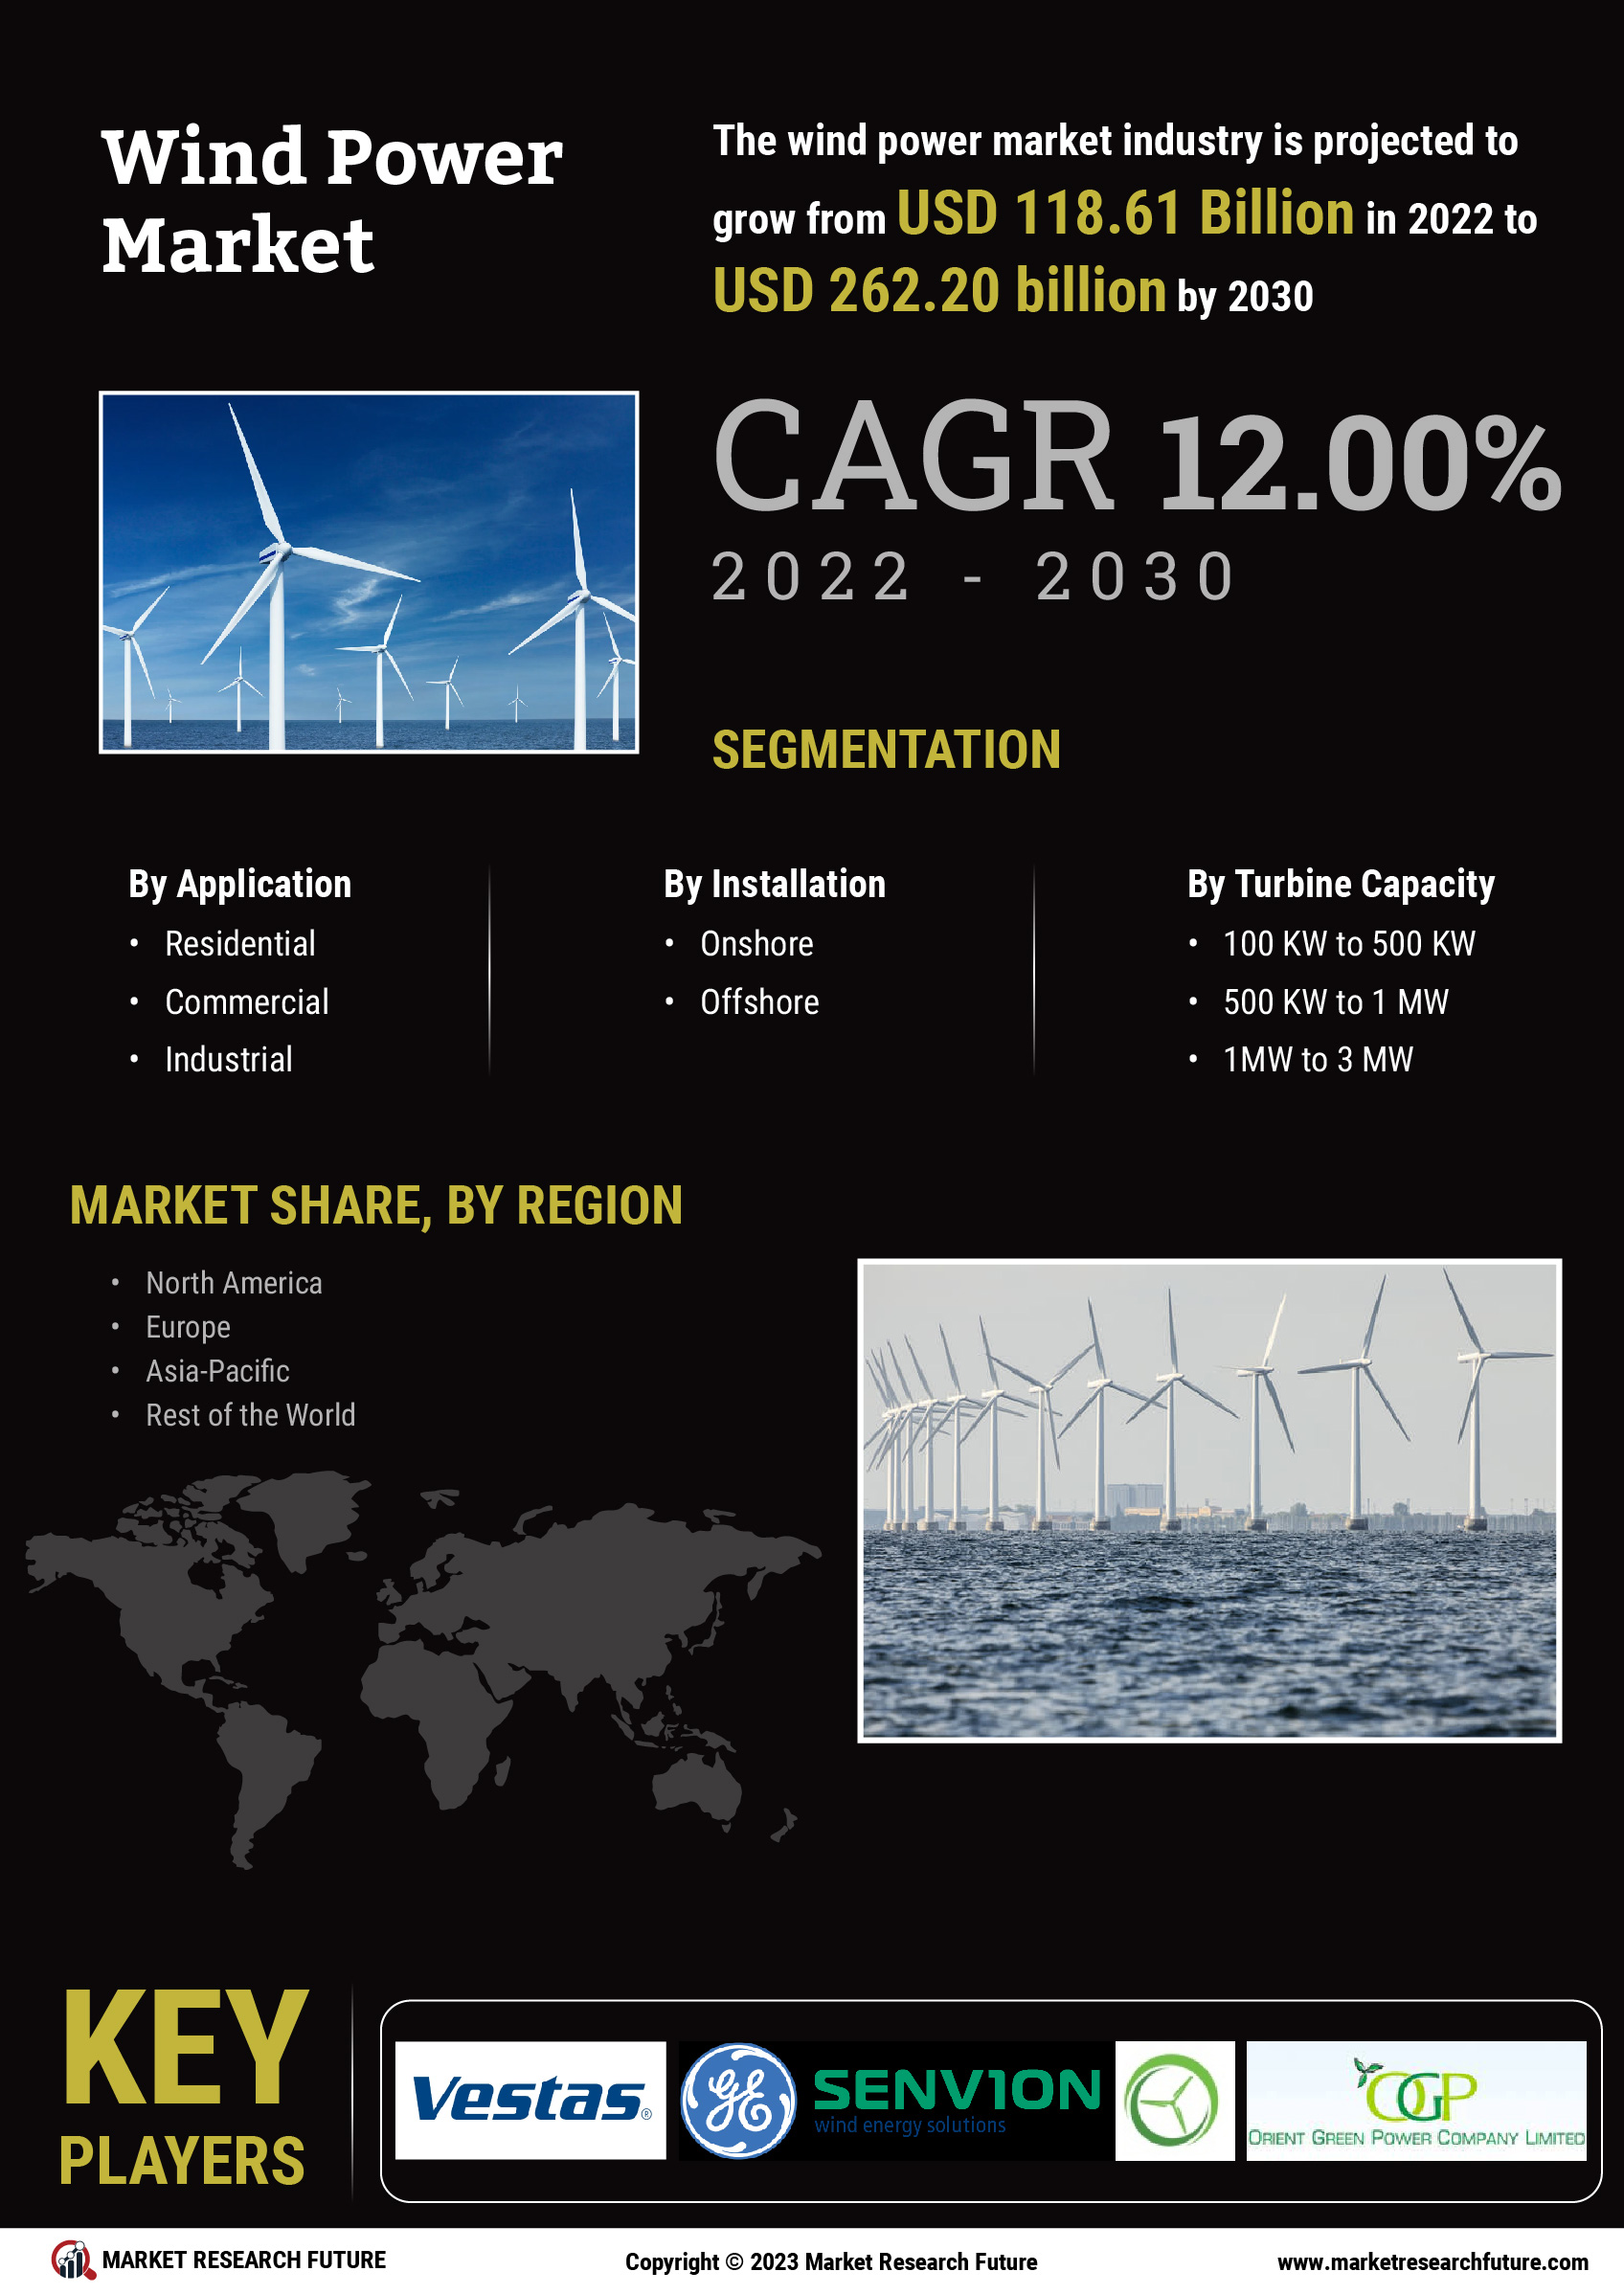
- Residential
- Commercial
- Industrial
Wind Power Market By Installation (USD Billion, 2025-2035)
- Onshore
- Offshore
Wind Power Market By Turbine Capacity (USD Billion, 2025-2035)
- <100 KW
- 100 KW to 500 KW
- 500 KW to 1 MW
- 1 MW to 3 MW
- > 3 MW