Certified Global Research Member
Isomar fd.webp Wcrc 57.webp
Key Questions Answered
  • Global Market Outlook
  • In-depth analysis of global and regional trends
  • Analyze and identify the major players in the market, their market share, key developments, etc.
  • To understand the capability of the major players based on products offered, financials, and strategies.
  • Identify disrupting products, companies, and trends.
  • To identify opportunities in the market.
  • Analyze the key challenges in the market.
  • Analyze the regional penetration of players, products, and services in the market.
  • Comparison of major players’ financial performance.
  • Evaluate strategies adopted by major players.
  • Recommendations
Why Choose Market Research Future?
  • Vigorous research methodologies for specific market.
  • Knowledge partners across the globe
  • Large network of partner consultants.
  • Ever-increasing/ Escalating data base with quarterly monitoring of various markets
  • Trusted by fortune 500 companies/startups/ universities/organizations
  • Large database of 5000+ markets reports.
  • Effective and prompt pre- and post-sales support.

Web Performance Market Research Report Information By Component (Solution, Service), By Organization Size (SMEs, Large Enterprises) By Deployment Type (On-premises, Cloud) By Vertical (BFSI, IT & Telecommunication, Healthcare, Manufacturing) And By Region (North America, Europe, Asia-Pacific, And Rest Of The World) –Market Forecast Till 2032


ID: MRFR/ICT/4160-CR | 100 Pages | Author: Aarti Dhapte| April 2023

Research Methodology on Web Performance Market


INTRODUCTION


The research report titled "Global Web Performance Market" examines how the market for web performance is changing, what the potential opportunities are, and how this change is impacting the industry and the economy of the world. The report provides detailed information on the current market trends, forecasts, and projections of the upcoming trends, along with an in-depth analysis of the current professional and financial developments in the web performance market. The report covers the current estimates of the global web performance market and discusses the future prospects. The focus of this report is on the market size, key drivers and trends, as well as opportunities, and challenges faced by the industry from 2023 to 2030.


RESEARCH METHODOLOGY


BIS's research methodology includes an in-depth review of the existing market drivers and trends that affect the industry. Our research methodology is based on an empirical approach which is formulated through the use of secondary and primary data sources. Secondary data sources include published literature, case studies, public and private databases as well as online portals. Primary data sources include interviews, industry surveys, and field visits.


In order to gain an in-depth understanding of the dynamics driving the market, we have made use of a top-down and bottom-up approach. This involved the analysis of macro-economic indicators such as GDP growth rate, GDP per capita and inflation rates, the analysis of the industry structure and different segments, market size, and competitive landscape and the analysis of market trends.


The analysis and estimation of the market size were done using a combination of top-down, bottom-up and demand-side approaches. A top-down approach is adopted to estimate the overall market size based on current market trends and the market share held by leading players in the industry. The bottom-up approach was adopted to estimate the market size of different segments and sub-segments in the industry.


The qualitative and quantitative data obtained from the secondary research is validated by conducting primary interviews with industry experts. The interviews were conducted with key personnel executives, technical directors, industry associations, associations and end-users. These interviews helped to provide a thorough understanding of the industry, its dynamics and expected trends. The information obtained was used to fine-tune the research model.


Sampling and data collection included a mix of primary and secondary research sources. To obtain an understanding of the market dynamics and to estimate the overall market size, MRFR conducted surveys and interviews with stakeholders such as end-users, vendors and distributors in the web performance industry. The interviews were conducted with key personnel- directors, decision-makers, retail segment executives, distributors and end-users. Primary data was collected through online surveys and telephonic interviews.


The analysis of the data obtained through primary research is used to further corroborate the findings from the secondary research. This helped in the refining of the research model and the estimation of the market size.


Secondary data sources include existing published and unpublished literature such as company annual reports, company reports, market research reports, financial literature, statistical databases, government reports and websites. In addition, the data was also collected from public and private databases as well as online portals.


Data validation was done to ensure the accuracy of the data and the reliability of the results. The results were checked, cross-checked and verified with the help of triangulation methodologies which included the use of primary and secondary methods of data collection.


Finally, the analysis of all the data collected was synthesized and evaluated for a comprehensive understanding of the industry and to obtain accurate market estimates.


CONCLUSION


The research methodology ensures accurate market estimates and insights by leveraging a mix of primary and secondary research sources, data analysis and validation techniques. This research methodology provides a comprehensive understanding of the web performance industry, its growth prospects, key drivers and trends and emerging opportunities.


It helps industry players and stakeholders make informed decisions that add value to their businesses. The comprehensive research methodology employed provides key insights about the web performance market that helps guide their strategy and decision-making in the years to come.

Leading companies partner with us for data-driven Insights
client_1 client_2 client_3 client_4 client_5 client_6 client_7 client_8 client_9 client_10
Please fill in Business Email for Quick Response

TABLE OF CONTENTS

1 Executive Summary

2 Scope of the Report

2.1 Market Definition

2.2 Scope of the Study

2.2.1 Research Objectives

2.2.2 Assumptions & Limitations

2.3 Markets Structure

3 Market Research Methodology

3.1 Research Process

3.2 Secondary Research

3.3 Primary Research

3.4 Forecast Model

4 Market Landscape

4.1 Porter’s Five Forces Analysis

4.1.1 Threat of New Entrants

4.1.2 Bargaining power of buyers

4.1.3 Threat of substitutes

4.1.4 Segment rivalry

4.2 Value Chain/Supply Chain of Global Web Performance Market

5 Industry Overview of Global Web Performance Market

5.1 Introduction

5.2 Growth Drivers

5.3 Impact analysis

5.4 Market Challenges

6 Market Trends

6.1 Introduction

6.2 Growth Trends

6.3 Impact analysis

7. Global Web Performance Market by Component

7.1 Introduction

7.2 Solution

7.2.1 Web Performance Monitoring

7.2.1.1 Market Estimates & Forecast, 2023-2032

7.2.1.2 Market Estimates & Forecast by Region, 2023-2032

7.2.2 Web Performance Optimization

7.2.2.1 Market Estimates & Forecast, 2023-2032

7.2.2.2 Market Estimates & Forecast by Region, 2023-2032

7.2.3 Web Performance Testing

7.2.3.1 Market Estimates & Forecast, 2023-2032

7.2.3.2 Market Estimates & Forecast by Region, 2023-2032

7.3 Service

7.3.1 Managed Services

7.3.1.1 Market Estimates & Forecast, 2023-2032

7.3.1.2 Market Estimates & Forecast by Region, 2023-2032

7.3.2 Consulting Services

7.3.2.1 Market Estimates & Forecast, 2023-2032

7.3.2.2 Market Estimates & Forecast by Region, 2023-2032

7.3.3 Implementation Services

7.3.3.1 Market Estimates & Forecast, 2023-2032

7.3.3.2 Market Estimates & Forecast by Region, 2023-2032

8. Global Web Performance Market by Organization Size

8.1 Introduction

8.2 SMEs

8.2.1 Market Estimates & Forecast, 2023-2032

8.2.2 Market Estimates & Forecast by Region, 2023-2032

8.3 Large Enterprises

8.3.1 Market Estimates & Forecast, 2023-2032

8.3.2 Market Estimates & Forecast by Region, 2023-2032

9. Global Web Performance Market by Deployment

9.1 Introduction

9.2 Cloud

9.2.1 Market Estimates & Forecast, 2023-2032

9.2.2 Market Estimates & Forecast by Region, 2023-2032

9.3 On Premise

9.3.1 Market Estimates & Forecast, 2023-2032

9.3.2 Market Estimates & Forecast by Region, 2023-2032

10. Global Web Performance Market by Vertical

10.1 Introduction

10.2 BFSI

10.2.1 Market Estimates & Forecast, 2023-2032

10.2.2 Market Estimates & Forecast by Region, 2023-2032

10.3 Healthcare

10.3.1 Market Estimates & Forecast, 2023-2032

10.3.2 Market Estimates & Forecast by Region, 2023-2032

10.4 Manufacturing

10.4.1 Market Estimates & Forecast, 2023-2032

10.4.2 Market Estimates & Forecast by Region, 2023-2032

10.5 IT & Telecommunication

10.5.1 Market Estimates & Forecast, 2023-2032

10.5.2 Market Estimates & Forecast by Region, 2023-2032

10.6 Transportation

10.6.1 Market Estimates & Forecast, 2023-2032

10.6.2 Market Estimates & Forecast by Region, 2023-2032

10.7 Automotive

10.7.1 Market Estimates & Forecast, 2023-2032

10.7.2 Market Estimates & Forecast by Region, 2023-2032

10.8 Others

10.8.1 Market Estimates & Forecast, 2023-2032

10.8.2 Market Estimates & Forecast by Region, 2023-2032

11. Global Web Performance Market by Region

11.1 Introduction

11.2 North America

11.2.1 Market Estimates & Forecast, 2023-2032

11.2.2 Market Estimates & Forecast by Component, 2023-2032

11.2.3 Market Estimates & Forecast by Organization Size, 2023-2032

11.2.4 Market Estimates & Forecast by Deployment, 2023-2032

11.2.5 Market Estimates & Forecast by Vertical, 2023-2032

11.2.6 U.S.

11.2.6.1 Market Estimates & Forecast, 2023-2032

11.2.6.2 Market Estimates & Forecast by Component, 2023-2032

11.2.6.3 Market Estimates & Forecast by Organization Size, 2023-2032

11.2.6.4 Market Estimates & Forecast by Deployment, 2023-2032

11.2.6.5 Market Estimates & Forecast by Vertical, 2023-2032

11.2.7 Canada

11.2.7.1 Market Estimates & Forecast, 2023-2032

11.2.7.2 Market Estimates & Forecast by Component, 2023-2032

11.2.7.3 Market Estimates & Forecast by Organization Size, 2023-2032

11.2.7.4 Market Estimates & Forecast by Deployment, 2023-2032

11.2.7.5 Market Estimates & Forecast by Vertical, 2023-2032

11.2.8 Mexico

11.2.8.1 Market Estimates & Forecast, 2023-2032

11.2.8.2 Market Estimates & Forecast by Component, 2023-2032

11.2.8.3 Market Estimates & Forecast by Organization Size, 2023-2032

11.2.8.4 Market Estimates & Forecast by Deployment, 2023-2032

11.2.8.5 Market Estimates & Forecast by Vertical, 2023-2032

11.3 Europe

11.3.1 Market Estimates & Forecast, 2023-2032

11.3.2 Market Estimates & Forecast by Component, 2023-2032

11.3.3 Market Estimates & Forecast by Organization Size, 2023-2032

11.3.4 Market Estimates & Forecast by Deployment, 2023-2032

11.3.5 Market Estimates & Forecast by Vertical, 2023-2032

11.3.6 Germany

11.3.6.1 Market Estimates & Forecast, 2023-2032

11.3.6.2 Market Estimates & Forecast by Component, 2023-2032

11.3.6.3 Market Estimates & Forecast by Organization Size, 2023-2032

11.3.6.4 Market Estimates & Forecast by Deployment, 2023-2032

11.3.6.5 Market Estimates & Forecast by Vertical, 2023-2032

11.3.7 France

11.3.7.1 Market Estimates & Forecast, 2023-2032

11.3.7.2 Market Estimates & Forecast by Component, 2023-2032

11.3.7.3 Market Estimates & Forecast by Organization Size, 2023-2032

11.3.7.4 Market Estimates & Forecast by Deployment, 2023-2032

11.3.7.5 Market Estimates & Forecast by Vertical, 2023-2032

11.3.8 Italy

11.3.8.1 Market Estimates & Forecast, 2023-2032

11.3.8.2 Market Estimates & Forecast by Component, 2023-2032

11.3.8.3 Market Estimates & Forecast by Organization Size, 2023-2032

11.3.8.4 Market Estimates & Forecast by Deployment, 2023-2032

11.3.8.5 Market Estimates & Forecast by Vertical, 2023-2032

11.3.9 Spain

11.3.9.1 Market Estimates & Forecast, 2023-2032

11.3.9.2 Market Estimates & Forecast by Component, 2023-2032

11.3.9.3 Market Estimates & Forecast by Organization Size 2023-2032

11.3.9.4 Market Estimates & Forecast by Deployment, 2023-2032

11.3.9.5 Market Estimates & Forecast by Vertical, 2023-2032

11.3.10 U.K

11.3.10.1 Market Estimates & Forecast, 2023-2032

11.3.10.2 Market Estimates & Forecast by Component, 2023-2032

11.3.10.3 Market Estimates & Forecast by Organization Size, 2023-2032

11.3.10.4 Market Estimates & Forecast by Deployment, 2023-2032

11.3.10.5 Market Estimates & Forecast by Vertical, 2023-2032

11.4 Asia Pacific

11.4.1 Market Estimates & Forecast, 2023-2032

11.4.2 Market Estimates & Forecast by Component, 2023-2032

11.4.3 Market Estimates & Forecast by Organization Size, 2023-2032

11.4.4 Market Estimates & Forecast by Deployment, 2023-2032

11.4.5 Market Estimates & Forecast by Vertical, 2023-2032

11.4.6 China

11.4.6.1 Market Estimates & Forecast, 2023-2032

11.4.6.2 Market Estimates & Forecast by Component, 2023-2032

11.4.6.3 Market Estimates & Forecast by Organization Size, 2023-2032

11.4.6.4 Market Estimates & Forecast by Deployment, 2023-2032

11.4.6.5 Market Estimates & Forecast by Vertical, 2023-2032

11.4.7 India

11.4.7.1 Market Estimates & Forecast, 2023-2032

11.4.7.2 Market Estimates & Forecast by Component, 2023-2032

11.4.7.3 Market Estimates & Forecast by Organization Size, 2023-2032

11.4.7.4 Market Estimates & Forecast by Deployment, 2023-2032

11.4.7.5 Market Estimates & Forecast by Vertical, 2023-2032

11.4.8 Japan

11.4.8.1 Market Estimates & Forecast, 2023-2032

11.4.8.2 Market Estimates & Forecast by Component, 2023-2032

11.4.8.3 Market Estimates & Forecast by Organization Size, 2023-2032

11.4.8.4 Market Estimates & Forecast by Deployment, 2023-2032

11.4.8.5 Market Estimates & Forecast by Vertical, 2023-2032

11.4.9 Rest of Asia Pacific

11.4.9.1 Market Estimates & Forecast, 2023-2032

11.4.9.2 Market Estimates & Forecast by Component, 2023-2032

11.4.9.3 Market Estimates & Forecast by Organization Size, 2023-2032

11.4.9.4 Market Estimates & Forecast by Deployment, 2023-2032

11.4.9.5 Market Estimates & Forecast by Vertical, 2023-2032

11.5 Rest of the World

11.5.1 Market Estimates & Forecast, 2023-2032

11.5.2 Market Estimates & Forecast by Component, 2023-2032

11.5.3 Market Estimates & Forecast by Organization Size, 2023-2032

11.5.4 Market Estimates & Forecast by Deployment, 2023-2032

11.5.5 Market Estimates & Forecast by Vertical, 2023-2032

11.5.6 The Middle East & Africa

11.5.6.1 Market Estimates & Forecast, 2023-2032

11.5.6.2 Market Estimates & Forecast by Component, 2023-2032

11.5.6.3 Market Estimates & Forecast by Organization Size, 2023-2032

11.5.6.4 Market Estimates & Forecast by Deployment, 2023-2032

11.5.6.5 Market Estimates & Forecast by Vertical, 2023-2032

11.5.7 Latin America

11.5.7.1 Market Estimates & Forecast, 2023-2032

11.5.7.2 Market Estimates & Forecast by Component, 2023-2032

11.5.7.3 Market Estimates & Forecast by Organization Size, 2023-2032

11.5.7.4 Market Estimates & Forecast by Deployment, 2023-2032

11.5.7.5 Market Estimates & Forecast by Vertical, 2023-2032

12. Company Landscape

13. Company Profiles

13.1 Akamai Technologies, Inc. (U.S.)

13.1.1 Company Overview

13.1.2 Product/Business Segment Overview

13.1.3 Financial Updates

13.1.4 Key Developments

13.2 CA Technologies, Inc. (U.S.)

13.2.1 Company Overview

13.2.2 Product/Business Segment Overview

13.2.3 Financial Updates

13.2.4 Key Developments

13.3 Cavisson Systems Inc. (U.S.)

13.3.1 Company Overview

13.3.2 Product/Business Segment Overview

13.3.3 Financial Updates

13.3.4 Key Developments

13.4 CDNetworks (South Korea)

13.4.1 Company Overview

13.4.2 Product/Business Segment Overview

13.4.3 Financial Updates

13.4.4 Key Developments

13.5 Cloudflare, Inc. (U.S.)

13.5.1 Company Overview

13.5.2 Product/Business Segment Overview

13.5.3 Financial Updates

13.5.4 Key Developments

13.6 Dynatrace (U.S.)

13.6.1 Company Overview

13.6.2 Product/Business Segment Overview

13.6.3 Financial Updates

13.6.4 Key Developments

13.7 F5 Networks, Inc. (U.S.)

13.7.1 Company Overview

13.7.2 Product/Business Segment Overview

13.7.3 Financial Updates

13.7.4 Key Developments

13.8 IBM (U.S.)

13.8.1 Company Overview

13.8.2 Product/Business Segment Overview

13.8.3 Financial Updates

13.8.4 Key Developments

13.9 Micro Focus International plc. (U.K)

13.9.1 Company Overview

13.9.2 Product/Business Segment Overview

13.9.3 Financial Updates

13.9.4 Key Developments

13.10 Netmagic Solutions (India)

13.10.1 Company Overview

13.10.2 Product/Business Segment Overview

13.10.3 Financial Updates

13.10.4 Key Developments

13.11 Neustar, Inc. (U.S.)

13.11.1 Company Overview

13.11.2 Product/Business Segment Overview

13.11.3 Financial Updates

13.11.4 Key Developments

13.12 New Relic, Inc. (U.S.)

13.12.1 Company Overview

13.12.2 Product/Business Segment Overview

13.12.3 Financial Updates

13.12.4 Key Developments

13.13 ThousandEyes, Inc. (U.S.)

13.13.1 Company Overview

13.13.2 Product/Business Segment Overview

13.13.3 Financial Updates

13.13.4 Key Developments

13.14 ZenQ (U.S.)

13.14.1 Company Overview

13.14.2 Product/Business Segment Overview

13.14.3 Financial Updates

13.14.4 Key Developments

14 Conclusion

LIST OF TABLES

Table 1 Global Web Performance Market: By Region, 2023-2032

Table 2 North America Web Performance Market: By Country, 2023-2032

Table 3 Europe Web Performance Market: By Country, 2023-2032

Table 4 Asia-Pacific Web Performance Market: By Country, 2023-2032

Table 5 The Middle East & Africa Web Performance Market: By Country, 2023-2032

Table 6 Latin America Web Performance Market: By Country, 2023-2032

Table 7 Global Web Performance by Component Market: By Regions, 2023-2032

Table 8 North America Web Performance by Component Market: By Country, 2023-2032

Table 9 Europe Web Performance by Component Market: By Country, 2023-2032

Table10 Asia-Pacific Web Performance by Component Market: By Country, 2023-2032

Table11 The Middle East & Africa Web Performance by Component Market: By Country, 2023-2032

Table12 Latin America Web Performance by Component Market: By Country, 2023-2032

Table13 Global Web Performance by Organization Size Market: By Regions, 2023-2032

Table14 North America Web Performance by Organization Size Market: By Country, 2023-2032

Table15 Europe Web Performance by Organization Size Market: By Country, 2023-2032

Table16 Asia-Pacific Web Performance by Organization Size Market: By Country, 2023-2032

Table17 The Middle East & Africa Web Performance by Organization Size Market: By Country, 2023-2032

Table18 Latin America Web Performance by Organization Size Market: By Country, 2023-2032

Table19 Global Web Performance by Deployment Market: By Regions, 2023-2032

Table20 North America Web Performance by Deployment Market: By Country, 2023-2032

Table21 Europe Web Performance by Deployment Market: By Country, 2023-2032

Table22 Asia-Pacific Web Performance by Deployment Market: By Country, 2023-2032

Table23 The Middle East & Africa Web Performance by Deployment Market: By Country, 2023-2032

Table24 Latin America Web Performance by Deployment Market: By Country, 2023-2032

Table25 Global Web Performance by Vertical Market: By Regions, 2023-2032

Table26 North America Web Performance by Vertical Market: By Country, 2023-2032

Table27 Europe Web Performance by Vertical Market: By Country, 2023-2032

Table28 Asia-Pacific Web Performance by Vertical Market: By Country, 2023-2032

Table29 The Middle East & Africa Web Performance by Vertical Market: By Country, 2023-2032

Table30 Latin America Web Performance by Vertical Market: By Country, 2023-2032

Table31 Global Organization Size Market: By Region, 2023-2032

Table32 Global Deployment Market: By Region, 2023-2032

Table33 North America Web Performance Market, By Country

Table34 North America Web Performance Market, By Component

Table35 North America Web Performance Market, By Organization Size

Table36 North America Web Performance Market, By Deployment

Table37 North America Web Performance Market, By Vertical

Table38 Europe: Web Performance Market, By Country

Table39 Europe: Web Performance Market, By Component

Table40 Europe: Web Performance Market, By Organization Size

Table41 Europe: Web Performance Market, By Deployment

Table 42 Europe: Web Performance Market, By Vertical

Table43 Asia-Pacific: Web Performance Market, By Country

Table44 Asia-Pacific: Web Performance Market, By Component

Table 45 Asia-Pacific: Web Performance Market, By Organization Size

Table 46 Asia-Pacific: Web Performance Market, By Deployment

Table 47 Asia-Pacific: Web Performance Market, By Vertical

Table48 The Middle East & Africa: Web Performance Market, By Country

Table49 The Middle East & Africa Web Performance Market, By Component

Table50 The Middle East & Africa Web Performance Market, By Organization Size

Table51 The Middle East & Africa: Web Performance Market, By Deployment

Table52 The Middle East & Africa: Web Performance Market, By Vertical

Table53 Latin America: Web Performance Market, By Country

Table54 Latin America Web Performance Market, By Component

Table55 Latin America Web Performance Market, By Organization Size

Table56 Latin America: Web Performance Market, By Deployment

Table57 Latin America: Web Performance Market, By Vertical

LIST OF FIGURES

FIGURE 1 Global 
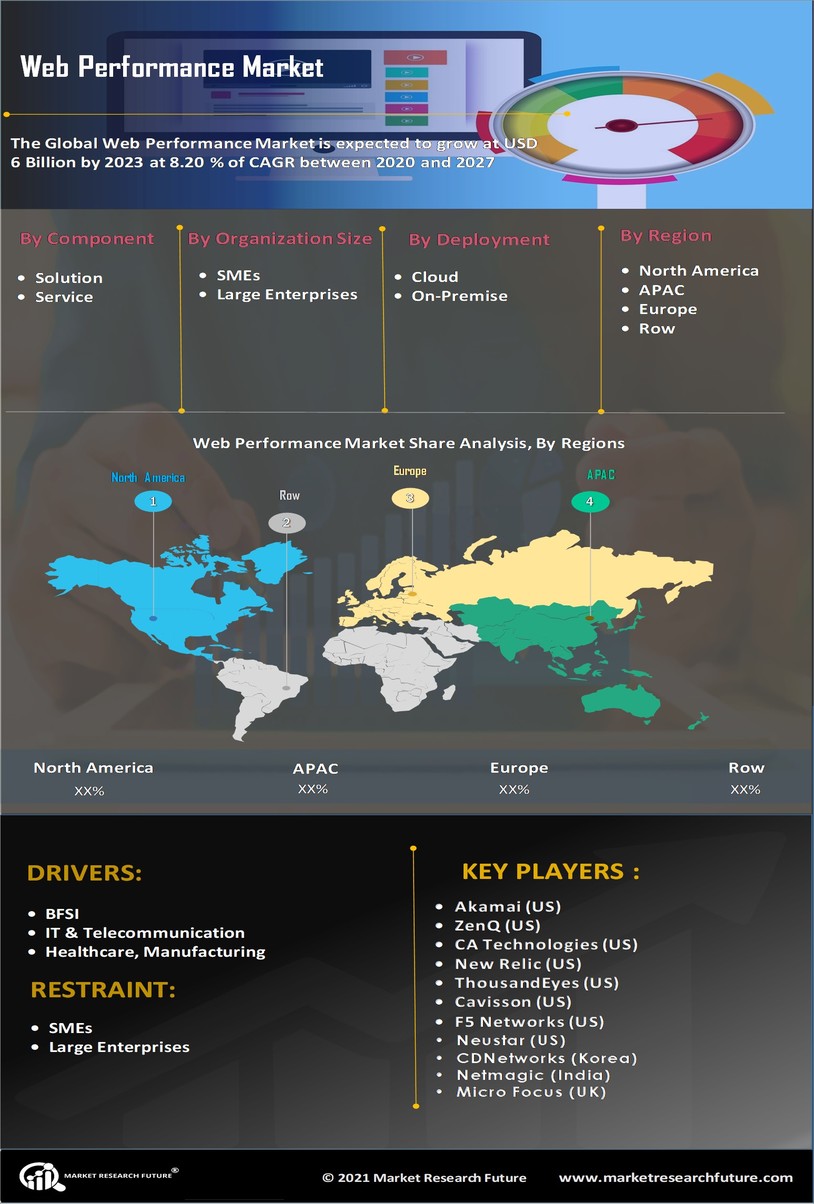
Web Performance Market Segmentation

FIGURE 2 Forecast Methodology

FIGURE 3 Five Forces Analysis of Global Web Performance Market

FIGURE 4 Value Chain of Global Web Performance Market

FIGURE 5 Share of Global Web Performance Market in 2023, by country (in %)

FIGURE 6 Global Web Performance Market, 2023-2032,

FIGURE 7 Sub segments of Component

FIGURE 8 Global Web Performance Market size by Component, 2023

FIGURE 9 Share of Global Web Performance Market by Component, 2023-2032

FIGURE 10 Global Web Performance Market size by Organization Size, 2023

FIGURE 11 Share of Global Web Performance Market by Organization Size, 2023-2032

FIGURE 12 Global Web Performance Market size by Deployment, 2023-2032

FIGURE 13 Share of Global Web Performance Market by Deployment, 2023-2032

FIGURE 14 Global Web Performance Market size by Vertical, 2023-2032

FIGURE 15 Share of Global Web Performance Market by Vertical, 2023-2032

Purchase Option
Single User $ 4,950
Multiuser License $ 5,950
Enterprise User $ 7,250
Compare Licenses
Tailored for You
  • Dedicated Research on any specifics segment or region.
  • Focused Research on specific players in the market.
  • Custom Report based only on your requirements.
  • Flexibility to add or subtract any chapter in the study.
  • Historic data from 2014 and forecasts outlook till 2040.
  • Flexibility of providing data/insights in formats (PDF, PPT, Excel).
  • Provide cross segmentation in applicable scenario/markets.