ID: MRFR/CR/7017-HCR | February 2021 | Region: Global | 111 pages
Market Scenario
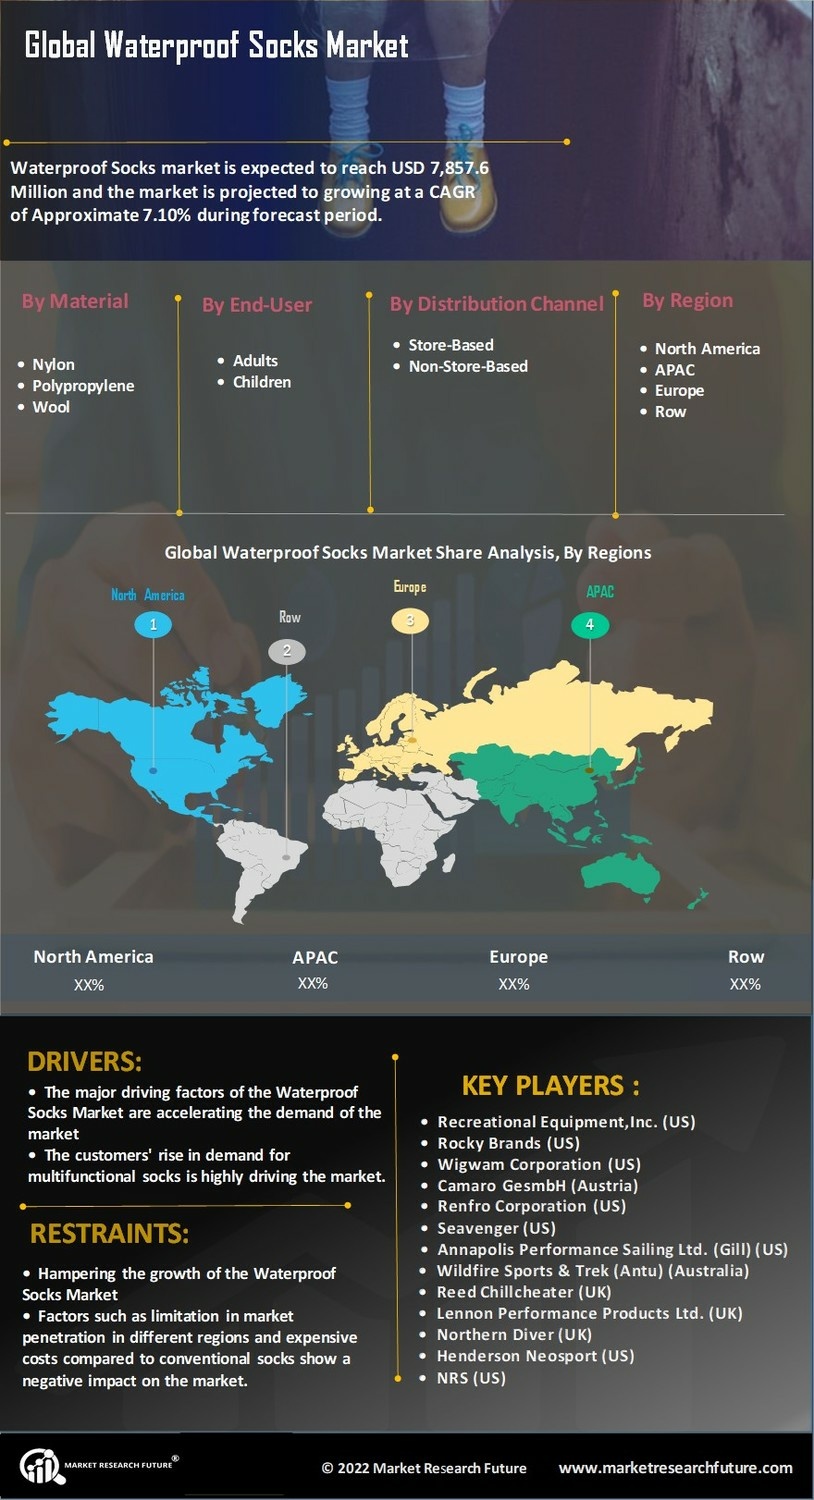
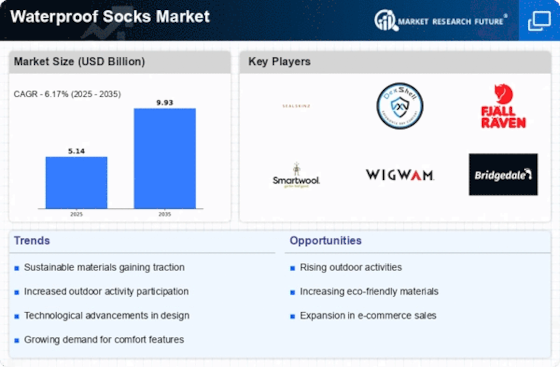
Waterproof Socks Market is projected to reach USD 6,850.4 Million by 2025 at a CAGR of 7.1% from 2019 to 2025. The global waterproof socks market is highly competitive with key industry players adopting various strategies such as product launches, expansions, and mergers & acquisitions to strengthen their market positions. There are several global brands, such as Sealskinz, Showers Pass, DexShell, Gill, and ANTU, dominating the waterproof socks market. There is an increasing demand for sportswear globally, which, in turn, driving the growth of the waterproof socks market. In 2019, the revenue for the global sportswear market is expected to generate revenue of USD 179 billion in revenue. Players in the market are focused on offering high-quality products to widen their customer bases. This factor is further expected to influence market growth in the coming years. To tap into the lucrative opportunities, many key players such as Recreational Equipment, Inc., Annapolis Performance Sailing Ltd., Reed Chillcheater, Wildfire Sports & Trek., Renfro Corporation, and Henderson Neosport are investing in the waterproof socks market. In October 2017, Showers Pass launched waterproof socks with features such as 3-layer waterproof breathable seamless Artex construction, Coolmax FX moisture-wicking knit lining, and reinforced toe and heel for durability.
Market Synopsis
The consistent demand for socks has encouraged manufacturers to come up with innovative products. Waterproof socks are gaining popularity among the targeted consumers who are involved in activities such as cycling, running, hiking, mountain biking, snow sports, and river rafting. The demand for waterproof socks is also increasing in the healthcare industry due to the antimicrobial features. DexShell offers waterproof socks with a breathable Porelle membrane construction with four-way stretch and cushioning for comfort, inner liners with antimicrobial properties; these socks are made from renewable bamboo viscose (bamboo rayon).
Waterproof socks have a membrane which is resistant to water. These socks are made of three layers—an outer layer that prevents abrasion, the inner layer for insulation and comfort, and the middle membrane that prevents water penetration and offers breathability by allowing the vapor to pass through. Manufacturers mostly use nylon, polypropylene, wool, and bamboo rayon for waterproof socks. The growing demand for multifunctional apparel and accessories that are windproof, waterproof, and breathable for outdoor activities such as snow sports and mountain biking is driving market growth. Also, market players are taking advantage of the growth of online platforms to increase their customer base.
However, low market penetration in developing countries such as Brazil, Mexico, India, Thailand, Peru, and South Africa are restraining the growth of the global waterproof socks market.
Market USP
Increasing global demand for sportswear
Market Drivers
Market Restraints
Segmentation
By Material
By End-Use
By Distribution Channel
By Region
Key Players
Frequently Asked Questions (FAQ) :
Waterproof Socks Market is projected to grow at a 7.1% CAGR between 2019-2025.
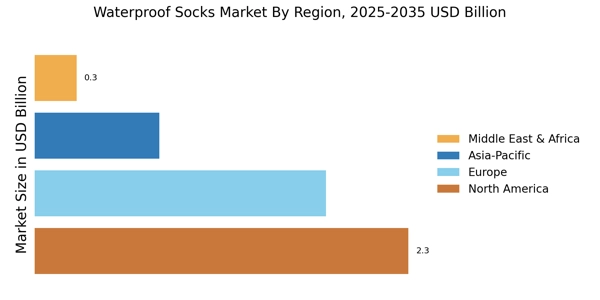
Europe is expected to dominate the Waterproof Socks Market.
Waterproof Socks Market is predicted to touch USD 6850.4 million by 2025.
Adults segment will lead the Waterproof Socks Market.
Low market penetration and high cost may limit the Waterproof Socks Market growth.
Table of Contents
1. EXECUTIVE SUMMARY
1.1. Market Attractiveness Analysis
1.1.1. Global Waterproof Socks Market, by Material
1.1.2. Global Waterproof Socks Market, by End User
1.1.3. Global Waterproof Socks Market, by Distribution Channel
1.1.4. Global Waterproof Socks Market, by Region
2. MARKET INTRODUCTION
2.1. Definition
2.2. Scope of the Study
2.3. Market Structure
2.4. Key Buying Criteria
2.5. Macro Factor Indicator Analysis
3. RESEARCH METHODOLOGY
3.1. Research Process
3.2. Primary Research
3.3. Secondary Research
3.4. Market Size Estimation
3.5. Forecast Model
3.6. List of Assumptions
4. MARKET DYNAMICS
4.1. Introduction
4.2. Drivers
4.3. Restraints
4.4. Opportunities
4.5. Challenges
5. MARKET FACTOR ANALYSIS
5.1. Value Chain Analysis
5.2. Supply Chain Analysis
5.3. Porter’s Five Forces Model
5.3.1. Bargaining Power of Suppliers
5.3.2. Bargaining Power of Buyers
5.3.3. Threat of New Entrants
5.3.4. Threat of Substitutes
5.3.5. Intensity of Rivalry
6. GLOBAL WATERPROOF SOCKS MARKET, BY MATERIAL
6.1. Introduction
6.2. Nylon
6.2.1. Nylon: Market Estimates & Forecast, by Region, 2019–2024
6.3. Polypropylene
6.3.1. Polypropylene: Market Estimates & Forecast, by Region, 2019–2024
6.4. Wool
6.4.1. Wool: Market Estimates & Forecast, by Region, 2019–2024
6.5. Bamboo Rayon
6.5.1. Bamboo Rayon: Market Estimates & Forecast, by Region, 2019–2024
6.6. Others
6.6.1. Others: Market Estimates & Forecast, by Region, 2019–2024
7. GLOBAL WATERPROOF SOCKS MARKET, BY END USER
7.1. Introduction
7.2. Children
7.2.1. Children: Market Estimates & Forecast, by Region, 2019–2024
7.3. Adults
7.3.1. Adults: Market Estimates & Forecast, by Region, 2019–2024
8. GLOBAL WATERPROOF SOCKS MARKET, BY DISTRIBUTION CHANNEL
8.1. Introduction
8.2. Store-Based
8.2.1. Store-Based: Market Estimates & Forecast, by Region, 2019–2024
8.2.2. Supermarkets & Hypermarkets
8.2.2.1. Supermarkets & Hypermarkets: Market Estimates & Forecast, by Region, 2019–2024
8.2.3. Specialty Stores
8.2.3.1. Specialty Stores: Market Estimates & Forecast, by Region, 2019–2024
8.2.4. Others
8.2.4.1. Others: Market Estimates & Forecast, by Region, 2019–2024
8.3. Non-Store-Based
8.3.1. Non-Store-Based: Market Estimates & Forecast, by Region, 2019–2024
9. GLOBAL WATERPROOF SOCKS MARKET MARKET, BY REGION
9.1. Introduction
9.2. North America
9.2.1. Market Estimates & Forecast, by Material, 2019–2024
9.2.2. Market Estimates & Forecast, by End User, 2019–2024
9.2.3. Market Estimates & Forecast, by Distribution Channel, 2019–2024
9.2.4. Market Estimates & Forecast, by Country, 2019–2024
9.2.5. US
9.2.5.1. Market Estimates & Forecast, by Material, 2019–2024
9.2.5.2. Market Estimates & Forecast, by End User, 2019–2024
9.2.5.3. Market Estimates & Forecast, by Distribution Channel, 2019–2024
9.2.6. Canada
9.2.6.1. Market Estimates & Forecast, by Material, 2019–2024
9.2.6.2. Market Estimates & Forecast, by End User, 2019–2024
9.2.6.3. Market Estimates & Forecast, by Distribution Channel, 2019–2024
9.2.7. Mexico
9.2.7.1. Market Estimates & Forecast, by Material, 2019–2024
9.2.7.2. Market Estimates & Forecast, by End User, 2019–2024
9.2.7.3. Market Estimates & Forecast, by Distribution Channel, 2019–2024
9.3. Europe
9.3.1. Market Estimates & Forecast, by Material, 2019–2024
9.3.2. Market Estimates & Forecast, by End User, 2019–2024
9.3.3. Market Estimates & Forecast, by Distribution Channel, 2019–2024
9.3.4. Market Estimates & Forecast, by Country, 2019–2024
9.3.5. Germany
9.3.5.1. Market Estimates & Forecast, by Material, 2019–2024
9.3.5.2. Market Estimates & Forecast, by End User, 2019–2024
9.3.5.3. Market Estimates & Forecast, by Distribution Channel, 2019–2024
9.3.6. UK
9.3.6.1. Market Estimates & Forecast, by Material, 2019–2024
9.3.6.2. Market Estimates & Forecast, by End User, 2019–2024
9.3.6.3. Market Estimates & Forecast, by Distribution Channel, 2019–2024
9.3.7. France
9.3.7.1. Market Estimates & Forecast, by Material, 2019–2024
9.3.7.2. Market Estimates & Forecast, by End User, 2019–2024
9.3.7.3. Market Estimates & Forecast, by Distribution Channel, 2019–2024
9.3.8. Spain
9.3.8.1. Market Estimates & Forecast, by Material, 2019–2024
9.3.8.2. Market Estimates & Forecast, by End User, 2019–2024
9.3.8.3. Market Estimates & Forecast, by Distribution Channel, 2019–2024
9.3.9. Italy
9.3.9.1. Market Estimates & Forecast, by Material, 2019–2024
9.3.9.2. Market Estimates & Forecast, by End User, 2019–2024
9.3.9.3. Market Estimates & Forecast, by Distribution Channel, 2019–2024
9.3.10. Rest of Europe
9.3.10.1. Market Estimates & Forecast, by Material, 2019–2024
9.3.10.2. Market Estimates & Forecast, by End User, 2019–2024
9.3.10.3. Market Estimates & Forecast, by Distribution Channel, 2019–2024
9.4. Asia-Pacific
9.4.1. Market Estimates & Forecast, by Material, 2019–2024
9.4.2. Market Estimates & Forecast, by End User, 2019–2024
9.4.3. Market Estimates & Forecast, by Distribution Channel, 2019–2024
9.4.4. Market Estimates & Forecast, by Country, 2019–2024
9.4.5. China
9.4.5.1. Market Estimates & Forecast, by Material, 2019–2024
9.4.5.2. Market Estimates & Forecast, by End User, 2019–2024
9.4.5.3. Market Estimates & Forecast, by Distribution Channel, 2019–2024
9.4.6. Japan
9.4.6.1. Market Estimates & Forecast, by Material, 2019–2024
9.4.6.2. Market Estimates & Forecast, by End User, 2019–2024
9.4.6.3. Market Estimates & Forecast, by Distribution Channel, 2019–2024
9.4.7. India
9.4.7.1. Market Estimates & Forecast, by Material, 2019–2024
9.4.7.2. Market Estimates & Forecast, by End User, 2019–2024
9.4.7.3. Market Estimates & Forecast, by Distribution Channel, 2019–2024
9.4.8. Australia & New Zealand
9.4.8.1. Market Estimates & Forecast, by Material, 2019–2024
9.4.8.2. Market Estimates & Forecast, by End User, 2019–2024
9.4.8.3. Market Estimates & Forecast, by Distribution Channel, 2019–2024
9.4.9. Rest of Asia-Pacific
9.4.9.1. Market Estimates & Forecast, by Material, 2019–2024
9.4.9.2. Market Estimates & Forecast, by End User, 2019–2024
9.4.9.3. Market Estimates & Forecast, by Distribution Channel, 2019–2024
9.5. Rest of the World
9.5.1. Market Estimates & Forecast, by Material, 2019–2024
9.5.2. Market Estimates & Forecast, by End User, 2019–2024
9.5.3. Market Estimates & Forecast, by Distribution Channel, 2019–2024
9.5.4. Market Estimates & Forecast, by Region, 2019–2024
9.5.5. South America
9.5.5.1. Market Estimates & Forecast, by Material, 2019–2024
9.5.5.2. Market Estimates & Forecast, by End User, 2019–2024
9.5.5.3. Market Estimates & Forecast, by Distribution Channel, 2019–2024
9.5.6. Middle East
9.5.6.1. Market Estimates & Forecast, by Material, 2019–2024
9.5.6.2. Market Estimates & Forecast, by End User, 2019–2024
9.5.6.3. Market Estimates & Forecast, by Distribution Channel, 2019–2024
9.5.7. Africa
9.5.7.1. Market Estimates & Forecast, by Material, 2019–2024
9.5.7.2. Market Estimates & Forecast, by End User, 2019–2024
9.5.7.3. Market Estimates & Forecast, by Distribution Channel, 2019–2024
10. COMPETITIVE LANDSCAPE
10.1. Introduction
10.2. Competitive Benchmarking
10.3. Development Share Analysis
10.4. Key Developments & Growth Strategies
11. COMPANY PROFILES
11.1. Recreational Equipment, Inc.
11.1.1. Company Overview
11.1.2. Financial Overview
11.1.3. Products Offered
11.1.4. Key Developments
11.1.5. SWOT Analysis
11.1.6. Key Strategies
11.2. Annapolis Performance Sailing Ltd.
11.2.1. Company Overview
11.2.2. Financial Overview
11.2.3. Products Offered
11.2.4. Key Developments
11.2.5. SWOT Analysis
11.2.6. Key Strategies
11.3. Reed Chillcheater
11.3.1. Company Overview
11.3.2. Financial Overview
11.3.3. Products Offered
11.3.4. Key Developments
11.3.5. SWOT Analysis
11.3.6. Key Strategies
11.4. Rocky Brands
11.4.1. Company Overview
11.4.2. Financial Overview
11.4.3. Products Offered
11.4.4. Key Developments
11.4.5. SWOT Analysis
11.4.6. Key Strategies
11.5. Wigwam Corporation
11.5.1. Company Overview
11.5.2. Financial Overview
11.5.3. Products Offered
11.5.4. Key Developments
11.5.5. SWOT Analysis
11.5.6. Key Strategies
11.6. Camaro GesmbH
11.6.1. Company Overview
11.6.2. Financial Overview
11.6.3. Products Offered
11.6.4. Key Developments
11.6.5. SWOT Analysis
11.6.6. Key Strategies
11.7. Renfro Corporation
11.7.1. Company Overview
11.7.2. Financial Overview
11.7.3. Products Offered
11.7.4. Key Developments
11.7.5. SWOT Analysis
11.7.6. Key Strategies
11.8. Seavenger
11.8.1. Company Overview
11.8.2. Financial Overview
11.8.3. Products Offered
11.8.4. Key Developments
11.8.5. SWOT Analysis
11.8.6. Key Strategies
11.9. Henderson Neosport
11.9.1. Company Overview
11.9.2. Financial Overview
11.9.3. Products Offered
11.9.4. Key Developments
11.9.5. SWOT Analysis
11.9.6. Key Strategies
11.10. NRS
11.10.1. Company Overview
11.10.2. Financial Overview
11.10.3. Products Offered
11.10.4. Key Developments
11.10.5. SWOT Analysis
11.10.6. Key Strategies
11.11. Bridgedale Outdoor Ltd
11.11.1. Company Overview
11.11.2. Financial Overview
11.11.3. Products Offered
11.11.4. Key Developments
11.11.5. SWOT Analysis
11.11.6. Key Strategies
11.12. Footland Inc.
11.12.1. Company Overview
11.12.2. Financial Overview
11.12.3. Products Offered
11.12.4. Key Developments
11.12.5. SWOT Analysis
11.12.6. Key Strategies
11.13. Lennon Performance Products Ltd.
11.13.1. Company Overview
11.13.2. Financial Overview
11.13.3. Products Offered
11.13.4. Key Developments
11.13.5. SWOT Analysis
11.13.6. Key Strategies
11.14. Northern Diver
11.14.1. Company Overview
11.14.2. Financial Overview
11.14.3. Products Offered
11.14.4. Key Developments
11.14.5. SWOT Analysis
11.14.6. Key Strategies
11.15. Wildfire Sports & Trek.
11.15.1. Company Overview
11.15.2. Financial Overview
11.15.3. Products Offered
11.15.4. Key Developments
11.15.5. SWOT Analysis
11.15.6. Key Strategies
12. APPENDIX
12.1. General Sources & References
12.2. List of Abbreviations
LIST OF TABLES
Table 1 Global Waterproof Socks Market, by Region, 2019–2024 (USD Million)
Table 2 Global Waterproof Socks Market, by Material, 2019–2024 (USD Million)
Table 3 Global Waterproof Socks Market, by End User, 2019–2024 (USD Million)
Table 4 Global Waterproof Socks Market, by Distribution Channel, 2019–2024 (USD Million)
Table 5 North America: Waterproof Socks Market, by Country, 2019–2024 (USD Million)
Table 6 North America: Waterproof Socks Market, by Material, 2019–2024 (USD Million)
Table 7 North America: Waterproof Socks Market, by End User, 2019–2024 (USD Million)
Table 8 North America: Waterproof Socks Market, by Distribution Channel, 2019–2024 (USD Million)
Table 9 US: Waterproof Socks Market, by Material, 2019–2024 (USD Million)
Table 10 US: Waterproof Socks Market, by End User, 2019–2024 (USD Million)
Table 11 US: Waterproof Socks Market, by Distribution Channel, 2019–2024 (USD Million)
Table 12 Canada: Waterproof Socks Market, by Material, 2019–2024 (USD Million)
Table 13 Canada: Waterproof Socks Market, by End User, 2019–2024 (USD Million)
Table 14 Canada: Waterproof Socks Market, by Distribution Channel, 2019–2024 (USD Million)
Table 15 Mexico: Waterproof Socks Market, by Material, 2019–2024 (USD Million)
Table 16 Mexico: Waterproof Socks Market, by End User, 2019–2024 (USD Million)
Table 17 Mexico: Waterproof Socks Market, by Distribution Channel, 2019–2024 (USD Million)
Table 18 Europe: Waterproof Socks Market, by Country, 2019–2024 (USD Million)
Table 19 Europe: Waterproof Socks Market, by Material, 2019–2024 (USD Million)
Table 20 Europe: Waterproof Socks Market, by End User, 2019–2024 (USD Million)
Table 21 Europe: Waterproof Socks Market, by Distribution Channel, 2019–2024 (USD Million)
Table 22 Germany: Waterproof Socks Market, by Material, 2019–2024 (USD Million)
Table 23 Germany: Waterproof Socks Market, by End User, 2019–2024 (USD Million)
Table 24 Germany: Waterproof Socks Market, by Distribution Channel, 2019–2024 (USD Million)
Table 25 France: Waterproof Socks Market, by Material, 2019–2024 (USD Million)
Table 26 France: Waterproof Socks Market, by End User, 2019–2024 (USD Million)
Table 27 France: Waterproof Socks Market, by Distribution Channel, 2019–2024 (USD Million)
Table 28 Italy: Waterproof Socks Market, by Material, 2019–2024 (USD Million)
Table 29 Italy: Waterproof Socks Market, by End User, 2019–2024 (USD Million)
Table 30 Italy: Waterproof Socks Market, by Distribution Channel, 2019–2024 (USD Million)
Table 31 Spain: Waterproof Socks Market, by Material, 2019–2024 (USD Million)
Table 32 Spain: Waterproof Socks Market, by End User, 2019–2024 (USD Million)
Table 33 Spain: Waterproof Socks Market, by Distribution Channel, 2019–2024 (USD Million)
Table 34 UK: Waterproof Socks Market, by Material, 2019–2024 (USD Million)
Table 35 UK: Waterproof Socks Market, by End User, 2019–2024 (USD Million)
Table 36 UK: Waterproof Socks Market, by Distribution Channel, 2019–2024 (USD Million)
Table 37 Rest of Europe: Waterproof Socks Market, by Material, 2019–2024 (USD Million)
Table 38 Rest of Europe: Waterproof Socks Market, by End User, 2019–2024 (USD Million)
Table 39 Rest of Europe: Waterproof Socks Market, by Distribution Channel, 2019–2024 (USD Million)
Table 40 Asia-Pacific: Waterproof Socks Market, by Country, 2019–2024 (USD Million)
Table 41 Asia-Pacific: Waterproof Socks Market, by Material, 2019–2024 (USD Million)
Table 42 Asia-Pacific: Waterproof Socks Market, by End User, 2019–2024 (USD Million)
Table 43 Asia-Pacific: Waterproof Socks Market, by Distribution Channel, 2019–2024 (USD Million)
Table 44 China: Waterproof Socks Market, by Material, 2019–2024 (USD Million)
Table 45 China: Waterproof Socks Market, by End User, 2019–2024 (USD Million)
Table 46 China: Waterproof Socks Market, by Distribution Channel, 2019–2024 (USD Million)
Table 47 India: Waterproof Socks Market, by Material, 2019–2024 (USD Million)
Table 48 India: Waterproof Socks Market, by End User, 2019–2024 (USD Million)
Table 49 India: Waterproof Socks Market, by Distribution Channel, 2019–2024 (USD Million)
Table 50 Japan: Waterproof Socks Market, by Material, 2019–2024 (USD Million)
Table 51 Japan: Waterproof Socks Market, by End User, 2019–2024 (USD Million)
Table 52 Japan: Waterproof Socks Market, by Distribution Channel, 2019–2024 (USD Million)
Table 53 Rest of Asia-Pacific: Waterproof Socks Market, by Material, 2019–2024 (USD Million)
Table 54 Rest of Asia-Pacific: Waterproof Socks Market, by End User, 2019–2024 (USD Million)
Table 55 Rest of Asia-Pacific: Waterproof Socks Market, by Distribution Channel, 2019–2024 (USD Million)
Table 56 Rest of the World (RoW): Waterproof Socks Market, by Country, 2019–2024 (USD Million)
Table 57 Rest of the World (RoW): Waterproof Socks Market, by Material, 2019–2024 (USD Million)
Table 58 Rest of the World (RoW): Waterproof Socks Market, by End User, 2019–2024 (USD Million)
Table 59 Rest of the World (RoW): Waterproof Socks Market, by Distribution Channel, 2019–2024 (USD Million)
Table 60 South America: Waterproof Socks Market, by Material, 2019–2024 (USD Million)
Table 61 South America: Waterproof Socks Market, by End User, 2019–2024 (USD Million)
Table 62 South America: Waterproof Socks Market, by Distribution Channel, 2019–2024 (USD Million)
Table 63 Middle East: Waterproof Socks Market, by Material, 2019–2024 (USD Million)
Table 64 Middle East: Waterproof Socks Market, by End User, 2019–2024 (USD Million)
Table 65 Middle East: Waterproof Socks Market, by Distribution Channel, 2019–2024 (USD Million)
Table 66 Africa: Waterproof Socks Market, by Material, 2019–2024 (USD Million)
Table 67 Africa: Waterproof Socks Market, by End User, 2019–2024 (USD Million)
Table 68 Africa: Waterproof Socks Market, by Distribution Channel, 2019–2024 (USD Million)
LIST OF FIGURES
FIGURE 1 Global Waterproof Socks Market Segmentation
FIGURE 2 Forecast Research Methodology
FIGURE 3 Five Forces Analysis of the Global Waterproof Socks Market
FIGURE 4 Value Chain of the Global Waterproof Socks Market
FIGURE 5 Share of the Global Waterproof Socks Market in 2018, by Country (%)
FIGURE 6 Global Waterproof Socks Market, by Region, 2019–2024
FIGURE 7 Global Waterproof Socks Market Size, by Material, 2018
FIGURE 8 Share of the Global Waterproof Socks Market, by Material, 2019–2024 (%)
FIGURE 9 Global Waterproof Socks Market Size, by End User, 2018
FIGURE 10 Share of the Global Waterproof Socks Market, by End User, 2019–2024 (%)
FIGURE 11 Global Waterproof Socks Market Size, by Distribution Channel, 2018
FIGURE 12 Share of the Global Waterproof Socks Market, by Distribution Channel, 2019–2024 (%)