Certified Global Research Member
Isomar fd.webp Wcrc 57.webp
Key Questions Answered
  • Global Market Outlook
  • In-depth analysis of global and regional trends
  • Analyze and identify the major players in the market, their market share, key developments, etc.
  • To understand the capability of the major players based on products offered, financials, and strategies.
  • Identify disrupting products, companies, and trends.
  • To identify opportunities in the market.
  • Analyze the key challenges in the market.
  • Analyze the regional penetration of players, products, and services in the market.
  • Comparison of major players’ financial performance.
  • Evaluate strategies adopted by major players.
  • Recommendations
Why Choose Market Research Future?
  • Vigorous research methodologies for specific market.
  • Knowledge partners across the globe
  • Large network of partner consultants.
  • Ever-increasing/ Escalating data base with quarterly monitoring of various markets
  • Trusted by fortune 500 companies/startups/ universities/organizations
  • Large database of 5000+ markets reports.
  • Effective and prompt pre- and post-sales support.

Visual Analytics Market Research Report: Information By Component (Software, Services), By Deployment (On-Demand, On-Premise), By Industry (IT, Retail, BFSI, Manufacturing, Military & Defense, Transportation & Logistics, Others)And By Region (North America, Europe, Asia-Pacific, And Rest Of The World) –Market Forecast Till 2032.


ID: MRFR/ICT/3392-HCR | 100 Pages | Author: Aarti Dhapte| April 2024

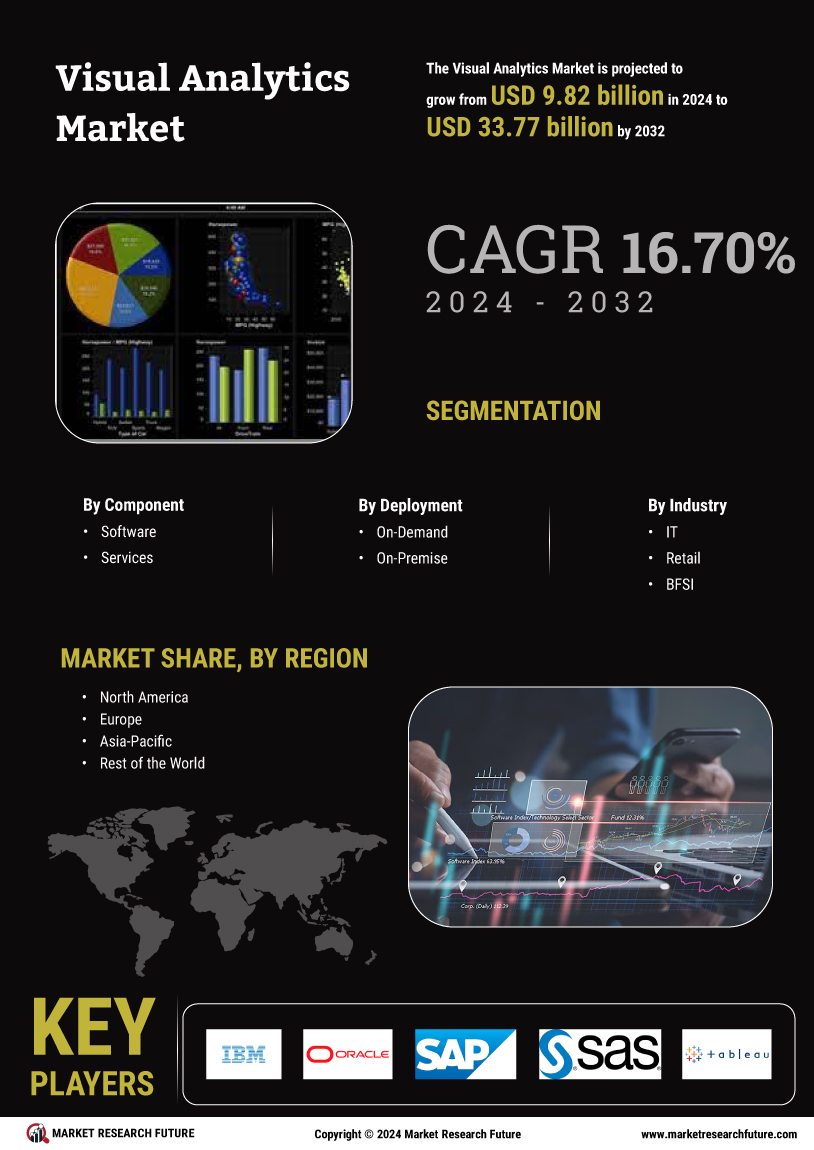
Visual Analytics Market Segmentation


Visual Analytics Component Software Outlook (USD Billion, 2018-2032)


  • Software


  • Services


Visual Analytics Deployment Outlook (USD Billion, 2018-2032)


  • On-Demand


  • On-Premise


Visual Analytics Industry Outlook (USD Billion, 2018-2032)


  • IT


  • Retail


  • BFSI


  • Manufacturing


  • Military & Defense


  • Transportation & Logistics


  • Others


Visual Analytics Regional Outlook (USD Billion, 2018-2032)


  • North America Outlook (USD Billion, 2018-2032)


    • North America Visual Analytics by Component Software


      • Software


      • Services


    • North America Visual Analytics by Deployment


      • On-Demand


      • On-Premise


    • North America Visual Analytics by Industry


      • IT


      • Retail


      • BFSI


      • Manufacturing


      • Military & Defense


      • Transportation & Logistics


      • Others


    • US Outlook (USD Billion, 2018-2032)


    • US Visual Analytics by Component Software


      • Software


      • Services


    • US Visual Analytics Deployment


      • On-Demand


      • On-Premise


    • US Visual Analytics by Industry


      • IT


      • Retail


      • BFSI


      • Manufacturing


      • Military & Defense


      • Transportation & Logistics


      • Others


    • CANADA Outlook (USD Billion, 2018-2032)


    • CANADA Visual Analytics by Component Software


      • Software


      • Services


    • CANADA Visual Analytics by Deployment


      • On-Demand


      • On-Premise


    • CANADA Visual Analytics by Industry


      • IT


      • Retail


      • BFSI


      • Manufacturing


      • Military & Defense


      • Transportation & Logistics


      • Others


  • Europe Outlook (USD Billion, 2018-2032)


    • Europe Visual Analytics by Component Software


      • Software


      • Services


    • Europe Visual Analytics by Deployment


      • On-Demand


      • On-Premise


    • Europe Visual Analytics by Industry


      • IT


      • Retail


      • BFSI


      • Manufacturing


      • Military & Defense


      • Transportation & Logistics


      • Others


    • Germany Outlook (USD Billion, 2018-2032)


    • Germany Visual Analytics by Component Software


      • Software


      • Services


    • Germany Visual Analytics by Deployment


      • On-Demand


      • On-Premise


    • Germany Visual Analytics by Industry


      • IT


      • Retail


      • BFSI


      • Manufacturing


      • Military & Defense


      • Transportation & Logistics


      • Others


    • France Outlook (USD Billion, 2018-2032)


    • France Visual Analytics by Component Software


      • Software


      • Services


    • France Visual Analytics by Deployment


      • On-Demand


      • On-Premise


    • France Visual Analytics by Industry


      • IT


      • Retail


      • BFSI


      • Manufacturing


      • Military & Defense


      • Transportation & Logistics


      • Others


    • UK Outlook (USD Billion, 2018-2032)


    • UK Visual Analytics by Component Software


      • Software


      • Services


    • UK Visual Analytics by Deployment


      • On-Demand


      • On-Premise


    • UK Visual Analytics by Industry


      • IT


      • Retail


      • BFSI


      • Manufacturing


      • Military & Defense


      • Transportation & Logistics


      • Others


    • ITALY Outlook (USD Billion, 2018-2032)


    • ITALY Visual Analytics by Component Software


      • Software


      • Services


    • ITALY Visual Analytics by Deployment


      • On-Demand


      • On-Premise


    • ITALY Visual Analytics by Industry


      • IT


      • Retail


      • BFSI


      • Manufacturing


      • Military & Defense


      • Transportation & Logistics


      • Others


    • SPAIN Outlook (USD Billion, 2018-2032)


    • Spain Visual Analytics by Component Software


      • Software


      • Services


      • Others


    • Spain Visual Analytics by Deployment


      • On-Demand


      • On-Premise


    • Spain Visual Analytics by Industry


      • IT


      • Retail


      • BFSI


      • Manufacturing


      • Military & Defense


      • Transportation & Logistics


      • Others


    • Rest Of Europe Outlook (USD Billion, 2018-2032)


    • Rest Of Europe Visual Analytics by Component Software


      • Software


      • Services


    • REST OF EUROPE Visual Analytics by Deployment


      • On-Demand


      • On-Premise


    • REST OF EUROPE Visual Analytics by Industry


      • IT


      • Retail


      • BFSI


      • Manufacturing


      • Military & Defense


      • Transportation & Logistics


      • Others


  • Asia-Pacific Outlook (USD Billion, 2018-2032)


    • Asia-Pacific Visual Analytics by Component Software


      • Software


      • Services


    • Asia-Pacific Visual Analytics by Deployment


      • On-Demand


      • On-Premise


    • Asia-Pacific Visual Analytics by Industry


      • IT


      • Retail


      • BFSI


      • Manufacturing


      • Military & Defense


      • Transportation & Logistics


      • Others


  • China Outlook (USD Billion, 2018-2032)


    • China Visual Analytics by Component Software


      • Software


      • Services


    • China Visual Analytics by Deployment


      • On-Demand


      • On-Premise


    • China Visual Analytics by Industry


      • IT


      • Retail


      • BFSI


      • Manufacturing


      • Military & Defense


      • Transportation & Logistics


      • Others


    • Japan Outlook (USD Billion, 2018-2032)


    • Japan Visual Analytics by Component Software


      • Software


      • Services


    • Japan Visual Analytics by Deployment


      • On-Demand


      • On-Premise


    • Japan Visual Analytics by Industry


      • IT


      • Retail


      • BFSI


      • Manufacturing


      • Military & Defense


      • Transportation & Logistics


      • Others


    • India Outlook (USD Billion, 2018-2032)


    • India Visual Analytics by Component Software


      • Software


      • Services


    • India Visual Analytics by Deployment


      • On-Demand


      • On-Premise


    • India Visual Analytics by Industry


      • IT


      • Retail


      • BFSI


      • Manufacturing


      • Military & Defense


      • Transportation & Logistics


      • Others


    • Australia Outlook (USD Billion, 2018-2032)


    • Australia Visual Analytics by Component Software


      • Software


      • Services


    • Australia Visual Analytics by Deployment


      • On-Demand


      • On-Premise


    • Australia Visual Analytics by Industry


      • IT


      • Retail


      • BFSI


      • Manufacturing


      • Military & Defense


      • Transportation & Logistics


      • Others


    • Rest of Asia-Pacific Outlook (USD Billion, 2018-2032)


    • Rest of Asia-Pacific Visual Analytics by Component Software


      • Software


      • Services


    • Rest of Asia-Pacific Visual Analytics by Deployment


      • On-Demand


      • On-Premise


    • Rest of Asia-Pacific Visual Analytics by Industry


      • IT


      • Retail


      • BFSI


      • Manufacturing


      • Military & Defense


      • Transportation & Logistics


      • Others


  • Rest of the World Outlook (USD Billion, 2018-2032)


    • Rest of the World Visual Analytics by Component Software


      • Software


      • Services


    • Rest of the World Visual Analytics by Deployment


      • On-Demand


      • On-Premise


    • Rest of the World Visual Analytics by Industry


      • IT


      • Retail


      • BFSI


      • Manufacturing


      • Military & Defense


      • Transportation & Logistics


      • Others


    • Middle East Outlook (USD Billion, 2018-2032)


    • Middle East Visual Analytics by Component Software


      • Software


      • Services


    • Middle East Visual Analytics by Deployment


      • On-Demand


      • On-Premise


    • Middle East Visual Analytics by Industry


      • IT


      • Retail


      • BFSI


      • Manufacturing


      • Military & Defense


      • Transportation & Logistics


      • Others


    • Africa Outlook (USD Billion, 2018-2032)


    • Africa Visual Analytics by Component Software


      • Software


      • Services


    • Africa Visual Analytics by Deployment


      • On-Demand


      • On-Premise


    • Africa Visual Analytics by Industry


      • IT


      • Retail


      • BFSI


      • Manufacturing


      • Military & Defense


      • Transportation & Logistics


      • Others


    • Latin America Outlook (USD Billion, 2018-2032)


    • Latin America Visual Analytics by Component Software


      • Software


      • Services


    • Latin America Visual Analytics by Deployment


      • On-Demand


      • On-Premise


    • Latin America Visual Analytics by Industry


      • IT


      • Retail


      • BFSI


      • Manufacturing


      • Military & Defense


      • Transportation & Logistics


      • Others


Leading companies partner with us for data-driven Insights
client_1 client_2 client_3 client_4 client_5 client_6 client_7 client_8 client_9 client_10
Please fill in Business Email for Quick Response

TABLE OF CONTENTS

1 Executive Summary

2 Scope of the Report

2.1 Market Definition

2.2 Scope of the Study

2.2.1 Research Objectives

2.2.2 Assumptions & Limitations

2.3 Markets Structure

3 Market Research Methodology

3.1 Research Process

3.2 Secondary Research

3.3 Primary Research

3.4 Forecast Model

4 Market Landscape

4.1 Five Forces Analysis

4.1.1 Threat of New Entrants

4.1.2 Bargaining power of buyers

4.1.3 Threat of substitutes

4.1.4 Segment rivalry

4.2 Value Chain/Supply Chain of Global Visual Analytics Market

5 Industry Overview of Global Visual Analytics Market

5.1 Introduction

5.2 Growth Drivers

5.3 Impact analysis

5.4 Market Challenges

6 Market Trends

6.1 Introduction

6.2 Growth Trends

6.3 Impact analysis

7. Global Visual Analytics Market by Component

7.1 Introduction

7.2 Software

7.2.1 Market Estimates & Forecast, 2020-2027

7.2.2 Market Estimates & Forecast by Region, 2020-2027

7.3 Services

7.3.1 Market Estimates & Forecast, 2020-2027

7.3.2 Market Estimates & Forecast by Region, 2020-2027

8. Global Visual Analytics Market by Deployment

8.1 Introduction

8.2 On-Premise

8.2.1 Market Estimates & Forecast, 2020-2027

8.2.2 Market Estimates & Forecast by Region, 2020-2027

8.3 On-Demand

8.3.1 Market Estimates & Forecast, 2020-2027

8.3.2 Market Estimates & Forecast by Region, 2020-2027

9. Global Visual Analytics Market by Industry

9.1 Introduction

9.2 IT

9.2.1 Market Estimates & Forecast, 2020-2027

9.2.2 Market Estimates & Forecast by Region, 2020-2027

9.3 BFSI

9.3.1 Market Estimates & Forecast, 2020-2027

9.3.2 Market Estimates & Forecast by Region, 2020-2027

9.4 Retail

9.4.1 Market Estimates & Forecast, 2020-2027

9.4.2 Market Estimates & Forecast by Region, 2020-2027

9.5 Manufacturing

9.5.1 Market Estimates & Forecast, 2020-2027

9.5.2 Market Estimates & Forecast by Region, 2020-2027

9.6 Military & Defense

9.6.1 Market Estimates & Forecast, 2020-2027

9.6.2 Market Estimates & Forecast by Region, 2020-2027

9.7 Transportation & Logistics

9.7.1 Market Estimates & Forecast, 2020-2027

9.7.2 Market Estimates & Forecast by Region, 2020-2027

10.Global Visual Analytics Market by Region

10.1 Introduction

10.2 North America

10.2.1 Market Estimates & Forecast, 2020-2027

10.2.2 Market Estimates & Forecast by Component, 2020-2027

10.2.3 Market Estimates & Forecast by Deployment, 2020-2027

10.2.4 Market Estimates & Forecast by Industry, 2020-2027

10.2.5 U.S.

10.2.5.1 Market Estimates & Forecast, 2020-2027

10.2.5.2 Market Estimates & Forecast by Component, 2020-2027

10.2.5.3 Market Estimates & Forecast by Deployment, 2020-2027

10.2.4 Market Estimates & Forecast by Industry, 2020-2027

10.2.6 Mexico

10.2.6.1 Market Estimates & Forecast, 2020-2027

10.2.6.2 Market Estimates & Forecast by Component, 2020-2027

10.2.6.3 Market Estimates & Forecast by Deployment, 2020-2027

10.2.6.4 Market Estimates & Forecast by Industry, 2020-2027

10.2.7 Canada

10.2.7.1 Market Estimates & Forecast, 2020-2027

10.2.7.2 Market Estimates & Forecast by Component, 2020-2027

10.2.7.3 Market Estimates & Forecast by Deployment, 2020-2027

10.2.7.4 Market Estimates & Forecast by Industry, 2020-2027

10.3 Europe

10.3.1 Market Estimates & Forecast, 2020-2027

10.3.2 Market Estimates & Forecast by Component, 2020-2027

10.3.3 Market Estimates & Forecast by Deployment, 2020-2027

10.3.4 Market Estimates & Forecast by Industry, 2020-2027

10.3.5 Germany

10.3.5.1 Market Estimates & Forecast, 2020-2027

10.3.5.2 Market Estimates & Forecast by Component, 2020-2027

10.3.5.3 Market Estimates & Forecast by Deployment, 2020-2027

10.3.5.4 Market Estimates & Forecast by Industry, 2020-2027

10.3.6. France

10.3.6.1 Market Estimates & Forecast, 2020-2027

10.3.6.2 Market Estimates & Forecast by Component, 2020-2027

10.3.6.3 Market Estimates & Forecast by Deployment, 2020-2027

10.3.6.4 Market Estimates & Forecast by Industry, 2020-2027

10.3.7 Italy

10.3.7.1 Market Estimates & Forecast, 2020-2027

10.3.7.2 Market Estimates & Forecast by Component, 2020-2027

10.3.7.3 Market Estimates & Forecast by Deployment, 2020-2027

10.3.7.4 Market Estimates & Forecast by Industry, 2020-2027

10.3.10 Spain

10.3.10.1 Market Estimates & Forecast, 2020-2027

10.3.10.2 Market Estimates & Forecast by Component, 2020-2027

10.3.10.3 Market Estimates & Forecast by Deployment 2020-2027

10.3.10.4 Market Estimates & Forecast by Industry, 2020-2027

10.3.10 UK

10.3.10.1 Market Estimates & Forecast, 2020-2027

10.3.10.2 Market Estimates & Forecast by Component, 2020-2027

10.3.10.3 Market Estimates & Forecast by Deployment, 2020-2027

10.2.10.4 Market Estimates & Forecast by Industry, 2020-2027

10.4 Asia Pacific

10.4.1 Market Estimates & Forecast, 2020-2027

10.4.2 Market Estimates & Forecast by Component, 2020-2027

10.4.3 Market Estimates & Forecast by Deployment, 2020-2027

10.4.4 Market Estimates & Forecast by Industry, 2020-2027

10.4.5 China

10.4.5.1 Market Estimates & Forecast, 2020-2027

10.4.5.2 Market Estimates & Forecast by Component, 2020-2027

10.4.5.3 Market Estimates & Forecast by Deployment, 2020-2027

10.4.5.4 Market Estimates & Forecast by Industry, 2020-2027

10.4.6 India

10.4.6.1 Market Estimates & Forecast, 2020-2027

10.4.6.2 Market Estimates & Forecast by Component, 2020-2027

10.4.6.3 Market Estimates & Forecast by Deployment, 2020-2027

10.4.6.4 Market Estimates & Forecast by Industry, 2020-2027

10.4.7 Japan

10.4.7.1 Market Estimates & Forecast, 2020-2027

10.4.7.2 Market Estimates & Forecast by Component, 2020-2027

10.4.7.3 Market Estimates & Forecast by Deployment, 2020-2027

10.4.7.4 Market Estimates & Forecast by Industry, 2020-2027

10.4.10 Rest of Asia-Pacific

10.4.10.1 Market Estimates & Forecast, 2020-2027

10.4.10.2 Market Estimates & Forecast by Component, 2020-2027

10.4.10.3 Market Estimates & Forecast by Deployment, 2020-2027

10.4.10.4 Market Estimates & Forecast by Industry, 2020-2027

10.5 Rest of the world

10.5.1 Market Estimates & Forecast, 2020-2027

10.5.2 Market Estimates & Forecast by Component, 2020-2027

10.5.3 Market Estimates & Forecast by Deployment, 2020-2027

10.5.4 Market Estimates & Forecast by Industry, 2020-2027

10.5.4 The Middle East & Africa

10.5.4.1 Market Estimates & Forecast, 2020-2027

10.5.4.2 Market Estimates & Forecast by Component, 2020-2027

10.5.4.3 Market Estimates & Forecast by Deployment, 2020-2027

10.5.4.4 Market Estimates & Forecast by Industry, 2020-2027

10.5.5 Latin Countries

10.5.5.1 Market Estimates & Forecast, 2020-2027

10.5.5.2 Market Estimates & Forecast by Component, 2020-2027

10.5.5.3 Market Estimates & Forecast by Deployment, 2020-2027

10.5.5.4 Market Estimates & Forecast by Industry, 2020-2027

11. Company Landscape

12. Company Profiles

12.1 IBM Corporation (U.S.)

12.1.1 Company Overview

12.1.2 Product/Business Segment Overview

12.1.3 Financial Updates

12.1.4 Key Developments

12.2 Oracle Corporation (U.S.)

12.2.1 Company Overview

12.2.2 Product/Business Segment Overview

12.2.3 Financial Updates

12.2.4 Key Developments

12.3 SAP AG (Germany)

12.3.1 Company Overview

12.3.2 Product/Business Segment Overview

12.3.3 Financial Updates

12.3.4 Key Developments

12.4 SAS Institute (U.S.)

12.4.1 Company Overview

12.4.2 Product/Business Segment Overview

12.4.3 Financial Updates

12.4.4 Key Developments

12.5 Tableau Software (U.S.)

12.5.1 Company Overview

12.5.2 Product/Business Segment Overview

12.5.3 Financial Updates

12.5.4 Key Developments

12.6 Microsoft (U.S.)

12.6.1 Company Overview

12.6.2 Product/Business Segment Overview

12.6.3 Financial Updates

12.6.4 Key Developments

12.7 MicroStrategy Inc. (U.S.)

12.7.1 Company Overview

12.7.2 Product/Business Segment Overview

12.7.3 Financial Updates

12.7.4 Key Developments

12.8 TIBCO Software (U.S.)

12.8.1 Company Overview

12.8.2 Product/Business Segment Overview

12.8.3 Financial Updates

12.8.4 Key Developments

12.9 Qlik (U.S.)

12.9.1 Company Overview

12.9.2 Product/Business Segment Overview

12.9.3 Financial Updates

12.9.4 Key Developments

13 Conclusion

LIST OF TABLES

Table 1 Global Visual Analytics Market: By Region, 2020-2027

Table 2 North America Visual Analytics Market: By Country, 2020-2027

Table 3 Europe Visual Analytics Market: By Country, 2020-2027

Table 4 Asia-Pacific Visual Analytics Market: By Country, 2020-2027

Table 5 Middle East & Africa Visual Analytics Market: By Country, 2020-2027

Table 6 Latin America Visual Analytics Market: By Country, 2020-2027

Table 7 Global Visual Analytics by Component Market: By Regions, 2020-2027

Table 8 North America Visual Analytics by Component Market: By Country, 2020-2027

Table9 Europe Visual Analytics by Component Market: By Country, 2020-2027

Table10 Asia-Pacific Visual Analytics by Component Market: By Country, 2020-2027

Table11 Middle East & Africa Visual Analytics by Component Market: By Country, 2020-2027

Table12 Latin America Visual Analytics by Component Market: By Country, 2020-2027

Table13 Global Visual Analytics by Industry Market: By Regions, 2020-2027

Table14 North America Visual Analytics by Industry Market: By Country, 2020-2027

Table15 Europe Visual Analytics by Industry Market: By Country, 2020-2027

Table16 Asia-Pacific Visual Analytics by Industry Market: By Country, 2020-2027

Table17 Middle East & Africa Visual Analytics by Industry Market: By Country, 2020-2027

Table18 Latin America Visual Analytics by Industry Market: By Country, 2020-2027

Table19 North America Visual Analytics for Form Market: By Country, 2020-2027

Table20 Europe Visual Analytics for Form Market: By Country, 2020-2027

Table21 Asia-Pacific Visual Analytics for Form Market: By Country, 2020-2027

Table22 Middle East & Africa Visual Analytics for Form Market: By Country, 2020-2027

Table23 Latin America Visual Analytics for Form Market: By Country, 2020-2027

Table24 Global Component Market: By Region, 2020-2027

Table25 North America Visual Analytics Market, By Country

Table26 North America Visual Analytics Market, By Component

Table27 North America Visual Analytics Market, By Deployment

Table28 North America Visual Analytics Market, By Industry

Table29 Europe: Visual Analytics Market, By Country

Table30 Europe: Visual Analytics Market, By Component

Table31 Europe: Visual Analytics Market, By Deployment

Table 32 Europe: Visual Analytics Market, By Industry

Table33Asia-Pacific: Visual Analytics Market, By Country

Table34 Asia-Pacific: Visual Analytics Market, By Component

Table35 Asia-Pacific: Visual Analytics Market, By Deployment

Table 36 Asia-Pacific: Visual Analytics Market, By Industry

Table37Middle East & Africa: Visual Analytics Market, By Country

Table38 Middle East & Africa Visual Analytics Market, By Component

Table39 Middle East & Africa Visual Analytics Market, By Deployment

Table40 Middle East & Africa: Visual Analytics Market, By Industry

Table41 Latin America: Visual Analytics Market, By Country

Table42 Latin America Visual Analytics Market, By Component

Table43 Latin America Visual Analytics Market, By Deployment

Table44 Latin America: Visual Analytics Market, By Industry

LIST OF FIGURES

FIGURE 1 Global Visual Analytics Market segmentation

FIGURE 2 Forecast Methodology

FIGURE 3 Five Forces Analysis of Global Visual Analytics Market

FIGURE 4 Value Chain of Global Visual Analytics Market

FIGURE 5 Share of Global Visual Analytics Market in 2020, by country (in %)

FIGURE 6 Global Visual Analytics Market, 2020-2027,

FIGURE 7 Sub segments of Component

FIGURE 10 Global Visual Analytics Market size by Component, 2020

FIGURE 11 Share of Global Visual Analytics Market by Component, 2020 TO 2027

FIGURE 12 Global Visual Analytics Market size by Deployment, 2020

FIGURE 13 Share of Global Visual Analytics Market by Deployment, 2020 TO 2027

FIGURE 14 Global Visual Analytics Market size by Industry, 2020 TO 2027

FIGURE 15 Share of Global Visual Analytics Market by Industry, 2020 TO 2027

Purchase Option
Single User $ 4,950
Multiuser License $ 5,950
Enterprise User $ 7,250
Compare Licenses
Tailored for You
  • Dedicated Research on any specifics segment or region.
  • Focused Research on specific players in the market.
  • Custom Report based only on your requirements.
  • Flexibility to add or subtract any chapter in the study.
  • Historic data from 2014 and forecasts outlook till 2040.
  • Flexibility of providing data/insights in formats (PDF, PPT, Excel).
  • Provide cross segmentation in applicable scenario/markets.