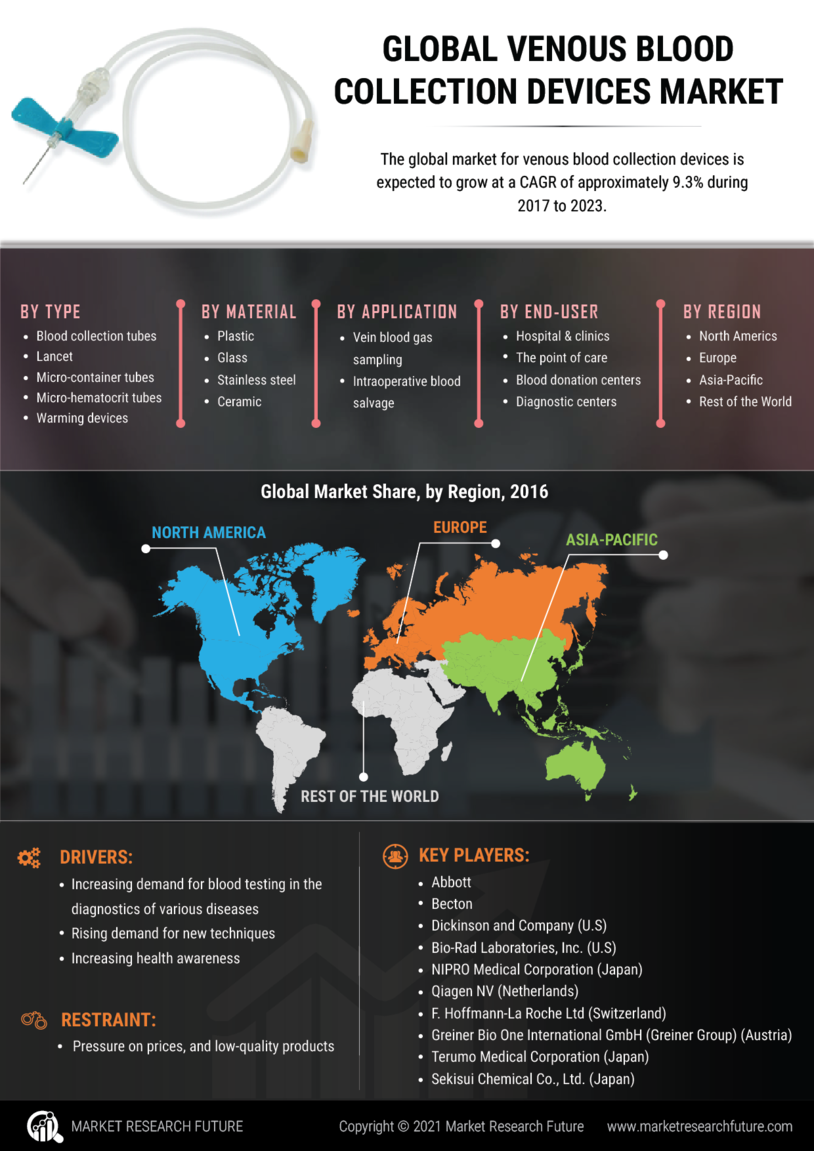
Venous Blood Collection Devices Market Segmentation
Venous Blood Collection Devices Market By Type (USD Billion, 2025-2035)
- blood collection tubes
- needles
- vacuum blood collection system
- microfluidic system
- micro-container tubes
- micro-hematocrit tubes
- warming devices
- others
Venous Blood Collection Devices Market By Material (USD Billion, 2025-2035)
- plastic
- glass
- stainless steel
- ceramic
- others
Venous Blood Collection Devices Market By Application (USD Billion, 2025-2035)
- vein blood gas sampling
- intraoperative blood salvage
Venous Blood Collection Devices Market By End-User (USD Billion, 2025-2035)
- hospitals and clinics
- point of care
- blood donation centers
- diagnostic centers
- others