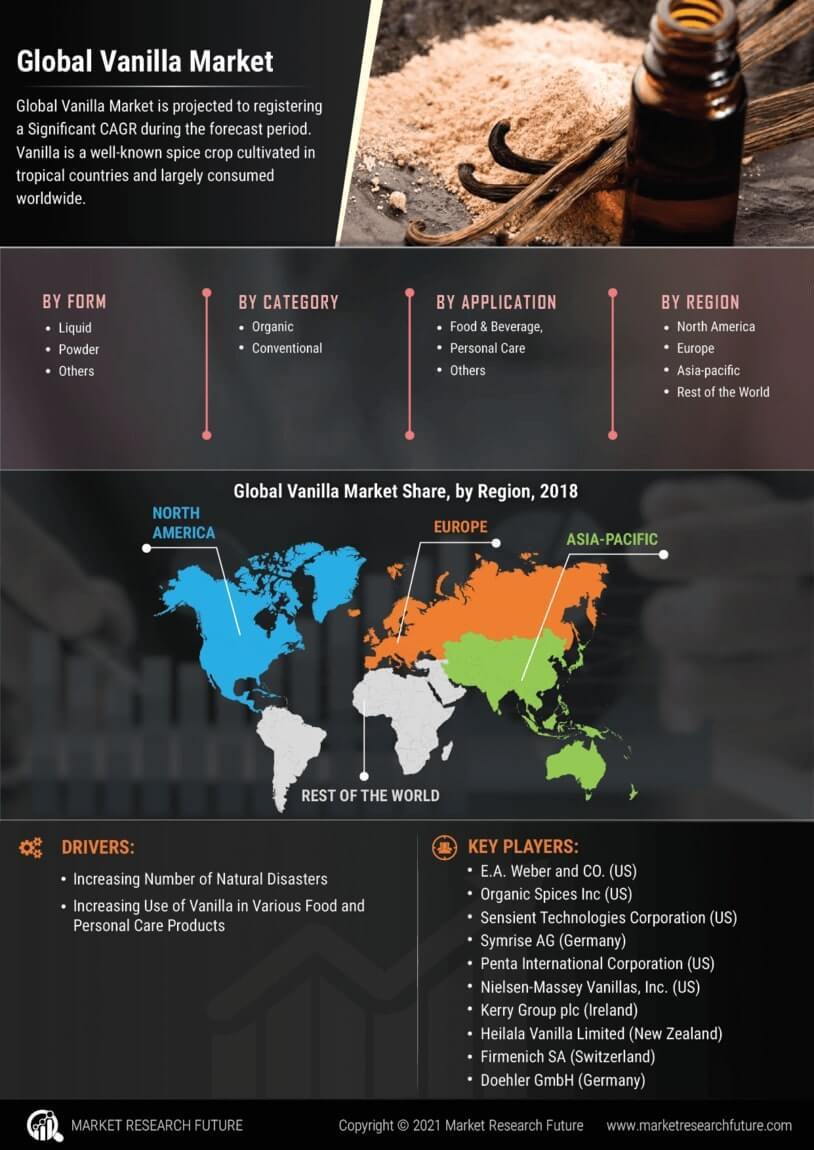
Vanilla Market Segmentation
Vanilla Market By Form (USD Billion, 2025-2035)
- Liquid
- Powder
- Others
Vanilla Market By Category (USD Billion, 2025-2035)
- Organic
- Conventional
Vanilla Market By Application (USD Billion, 2025-2035)
- Food & Beverage
- Personal Care
- Others