

US Semiconductor & Electronics Market Segmentation
Semiconductor & Electronics By Technology (USD Million, 2025-2035)
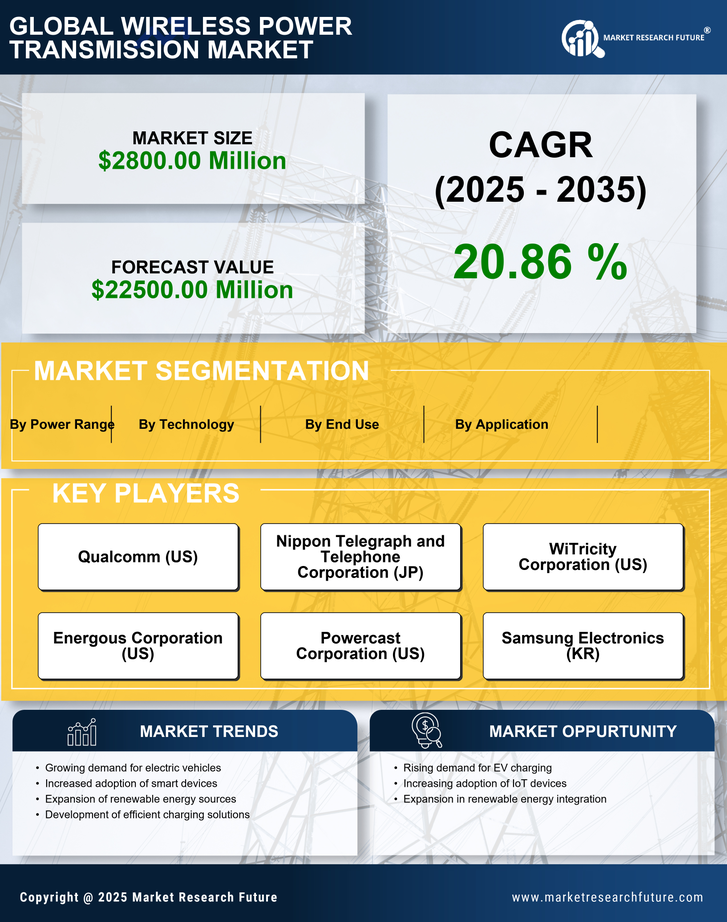
- Magnetic Resonant Coupling
- Inductive Coupling
- Capacitive Coupling
- Microwave Power Transmission
Semiconductor & Electronics By Application (USD Million, 2025-2035)
- Consumer Electronics
- Electric Vehicles
- Industrial Applications
- Medical Devices
Semiconductor & Electronics By End Use (USD Million, 2025-2035)
- Residential
- Commercial
- Transportation
- Healthcare
Semiconductor & Electronics By Power Range (USD Million, 2025-2035)
- Low Power
- Medium Power
- High Power


