Request Free Sample ×

Kindly complete the form below to receive a free sample of this Report

* Please use a valid business email

Leading companies partner with us for data-driven Insights

clients tt-cursor
Hero Background

US Vital Signs Monitoring Market

ID: MRFR/MED/13132-HCR
100 Pages
Rahul Gotadki
Last Updated: April 06, 2026

US Vital Signs Monitoring Market Research Report By Product Type (Blood Pressure Monitors, Thermometers, Pulse Oximeters, Heart Rate Monitors, Multi-parameter Monitors), By End User (hospitals, Home Care Settings, Ambulatory Surgical Centers, Emergency Medical Services, Clinics), By Application (Cardiac Monitoring, Respiratory Monitoring, Temperature Monitoring, Blood Pressure Monitoring, Oxygen Saturation Monitoring) and By Distribution Channel (Retail Pharmacy, Online Pharmacy, Hospital Pharmacies, Medical Supply Stores) - Growth & Industry Forecast 2025 To 2035

Share:
Download PDF ×

We do not share your information with anyone. However, we may send you emails based on your report interest from time to time. You may contact us at any time to opt-out.

US Vital Signs Monitoring Market Infographic
Purchase Options
  1. 1 SECTION I: EXECUTIVE SUMMARY AND KEY HIGHLIGHTS
  2.   1.1 EXECUTIVE SUMMARY
  3.     1.1.1 Market Overview
  4.     1.1.2 Key Findings
  5.     1.1.3 Market Segmentation
  6.     1.1.4 Competitive Landscape
  7.     1.1.5 Challenges and Opportunities
  8.     1.1.6 Future Outlook
  9. 2 SECTION II: SCOPING, METHODOLOGY AND MARKET STRUCTURE
  10.   2.1 MARKET INTRODUCTION
  11.     2.1.1 Definition
  12.     2.1.2 Scope of the study
  13.       2.1.2.1 Research Objective
  14.       2.1.2.2 Assumption
  15.       2.1.2.3 Limitations
  16.   2.2 RESEARCH METHODOLOGY
  17.     2.2.1 Overview
  18.     2.2.2 Data Mining
  19.     2.2.3 Secondary Research
  20.     2.2.4 Primary Research
  21.       2.2.4.1 Primary Interviews and Information Gathering Process
  22.       2.2.4.2 Breakdown of Primary Respondents
  23.     2.2.5 Forecasting Model
  24.     2.2.6 Market Size Estimation
  25.       2.2.6.1 Bottom-Up Approach
  26.       2.2.6.2 Top-Down Approach
  27.     2.2.7 Data Triangulation
  28.     2.2.8 Validation
  29. 3 SECTION III: QUALITATIVE ANALYSIS
  30.   3.1 MARKET DYNAMICS
  31.     3.1.1 Overview
  32.     3.1.2 Drivers
  33.     3.1.3 Restraints
  34.     3.1.4 Opportunities
  35.   3.2 MARKET FACTOR ANALYSIS
  36.     3.2.1 Value chain Analysis
  37.     3.2.2 Porter's Five Forces Analysis
  38.       3.2.2.1 Bargaining Power of Suppliers
  39.       3.2.2.2 Bargaining Power of Buyers
  40.       3.2.2.3 Threat of New Entrants
  41.       3.2.2.4 Threat of Substitutes
  42.       3.2.2.5 Intensity of Rivalry
  43.     3.2.3 COVID-19 Impact Analysis
  44.       3.2.3.1 Market Impact Analysis
  45.       3.2.3.2 Regional Impact
  46.       3.2.3.3 Opportunity and Threat Analysis
  47. 4 SECTION IV: QUANTITATIVE ANALYSIS
  48.   4.1 Life Sciences, BY Product Type (USD Million)
  49.     4.1.1 Pulse Oximeters
  50.     4.1.2 Blood Pressure Monitors
  51.     4.1.3 Temperature Monitors
  52.     4.1.4 Heart Rate Monitors
  53.   4.2 Life Sciences, BY End User (USD Million)
  54.     4.2.1 Hospitals
  55.     4.2.2 Homecare
  56.     4.2.3 Ambulatory Surgical Centers
  57.     4.2.4 Diagnostic Centers
  58.   4.3 Life Sciences, BY Technology (USD Million)
  59.     4.3.1 Telemetry
  60.     4.3.2 Wired Monitoring
  61.     4.3.3 Wireless Monitoring
  62.   4.4 Life Sciences, BY Application (USD Million)
  63.     4.4.1 Cardiology
  64.     4.4.2 Respiratory
  65.     4.4.3 Neurology
  66.     4.4.4 Pediatrics
  67. 5 SECTION V: COMPETITIVE ANALYSIS
  68.   5.1 Competitive Landscape
  69.     5.1.1 Overview
  70.     5.1.2 Competitive Analysis
  71.     5.1.3 Market share Analysis
  72.     5.1.4 Major Growth Strategy in the Life Sciences
  73.     5.1.5 Competitive Benchmarking
  74.     5.1.6 Leading Players in Terms of Number of Developments in the Life Sciences
  75.     5.1.7 Key developments and growth strategies
  76.       5.1.7.1 New Product Launch/Service Deployment
  77.       5.1.7.2 Merger & Acquisitions
  78.       5.1.7.3 Joint Ventures
  79.     5.1.8 Major Players Financial Matrix
  80.       5.1.8.1 Sales and Operating Income
  81.       5.1.8.2 Major Players R&D Expenditure. 2023
  82.   5.2 Company Profiles
  83.     5.2.1 Medtronic (US)
  84.       5.2.1.1 Financial Overview
  85.       5.2.1.2 Products Offered
  86.       5.2.1.3 Key Developments
  87.       5.2.1.4 SWOT Analysis
  88.       5.2.1.5 Key Strategies
  89.     5.2.2 Philips (NL)
  90.       5.2.2.1 Financial Overview
  91.       5.2.2.2 Products Offered
  92.       5.2.2.3 Key Developments
  93.       5.2.2.4 SWOT Analysis
  94.       5.2.2.5 Key Strategies
  95.     5.2.3 GE Healthcare (US)
  96.       5.2.3.1 Financial Overview
  97.       5.2.3.2 Products Offered
  98.       5.2.3.3 Key Developments
  99.       5.2.3.4 SWOT Analysis
  100.       5.2.3.5 Key Strategies
  101.     5.2.4 Siemens Healthineers (DE)
  102.       5.2.4.1 Financial Overview
  103.       5.2.4.2 Products Offered
  104.       5.2.4.3 Key Developments
  105.       5.2.4.4 SWOT Analysis
  106.       5.2.4.5 Key Strategies
  107.     5.2.5 Johnson & Johnson (US)
  108.       5.2.5.1 Financial Overview
  109.       5.2.5.2 Products Offered
  110.       5.2.5.3 Key Developments
  111.       5.2.5.4 SWOT Analysis
  112.       5.2.5.5 Key Strategies
  113.     5.2.6 Nihon Kohden (JP)
  114.       5.2.6.1 Financial Overview
  115.       5.2.6.2 Products Offered
  116.       5.2.6.3 Key Developments
  117.       5.2.6.4 SWOT Analysis
  118.       5.2.6.5 Key Strategies
  119.     5.2.7 Omron Healthcare (JP)
  120.       5.2.7.1 Financial Overview
  121.       5.2.7.2 Products Offered
  122.       5.2.7.3 Key Developments
  123.       5.2.7.4 SWOT Analysis
  124.       5.2.7.5 Key Strategies
  125.     5.2.8 Honeywell (US)
  126.       5.2.8.1 Financial Overview
  127.       5.2.8.2 Products Offered
  128.       5.2.8.3 Key Developments
  129.       5.2.8.4 SWOT Analysis
  130.       5.2.8.5 Key Strategies
  131.     5.2.9 Schiller AG (CH)
  132.       5.2.9.1 Financial Overview
  133.       5.2.9.2 Products Offered
  134.       5.2.9.3 Key Developments
  135.       5.2.9.4 SWOT Analysis
  136.       5.2.9.5 Key Strategies
  137.   5.3 Appendix
  138.     5.3.1 References
  139.     5.3.2 Related Reports
  140. 6 LIST OF FIGURES
  141.   6.1 MARKET SYNOPSIS
  142.   6.2 US MARKET ANALYSIS BY PRODUCT TYPE
  143.   6.3 US MARKET ANALYSIS BY END USER
  144.   6.4 US MARKET ANALYSIS BY TECHNOLOGY
  145.   6.5 US MARKET ANALYSIS BY APPLICATION
  146.   6.6 KEY BUYING CRITERIA OF LIFE SCIENCES
  147.   6.7 RESEARCH PROCESS OF MRFR
  148.   6.8 DRO ANALYSIS OF LIFE SCIENCES
  149.   6.9 DRIVERS IMPACT ANALYSIS: LIFE SCIENCES
  150.   6.10 RESTRAINTS IMPACT ANALYSIS: LIFE SCIENCES
  151.   6.11 SUPPLY / VALUE CHAIN: LIFE SCIENCES
  152.   6.12 LIFE SCIENCES, BY PRODUCT TYPE, 2024 (% SHARE)
  153.   6.13 LIFE SCIENCES, BY PRODUCT TYPE, 2024 TO 2035 (USD Million)
  154.   6.14 LIFE SCIENCES, BY END USER, 2024 (% SHARE)
  155.   6.15 LIFE SCIENCES, BY END USER, 2024 TO 2035 (USD Million)
  156.   6.16 LIFE SCIENCES, BY TECHNOLOGY, 2024 (% SHARE)
  157.   6.17 LIFE SCIENCES, BY TECHNOLOGY, 2024 TO 2035 (USD Million)
  158.   6.18 LIFE SCIENCES, BY APPLICATION, 2024 (% SHARE)
  159.   6.19 LIFE SCIENCES, BY APPLICATION, 2024 TO 2035 (USD Million)
  160.   6.20 BENCHMARKING OF MAJOR COMPETITORS
  161. 7 LIST OF TABLES
  162.   7.1 LIST OF ASSUMPTIONS
  163.     7.1.1
  164.   7.2 US MARKET SIZE ESTIMATES; FORECAST
  165.     7.2.1 BY PRODUCT TYPE, 2025-2035 (USD Million)
  166.     7.2.2 BY END USER, 2025-2035 (USD Million)
  167.     7.2.3 BY TECHNOLOGY, 2025-2035 (USD Million)
  168.     7.2.4 BY APPLICATION, 2025-2035 (USD Million)
  169.   7.3 PRODUCT LAUNCH/PRODUCT DEVELOPMENT/APPROVAL
  170.     7.3.1
  171.   7.4 ACQUISITION/PARTNERSHIP
  172.     7.4.1

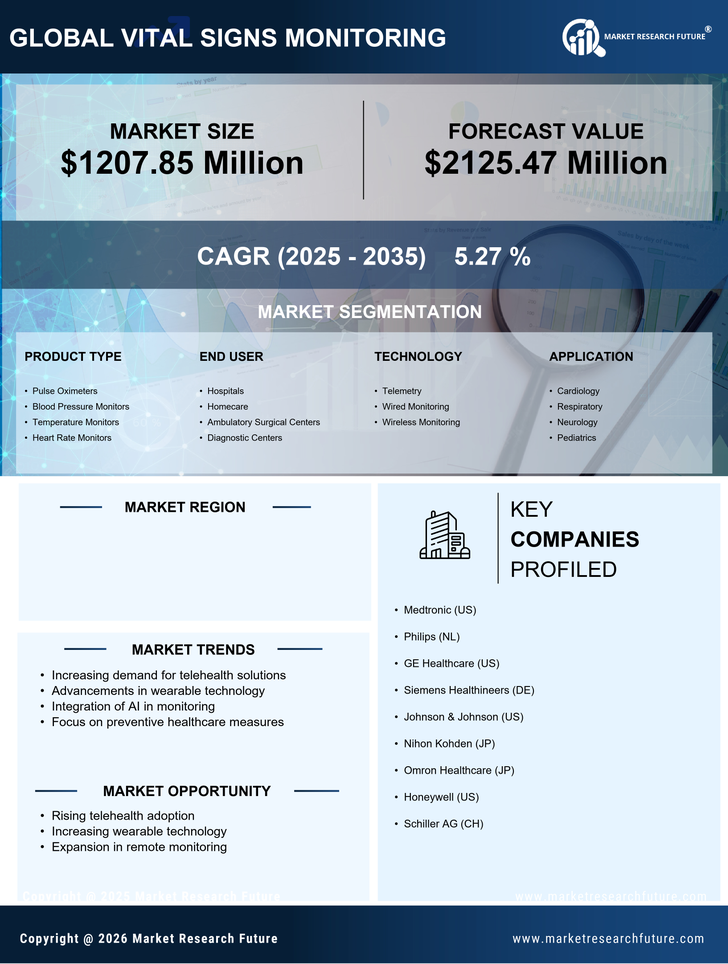
US Life Sciences Market Segmentation

Life Sciences By Product Type (USD Million, 2025-2035)

  • Pulse Oximeters
  • Blood Pressure Monitors
  • Temperature Monitors
  • Heart Rate Monitors

Life Sciences By End User (USD Million, 2025-2035)

  • Hospitals
  • Homecare
  • Ambulatory Surgical Centers
  • Diagnostic Centers

Life Sciences By Technology (USD Million, 2025-2035)

  • Telemetry
  • Wired Monitoring
  • Wireless Monitoring

Life Sciences By Application (USD Million, 2025-2035)

  • Cardiology
  • Respiratory
  • Neurology
  • Pediatrics

Compare Licence

×
Features License Type
Single User Multiuser License Enterprise User
Price $4,950 $5,950 $7,250
Maximum User Access Limit 1 User Upto 10 Users Unrestricted Access Throughout the Organization
Free Customization
Direct Access to Analyst
Deliverable Format
Platform Access
Discount on Next Purchase 10% 15% 15%
Printable Versions