US US Thin Wall Packaging Market Segmentation
US Thin Wall Packaging Market By Type (USD Billion, 2025-2035)
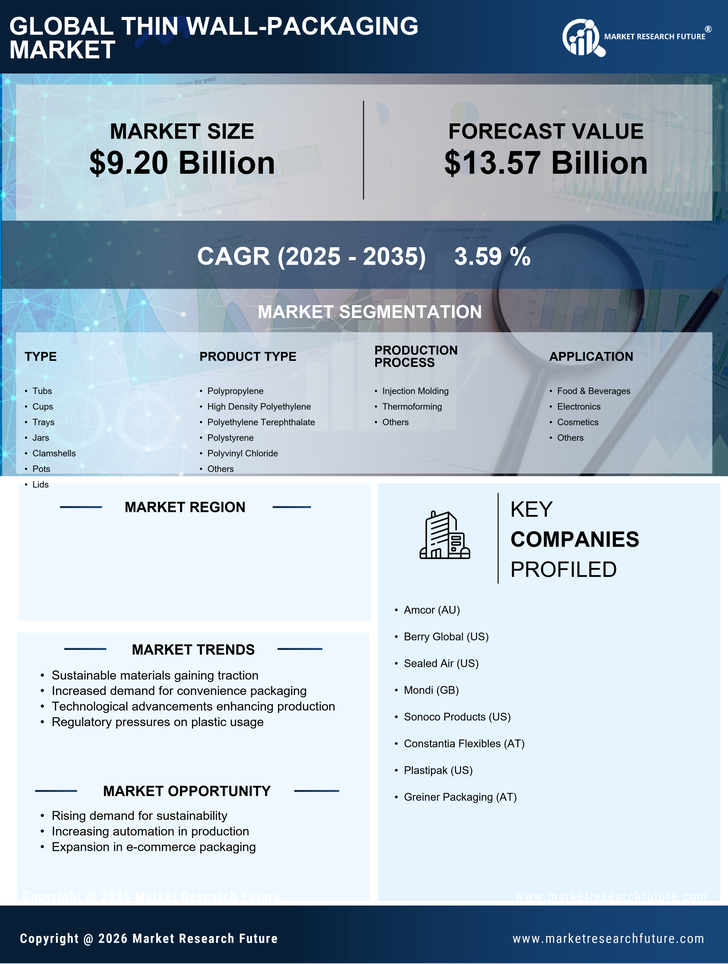
- Tubs
- Cups
- Trays
- Jars
- Clamshells
- Pots
- Lids
US Thin Wall Packaging Market By Product Type (USD Billion, 2025-2035)
- Polypropylene
- High Density Polyethylene
- Polyethylene Terephthalate
- Polystyrene
- Polyvinyl Chloride
- Others
US Thin Wall Packaging Market By Production Process (USD Billion, 2025-2035)
- Injection Molding
- Thermoforming
- Others
US Thin Wall Packaging Market By Application (USD Billion, 2025-2035)
- Food & Beverages
- Electronics
- Cosmetics
- Others