Request Free Sample ×

Kindly complete the form below to receive a free sample of this Report

* Please use a valid business email

Leading companies partner with us for data-driven Insights

clients tt-cursor
Hero Background

US Spout Packaging Market

ID: MRFR/PCM/18992-HCR
111 Pages
Snehal Singh
Last Updated: April 06, 2026

US Spout Packaging Market Research Report: By Component (Caps, Film), By Material (Plastic, Aluminum, Paper, Others), By Pouch Size (Less than 200 ML, 200 to 500 ML, 500 to 1,000 ML, More than 1,000 ML), By CLOSURE TYPE (Screw Cap, Flip Top Cap) and By End User (Food and Beverages, Cosmetics and Personal Care, Automotive, Pharmaceutical, Paints, Soaps and Detergents, Others) - Forecast to 2035

Share:
Download PDF ×

We do not share your information with anyone. However, we may send you emails based on your report interest from time to time. You may contact us at any time to opt-out.

US Spout Packaging Market Infographic
Purchase Options
  1. 1 SECTION I: EXECUTIVE SUMMARY AND KEY HIGHLIGHTS
  2.   1.1 EXECUTIVE SUMMARY
  3.     1.1.1 Market Overview
  4.     1.1.2 Key Findings
  5.     1.1.3 Market Segmentation
  6.     1.1.4 Competitive Landscape
  7.     1.1.5 Challenges and Opportunities
  8.     1.1.6 Future Outlook
  9. 2 SECTION II: SCOPING, METHODOLOGY AND MARKET STRUCTURE
  10.   2.1 MARKET INTRODUCTION
  11.     2.1.1 Definition
  12.     2.1.2 Scope of the study
  13.       2.1.2.1 Research Objective
  14.       2.1.2.2 Assumption
  15.       2.1.2.3 Limitations
  16.   2.2 RESEARCH METHODOLOGY
  17.     2.2.1 Overview
  18.     2.2.2 Data Mining
  19.     2.2.3 Secondary Research
  20.     2.2.4 Primary Research
  21.       2.2.4.1 Primary Interviews and Information Gathering Process
  22.       2.2.4.2 Breakdown of Primary Respondents
  23.     2.2.5 Forecasting Model
  24.     2.2.6 Market Size Estimation
  25.       2.2.6.1 Bottom-Up Approach
  26.       2.2.6.2 Top-Down Approach
  27.     2.2.7 Data Triangulation
  28.     2.2.8 Validation
  29. 3 SECTION III: QUALITATIVE ANALYSIS
  30.   3.1 MARKET DYNAMICS
  31.     3.1.1 Overview
  32.     3.1.2 Drivers
  33.     3.1.3 Restraints
  34.     3.1.4 Opportunities
  35.   3.2 MARKET FACTOR ANALYSIS
  36.     3.2.1 Value chain Analysis
  37.     3.2.2 Porter's Five Forces Analysis
  38.       3.2.2.1 Bargaining Power of Suppliers
  39.       3.2.2.2 Bargaining Power of Buyers
  40.       3.2.2.3 Threat of New Entrants
  41.       3.2.2.4 Threat of Substitutes
  42.       3.2.2.5 Intensity of Rivalry
  43.     3.2.3 COVID-19 Impact Analysis
  44.       3.2.3.1 Market Impact Analysis
  45.       3.2.3.2 Regional Impact
  46.       3.2.3.3 Opportunity and Threat Analysis
  47. 4 SECTION IV: QUANTITATIVE ANALYSIS
  48.   4.1 Packaging & Transport, BY Components (USD Billion)
  49.     4.1.1 Caps
  50.     4.1.2 Film
  51.   4.2 Packaging & Transport, BY Material (USD Billion)
  52.     4.2.1 Plastic
  53.     4.2.2 Aluminum
  54.     4.2.3 Paper
  55.     4.2.4 Others
  56.   4.3 Packaging & Transport, BY Pouch Size (USD Billion)
  57.     4.3.1 Less than 200 ML
  58.     4.3.2 200 to 500 ML
  59.     4.3.3 500 to 1,000 ML
  60.     4.3.4 More than 1,000 ML
  61.   4.4 Packaging & Transport, BY Closure Type (USD Billion)
  62.     4.4.1 Screw Cap
  63.     4.4.2 Flip Top Cap
  64.   4.5 Packaging & Transport, BY End User (USD Billion)
  65.     4.5.1 Food and Beverages
  66.     4.5.2 Cosmetics and Personal Care
  67.     4.5.3 Automotive
  68.     4.5.4 Pharmaceutical
  69.     4.5.5 Paints
  70.     4.5.6 Soaps and Detergents
  71.     4.5.7 Others
  72. 5 SECTION V: COMPETITIVE ANALYSIS
  73.   5.1 Competitive Landscape
  74.     5.1.1 Overview
  75.     5.1.2 Competitive Analysis
  76.     5.1.3 Market share Analysis
  77.     5.1.4 Major Growth Strategy in the Packaging & Transport
  78.     5.1.5 Competitive Benchmarking
  79.     5.1.6 Leading Players in Terms of Number of Developments in the Packaging & Transport
  80.     5.1.7 Key developments and growth strategies
  81.       5.1.7.1 New Product Launch/Service Deployment
  82.       5.1.7.2 Merger & Acquisitions
  83.       5.1.7.3 Joint Ventures
  84.     5.1.8 Major Players Financial Matrix
  85.       5.1.8.1 Sales and Operating Income
  86.       5.1.8.2 Major Players R&D Expenditure. 2023
  87.   5.2 Company Profiles
  88.     5.2.1 Amcor (AU)
  89.       5.2.1.1 Financial Overview
  90.       5.2.1.2 Products Offered
  91.       5.2.1.3 Key Developments
  92.       5.2.1.4 SWOT Analysis
  93.       5.2.1.5 Key Strategies
  94.     5.2.2 Mondi (GB)
  95.       5.2.2.1 Financial Overview
  96.       5.2.2.2 Products Offered
  97.       5.2.2.3 Key Developments
  98.       5.2.2.4 SWOT Analysis
  99.       5.2.2.5 Key Strategies
  100.     5.2.3 Berry Global (US)
  101.       5.2.3.1 Financial Overview
  102.       5.2.3.2 Products Offered
  103.       5.2.3.3 Key Developments
  104.       5.2.3.4 SWOT Analysis
  105.       5.2.3.5 Key Strategies
  106.     5.2.4 Sealed Air (US)
  107.       5.2.4.1 Financial Overview
  108.       5.2.4.2 Products Offered
  109.       5.2.4.3 Key Developments
  110.       5.2.4.4 SWOT Analysis
  111.       5.2.4.5 Key Strategies
  112.     5.2.5 Smurfit Kappa (IE)
  113.       5.2.5.1 Financial Overview
  114.       5.2.5.2 Products Offered
  115.       5.2.5.3 Key Developments
  116.       5.2.5.4 SWOT Analysis
  117.       5.2.5.5 Key Strategies
  118.     5.2.6 Sonoco Products (US)
  119.       5.2.6.1 Financial Overview
  120.       5.2.6.2 Products Offered
  121.       5.2.6.3 Key Developments
  122.       5.2.6.4 SWOT Analysis
  123.       5.2.6.5 Key Strategies
  124.     5.2.7 ProAmpac (US)
  125.       5.2.7.1 Financial Overview
  126.       5.2.7.2 Products Offered
  127.       5.2.7.3 Key Developments
  128.       5.2.7.4 SWOT Analysis
  129.       5.2.7.5 Key Strategies
  130.     5.2.8 Graham Packaging (US)
  131.       5.2.8.1 Financial Overview
  132.       5.2.8.2 Products Offered
  133.       5.2.8.3 Key Developments
  134.       5.2.8.4 SWOT Analysis
  135.       5.2.8.5 Key Strategies
  136.   5.3 Appendix
  137.     5.3.1 References
  138.     5.3.2 Related Reports
  139. 6 LIST OF FIGURES
  140.   6.1 MARKET SYNOPSIS
  141.   6.2 US MARKET ANALYSIS BY COMPONENTS
  142.   6.3 US MARKET ANALYSIS BY MATERIAL
  143.   6.4 US MARKET ANALYSIS BY POUCH SIZE
  144.   6.5 US MARKET ANALYSIS BY CLOSURE TYPE
  145.   6.6 US MARKET ANALYSIS BY END USER
  146.   6.7 KEY BUYING CRITERIA OF PACKAGING & TRANSPORT
  147.   6.8 RESEARCH PROCESS OF MRFR
  148.   6.9 DRO ANALYSIS OF PACKAGING & TRANSPORT
  149.   6.10 DRIVERS IMPACT ANALYSIS: PACKAGING & TRANSPORT
  150.   6.11 RESTRAINTS IMPACT ANALYSIS: PACKAGING & TRANSPORT
  151.   6.12 SUPPLY / VALUE CHAIN: PACKAGING & TRANSPORT
  152.   6.13 PACKAGING & TRANSPORT, BY COMPONENTS, 2024 (% SHARE)
  153.   6.14 PACKAGING & TRANSPORT, BY COMPONENTS, 2024 TO 2035 (USD Billion)
  154.   6.15 PACKAGING & TRANSPORT, BY MATERIAL, 2024 (% SHARE)
  155.   6.16 PACKAGING & TRANSPORT, BY MATERIAL, 2024 TO 2035 (USD Billion)
  156.   6.17 PACKAGING & TRANSPORT, BY POUCH SIZE, 2024 (% SHARE)
  157.   6.18 PACKAGING & TRANSPORT, BY POUCH SIZE, 2024 TO 2035 (USD Billion)
  158.   6.19 PACKAGING & TRANSPORT, BY CLOSURE TYPE, 2024 (% SHARE)
  159.   6.20 PACKAGING & TRANSPORT, BY CLOSURE TYPE, 2024 TO 2035 (USD Billion)
  160.   6.21 PACKAGING & TRANSPORT, BY END USER, 2024 (% SHARE)
  161.   6.22 PACKAGING & TRANSPORT, BY END USER, 2024 TO 2035 (USD Billion)
  162.   6.23 BENCHMARKING OF MAJOR COMPETITORS
  163. 7 LIST OF TABLES
  164.   7.1 LIST OF ASSUMPTIONS
  165.     7.1.1
  166.   7.2 US MARKET SIZE ESTIMATES; FORECAST
  167.     7.2.1 BY COMPONENTS, 2025-2035 (USD Billion)
  168.     7.2.2 BY MATERIAL, 2025-2035 (USD Billion)
  169.     7.2.3 BY POUCH SIZE, 2025-2035 (USD Billion)
  170.     7.2.4 BY CLOSURE TYPE, 2025-2035 (USD Billion)
  171.     7.2.5 BY END USER, 2025-2035 (USD Billion)
  172.   7.3 PRODUCT LAUNCH/PRODUCT DEVELOPMENT/APPROVAL
  173.     7.3.1
  174.   7.4 ACQUISITION/PARTNERSHIP
  175.     7.4.1

US Packaging & Transport Market Segmentation

Packaging & Transport By Components (USD Billion, 2025-2035)
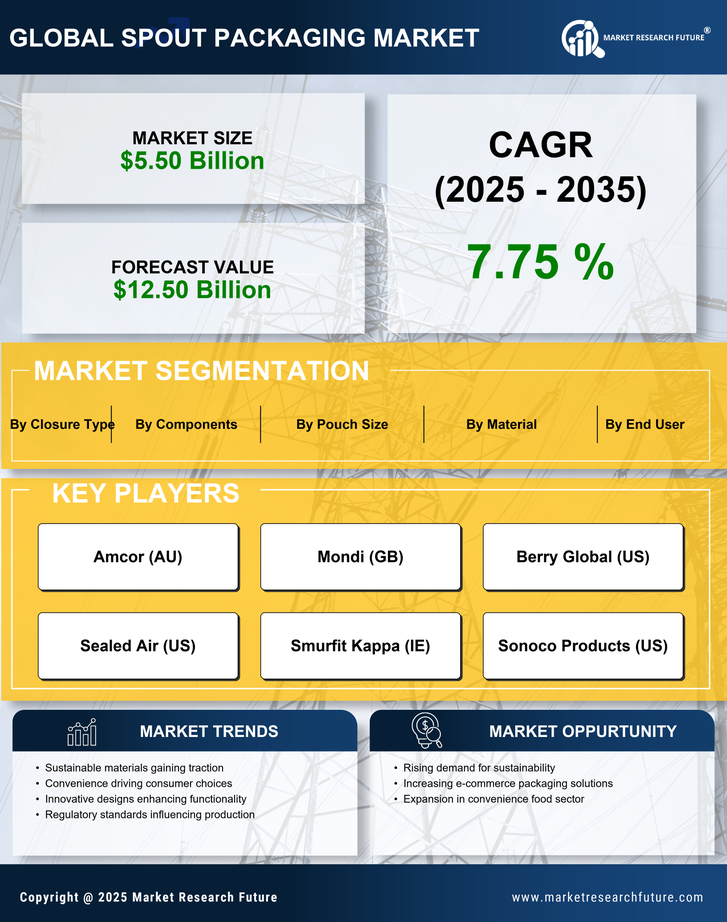
  • Caps
  • Film

Packaging & Transport By Material (USD Billion, 2025-2035)

  • Plastic
  • Aluminum
  • Paper
  • Others

Packaging & Transport By Pouch Size (USD Billion, 2025-2035)

  • Less than 200 ML
  • 200 to 500 ML
  • 500 to 1,000 ML
  • More than 1,000 ML

Packaging & Transport By Closure Type (USD Billion, 2025-2035)

  • Screw Cap
  • Flip Top Cap

Packaging & Transport By End User (USD Billion, 2025-2035)

  • Food and Beverages
  • Cosmetics and Personal Care
  • Automotive
  • Pharmaceutical
  • Paints
  • Soaps and Detergents
  • Others

Compare Licence

×
Features License Type
Single User Multiuser License Enterprise User
Price $4,950 $5,950 $7,250
Maximum User Access Limit 1 User Upto 10 Users Unrestricted Access Throughout the Organization
Free Customization
Direct Access to Analyst
Deliverable Format
Platform Access
Discount on Next Purchase 10% 15% 15%
Printable Versions