US Semiconductor Memory IP Market

ID: MRFR/SEM/12004-HCR
200 Pages
Ankit Gupta
Last Updated: April 06, 2026
US Semiconductor IP Market Size, Share and Research Report: By Application (Automotive, Consumer Electronics, Networking, Industrial Automation) and By Type (Microprocessor, Digital Signal Processors) - Industry Forecast Till 2035
Download PDF ×

We do not share your information with anyone. However, we may send you emails based on your report interest from time to time. You may contact us at any time to opt-out.

US Semiconductor Memory IP Market

Market Size

Forecast Period2025 - 2035
CAGR (2025 - 2035)5.49%
2024 Market Size$ 2,500 Million
2025 Market Size$ 2,637.25 Million
2035 Market Size$ 4,500 Million

Key Players

Samsung Electronics
SK Hynix
Micron Technology
Western Digital
Kioxia Holdings
Nanya Technology
Opportunities
  • Rising Adoption of IoT Devices
  • Increased Focus on Data Centers
  • Government Initiatives and Funding
  1. 1 SECTION I: EXECUTIVE SUMMARY AND KEY HIGHLIGHTS
    1. 1.1 EXECUTIVE SUMMARY
      1. 1.1.1 Market Overview
      2. 1.1.2 Key Findings
      3. 1.1.3 Market Segmentation
      4. 1.1.4 Competitive Landscape
      5. 1.1.5 Challenges and Opportunities
      6. 1.1.6 Future Outlook
  2. 2 SECTION II: SCOPING, METHODOLOGY AND MARKET STRUCTURE
    1. 2.1 MARKET INTRODUCTION
      1. 2.1.1 Definition
      2. 2.1.2 Scope of the study
        1. 2.1.2.1 Research Objective
        2. 2.1.2.2 Assumption
        3. 2.1.2.3 Limitations
    2. 2.2 RESEARCH METHODOLOGY
      1. 2.2.1 Overview
      2. 2.2.2 Data Mining
      3. 2.2.3 Secondary Research
      4. 2.2.4 Primary Research
        1. 2.2.4.1 Primary Interviews and Information Gathering Process
        2. 2.2.4.2 Breakdown of Primary Respondents
      5. 2.2.5 Forecasting Model
      6. 2.2.6 Market Size Estimation
        1. 2.2.6.1 Bottom-Up Approach
        2. 2.2.6.2 Top-Down Approach
      7. 2.2.7 Data Triangulation
      8. 2.2.8 Validation
  3. 3 SECTION III: QUALITATIVE ANALYSIS
    1. 3.1 MARKET DYNAMICS
      1. 3.1.1 Overview
      2. 3.1.2 Drivers
      3. 3.1.3 Restraints
      4. 3.1.4 Opportunities
    2. 3.2 MARKET FACTOR ANALYSIS
      1. 3.2.1 Value chain Analysis
      2. 3.2.2 Porter's Five Forces Analysis
        1. 3.2.2.1 Bargaining Power of Suppliers
        2. 3.2.2.2 Bargaining Power of Buyers
        3. 3.2.2.3 Threat of New Entrants
        4. 3.2.2.4 Threat of Substitutes
        5. 3.2.2.5 Intensity of Rivalry
      3. 3.2.3 COVID-19 Impact Analysis
        1. 3.2.3.1 Market Impact Analysis
        2. 3.2.3.2 Regional Impact
        3. 3.2.3.3 Opportunity and Threat Analysis
  4. 4 SECTION IV: QUANTITATIVE ANALYSIS
    1. 4.1 Semiconductor & Electronics, BY Type (USD Million)
      1. 4.1.1 Dynamic Random Access Memory
      2. 4.1.2 Static Random Access Memory
      3. 4.1.3 Read-Only Memory
      4. 4.1.4 Flash Memory
    2. 4.2 Semiconductor & Electronics, BY Technology (USD Million)
      1. 4.2.1 DRAM
      2. 4.2.2 SRAM
      3. 4.2.3 NAND
      4. 4.2.4 NOR
    3. 4.3 Semiconductor & Electronics, BY Application (USD Million)
      1. 4.3.1 Consumer Electronics
      2. 4.3.2 Automotive
      3. 4.3.3 Telecommunications
      4. 4.3.4 Industrial
    4. 4.4 Semiconductor & Electronics, BY End Use (USD Million)
      1. 4.4.1 Personal Use
      2. 4.4.2 Commercial Use
      3. 4.4.3 Military Use
  5. 5 SECTION V: COMPETITIVE ANALYSIS
    1. 5.1 Competitive Landscape
      1. 5.1.1 Overview
      2. 5.1.2 Competitive Analysis
      3. 5.1.3 Market share Analysis
      4. 5.1.4 Major Growth Strategy in the Semiconductor & Electronics
      5. 5.1.5 Competitive Benchmarking
      6. 5.1.6 Leading Players in Terms of Number of Developments in the Semiconductor & Electronics
      7. 5.1.7 Key developments and growth strategies
        1. 5.1.7.1 New Product Launch/Service Deployment
        2. 5.1.7.2 Merger & Acquisitions
        3. 5.1.7.3 Joint Ventures
      8. 5.1.8 Major Players Financial Matrix
        1. 5.1.8.1 Sales and Operating Income
        2. 5.1.8.2 Major Players R&D Expenditure. 2023
    2. 5.2 Company Profiles
      1. 5.2.1 Samsung Electronics (KR)
        1. 5.2.1.1 Financial Overview
        2. 5.2.1.2 Products Offered
        3. 5.2.1.3 Key Developments
        4. 5.2.1.4 SWOT Analysis
        5. 5.2.1.5 Key Strategies
      2. 5.2.2 SK Hynix (KR)
        1. 5.2.2.1 Financial Overview
        2. 5.2.2.2 Products Offered
        3. 5.2.2.3 Key Developments
        4. 5.2.2.4 SWOT Analysis
        5. 5.2.2.5 Key Strategies
      3. 5.2.3 Micron Technology (US)
        1. 5.2.3.1 Financial Overview
        2. 5.2.3.2 Products Offered
        3. 5.2.3.3 Key Developments
        4. 5.2.3.4 SWOT Analysis
        5. 5.2.3.5 Key Strategies
      4. 5.2.4 Western Digital (US)
        1. 5.2.4.1 Financial Overview
        2. 5.2.4.2 Products Offered
        3. 5.2.4.3 Key Developments
        4. 5.2.4.4 SWOT Analysis
        5. 5.2.4.5 Key Strategies
      5. 5.2.5 Kioxia Holdings (JP)
        1. 5.2.5.1 Financial Overview
        2. 5.2.5.2 Products Offered
        3. 5.2.5.3 Key Developments
        4. 5.2.5.4 SWOT Analysis
        5. 5.2.5.5 Key Strategies
      6. 5.2.6 Nanya Technology (TW)
        1. 5.2.6.1 Financial Overview
        2. 5.2.6.2 Products Offered
        3. 5.2.6.3 Key Developments
        4. 5.2.6.4 SWOT Analysis
        5. 5.2.6.5 Key Strategies
      7. 5.2.7 Infineon Technologies (DE)
        1. 5.2.7.1 Financial Overview
        2. 5.2.7.2 Products Offered
        3. 5.2.7.3 Key Developments
        4. 5.2.7.4 SWOT Analysis
        5. 5.2.7.5 Key Strategies
      8. 5.2.8 STMicroelectronics (FR)
        1. 5.2.8.1 Financial Overview
        2. 5.2.8.2 Products Offered
        3. 5.2.8.3 Key Developments
        4. 5.2.8.4 SWOT Analysis
        5. 5.2.8.5 Key Strategies
    3. 5.3 Appendix
      1. 5.3.1 References
      2. 5.3.2 Related Reports
  6. 6 LIST OF FIGURES
    1. 6.1 MARKET SYNOPSIS
    2. 6.2 US MARKET ANALYSIS BY TYPE
    3. 6.3 US MARKET ANALYSIS BY TECHNOLOGY
    4. 6.4 US MARKET ANALYSIS BY APPLICATION
    5. 6.5 US MARKET ANALYSIS BY END USE
    6. 6.6 KEY BUYING CRITERIA OF SEMICONDUCTOR & ELECTRONICS
    7. 6.7 RESEARCH PROCESS OF MRFR
    8. 6.8 DRO ANALYSIS OF SEMICONDUCTOR & ELECTRONICS
    9. 6.9 DRIVERS IMPACT ANALYSIS: SEMICONDUCTOR & ELECTRONICS
    10. 6.10 RESTRAINTS IMPACT ANALYSIS: SEMICONDUCTOR & ELECTRONICS
    11. 6.11 SUPPLY / VALUE CHAIN: SEMICONDUCTOR & ELECTRONICS
    12. 6.12 SEMICONDUCTOR & ELECTRONICS, BY TYPE, 2024 (% SHARE)
    13. 6.13 SEMICONDUCTOR & ELECTRONICS, BY TYPE, 2024 TO 2035 (USD Million)
    14. 6.14 SEMICONDUCTOR & ELECTRONICS, BY TECHNOLOGY, 2024 (% SHARE)
    15. 6.15 SEMICONDUCTOR & ELECTRONICS, BY TECHNOLOGY, 2024 TO 2035 (USD Million)
    16. 6.16 SEMICONDUCTOR & ELECTRONICS, BY APPLICATION, 2024 (% SHARE)
    17. 6.17 SEMICONDUCTOR & ELECTRONICS, BY APPLICATION, 2024 TO 2035 (USD Million)
    18. 6.18 SEMICONDUCTOR & ELECTRONICS, BY END USE, 2024 (% SHARE)
    19. 6.19 SEMICONDUCTOR & ELECTRONICS, BY END USE, 2024 TO 2035 (USD Million)
    20. 6.20 BENCHMARKING OF MAJOR COMPETITORS
  7. 7 LIST OF TABLES
    1. 7.1 LIST OF ASSUMPTIONS
  8. 7.1.1
    1. 7.2 US MARKET SIZE ESTIMATES; FORECAST
      1. 7.2.1 BY TYPE, 2025-2035 (USD Million)
      2. 7.2.2 BY TECHNOLOGY, 2025-2035 (USD Million)
      3. 7.2.3 BY APPLICATION, 2025-2035 (USD Million)
      4. 7.2.4 BY END USE, 2025-2035 (USD Million)
    2. 7.3 PRODUCT LAUNCH/PRODUCT DEVELOPMENT/APPROVAL
  9. 7.3.1
    1. 7.4 ACQUISITION/PARTNERSHIP
  10. 7.4.1

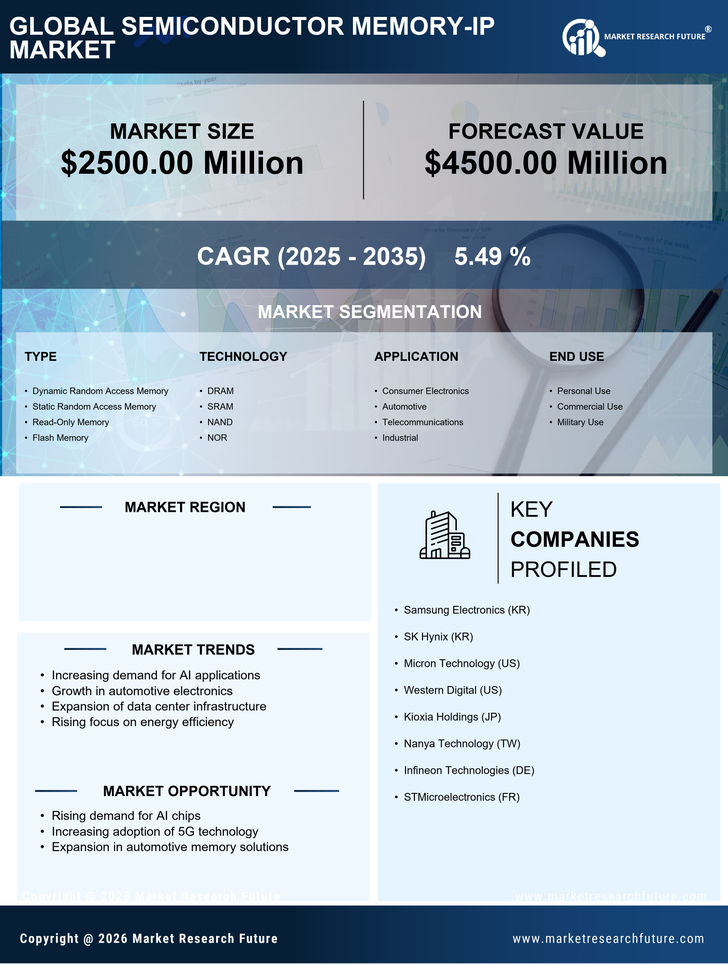
US Semiconductor Memory IP Market Segmentation

US Semiconductor Memory IP Market By Type (USD Million, 2025-2035)

  • Dynamic Random Access Memory
  • Static Random Access Memory
  • Read-Only Memory
  • Flash Memory

US Semiconductor Memory IP Market By Technology (USD Million, 2025-2035)

  • DRAM
  • SRAM
  • NAND
  • NOR

US Semiconductor Memory IP Market By Application (USD Million, 2025-2035)

  • Consumer Electronics
  • Automotive
  • Telecommunications
  • Industrial

US Semiconductor Memory IP Market By End Use (USD Million, 2025-2035)

  • Personal Use
  • Commercial Use
  • Military Use