US Rowing Machines Market

ID: MRFR/Equip/14377-HCR
100 Pages
Garvit Vyas
Last Updated: April 06, 2026
US Rowing Machines Market Research Report By Type Outlook ( Air, Water, Magnetic, Hydraulic ), Color Outlook ( Black, Light Grey, Others ), End-User Outlook ( Commercial, Residential ), Body Type Outlook ( Metal, Solid Wood ), Resistance Level Outlook ( Less Than 24, More Than 24 ), Weight Capacity Outlook ( 300 to 499 Pounds, 200 to 249 Pounds, 100 to 199 Pounds, Under 100 Pounds ), and Distribution Channel Outlook (Online, Offline) – United States Market Forecast Till 2035
Download PDF ×

We do not share your information with anyone. However, we may send you emails based on your report interest from time to time. You may contact us at any time to opt-out.

  1. 1 SECTION I: EXECUTIVE SUMMARY AND KEY HIGHLIGHTS
    1. 1.1 EXECUTIVE SUMMARY
      1. 1.1.1 Market Overview
      2. 1.1.2 Key Findings
      3. 1.1.3 Market Segmentation
      4. 1.1.4 Competitive Landscape
      5. 1.1.5 Challenges and Opportunities
      6. 1.1.6 Future Outlook
  2. 2 SECTION II: SCOPING, METHODOLOGY AND MARKET STRUCTURE
    1. 2.1 MARKET INTRODUCTION
      1. 2.1.1 Definition
      2. 2.1.2 Scope of the study
        1. 2.1.2.1 Research Objective
        2. 2.1.2.2 Assumption
        3. 2.1.2.3 Limitations
    2. 2.2 RESEARCH METHODOLOGY
      1. 2.2.1 Overview
      2. 2.2.2 Data Mining
      3. 2.2.3 Secondary Research
      4. 2.2.4 Primary Research
        1. 2.2.4.1 Primary Interviews and Information Gathering Process
        2. 2.2.4.2 Breakdown of Primary Respondents
      5. 2.2.5 Forecasting Model
      6. 2.2.6 Market Size Estimation
        1. 2.2.6.1 Bottom-Up Approach
        2. 2.2.6.2 Top-Down Approach
      7. 2.2.7 Data Triangulation
      8. 2.2.8 Validation
  3. 3 SECTION III: QUALITATIVE ANALYSIS
    1. 3.1 MARKET DYNAMICS
      1. 3.1.1 Overview
      2. 3.1.2 Drivers
      3. 3.1.3 Restraints
      4. 3.1.4 Opportunities
    2. 3.2 MARKET FACTOR ANALYSIS
      1. 3.2.1 Value chain Analysis
      2. 3.2.2 Porter's Five Forces Analysis
        1. 3.2.2.1 Bargaining Power of Suppliers
        2. 3.2.2.2 Bargaining Power of Buyers
        3. 3.2.2.3 Threat of New Entrants
        4. 3.2.2.4 Threat of Substitutes
        5. 3.2.2.5 Intensity of Rivalry
      3. 3.2.3 COVID-19 Impact Analysis
        1. 3.2.3.1 Market Impact Analysis
        2. 3.2.3.2 Regional Impact
        3. 3.2.3.3 Opportunity and Threat Analysis
  4. 4 SECTION IV: QUANTITATIVE ANALYSIS
    1. 4.1 Food, Beverages & Nutrition, BY Type (USD Million)
      1. 4.1.1 Air
      2. 4.1.2 Water
      3. 4.1.3 Magnetic
      4. 4.1.4 Hydraulic
    2. 4.2 Food, Beverages & Nutrition, BY Body Type (USD Million)
      1. 4.2.1 Metal
      2. 4.2.2 Solid Wood
    3. 4.3 Food, Beverages & Nutrition, BY Weight Capacity (USD Million)
      1. 4.3.1 300 to 499 Pounds
      2. 4.3.2 200 to 249 Pounds
      3. 4.3.3 100 to 199 Pounds
      4. 4.3.4 Under 100 Pounds
    4. 4.4 Food, Beverages & Nutrition, BY Distribution Channel (USD Million)
      1. 4.4.1 Online
      2. 4.4.2 Offline
    5. 4.5 Food, Beverages & Nutrition, BY Resistant Level (USD Million)
      1. 4.5.1 Less Than 24
      2. 4.5.2 More Than 24
    6. 4.6 Food, Beverages & Nutrition, BY Color (USD Million)
      1. 4.6.1 Black
      2. 4.6.2 Light Grey
      3. 4.6.3 Others
    7. 4.7 Food, Beverages & Nutrition, BY End-User (USD Million)
      1. 4.7.1 Commercial
      2. 4.7.2 Residential
  5. 5 SECTION V: COMPETITIVE ANALYSIS
    1. 5.1 Competitive Landscape
      1. 5.1.1 Overview
      2. 5.1.2 Competitive Analysis
      3. 5.1.3 Market share Analysis
      4. 5.1.4 Major Growth Strategy in the Food, Beverages & Nutrition
      5. 5.1.5 Competitive Benchmarking
      6. 5.1.6 Leading Players in Terms of Number of Developments in the Food, Beverages & Nutrition
      7. 5.1.7 Key developments and growth strategies
        1. 5.1.7.1 New Product Launch/Service Deployment
        2. 5.1.7.2 Merger & Acquisitions
        3. 5.1.7.3 Joint Ventures
      8. 5.1.8 Major Players Financial Matrix
        1. 5.1.8.1 Sales and Operating Income
        2. 5.1.8.2 Major Players R&D Expenditure. 2023
    2. 5.2 Company Profiles
      1. 5.2.1 Concept2 (US)
        1. 5.2.1.1 Financial Overview
        2. 5.2.1.2 Products Offered
        3. 5.2.1.3 Key Developments
        4. 5.2.1.4 SWOT Analysis
        5. 5.2.1.5 Key Strategies
      2. 5.2.2 WaterRower (US)
        1. 5.2.2.1 Financial Overview
        2. 5.2.2.2 Products Offered
        3. 5.2.2.3 Key Developments
        4. 5.2.2.4 SWOT Analysis
        5. 5.2.2.5 Key Strategies
      3. 5.2.3 NordicTrack (US)
        1. 5.2.3.1 Financial Overview
        2. 5.2.3.2 Products Offered
        3. 5.2.3.3 Key Developments
        4. 5.2.3.4 SWOT Analysis
        5. 5.2.3.5 Key Strategies
      4. 5.2.4 ProForm (US)
        1. 5.2.4.1 Financial Overview
        2. 5.2.4.2 Products Offered
        3. 5.2.4.3 Key Developments
        4. 5.2.4.4 SWOT Analysis
        5. 5.2.4.5 Key Strategies
      5. 5.2.5 Stamina Products (US)
        1. 5.2.5.1 Financial Overview
        2. 5.2.5.2 Products Offered
        3. 5.2.5.3 Key Developments
        4. 5.2.5.4 SWOT Analysis
        5. 5.2.5.5 Key Strategies
      6. 5.2.6 Kettler (DE)
        1. 5.2.6.1 Financial Overview
        2. 5.2.6.2 Products Offered
        3. 5.2.6.3 Key Developments
        4. 5.2.6.4 SWOT Analysis
        5. 5.2.6.5 Key Strategies
      7. 5.2.7 Life Fitness (US)
        1. 5.2.7.1 Financial Overview
        2. 5.2.7.2 Products Offered
        3. 5.2.7.3 Key Developments
        4. 5.2.7.4 SWOT Analysis
        5. 5.2.7.5 Key Strategies
      8. 5.2.8 Sunny Health & Fitness (US)
        1. 5.2.8.1 Financial Overview
        2. 5.2.8.2 Products Offered
        3. 5.2.8.3 Key Developments
        4. 5.2.8.4 SWOT Analysis
        5. 5.2.8.5 Key Strategies
      9. 5.2.9 First Degree Fitness (AU)
        1. 5.2.9.1 Financial Overview
        2. 5.2.9.2 Products Offered
        3. 5.2.9.3 Key Developments
        4. 5.2.9.4 SWOT Analysis
        5. 5.2.9.5 Key Strategies
    3. 5.3 Appendix
      1. 5.3.1 References
      2. 5.3.2 Related Reports
  6. 6 LIST OF FIGURES
    1. 6.1 MARKET SYNOPSIS
    2. 6.2 US MARKET ANALYSIS BY TYPE
    3. 6.3 US MARKET ANALYSIS BY BODY TYPE
    4. 6.4 US MARKET ANALYSIS BY WEIGHT CAPACITY
    5. 6.5 US MARKET ANALYSIS BY DISTRIBUTION CHANNEL
    6. 6.6 US MARKET ANALYSIS BY RESISTANT LEVEL
    7. 6.7 US MARKET ANALYSIS BY COLOR
    8. 6.8 US MARKET ANALYSIS BY END-USER
    9. 6.9 KEY BUYING CRITERIA OF FOOD, BEVERAGES & NUTRITION
    10. 6.10 RESEARCH PROCESS OF MRFR
    11. 6.11 DRO ANALYSIS OF FOOD, BEVERAGES & NUTRITION
    12. 6.12 DRIVERS IMPACT ANALYSIS: FOOD, BEVERAGES & NUTRITION
    13. 6.13 RESTRAINTS IMPACT ANALYSIS: FOOD, BEVERAGES & NUTRITION
    14. 6.14 SUPPLY / VALUE CHAIN: FOOD, BEVERAGES & NUTRITION
    15. 6.15 FOOD, BEVERAGES & NUTRITION, BY TYPE, 2024 (% SHARE)
    16. 6.16 FOOD, BEVERAGES & NUTRITION, BY TYPE, 2024 TO 2035 (USD Million)
    17. 6.17 FOOD, BEVERAGES & NUTRITION, BY BODY TYPE, 2024 (% SHARE)
    18. 6.18 FOOD, BEVERAGES & NUTRITION, BY BODY TYPE, 2024 TO 2035 (USD Million)
    19. 6.19 FOOD, BEVERAGES & NUTRITION, BY WEIGHT CAPACITY, 2024 (% SHARE)
    20. 6.20 FOOD, BEVERAGES & NUTRITION, BY WEIGHT CAPACITY, 2024 TO 2035 (USD Million)
    21. 6.21 FOOD, BEVERAGES & NUTRITION, BY DISTRIBUTION CHANNEL, 2024 (% SHARE)
    22. 6.22 FOOD, BEVERAGES & NUTRITION, BY DISTRIBUTION CHANNEL, 2024 TO 2035 (USD Million)
    23. 6.23 FOOD, BEVERAGES & NUTRITION, BY RESISTANT LEVEL, 2024 (% SHARE)
    24. 6.24 FOOD, BEVERAGES & NUTRITION, BY RESISTANT LEVEL, 2024 TO 2035 (USD Million)
    25. 6.25 FOOD, BEVERAGES & NUTRITION, BY COLOR, 2024 (% SHARE)
    26. 6.26 FOOD, BEVERAGES & NUTRITION, BY COLOR, 2024 TO 2035 (USD Million)
    27. 6.27 FOOD, BEVERAGES & NUTRITION, BY END-USER, 2024 (% SHARE)
    28. 6.28 FOOD, BEVERAGES & NUTRITION, BY END-USER, 2024 TO 2035 (USD Million)
    29. 6.29 BENCHMARKING OF MAJOR COMPETITORS
  7. 7 LIST OF TABLES
    1. 7.1 LIST OF ASSUMPTIONS
  8. 7.1.1
    1. 7.2 US MARKET SIZE ESTIMATES; FORECAST
      1. 7.2.1 BY TYPE, 2025-2035 (USD Million)
      2. 7.2.2 BY BODY TYPE, 2025-2035 (USD Million)
      3. 7.2.3 BY WEIGHT CAPACITY, 2025-2035 (USD Million)
      4. 7.2.4 BY DISTRIBUTION CHANNEL, 2025-2035 (USD Million)
      5. 7.2.5 BY RESISTANT LEVEL, 2025-2035 (USD Million)
      6. 7.2.6 BY COLOR, 2025-2035 (USD Million)
      7. 7.2.7 BY END-USER, 2025-2035 (USD Million)
    2. 7.3 PRODUCT LAUNCH/PRODUCT DEVELOPMENT/APPROVAL
  9. 7.3.1
    1. 7.4 ACQUISITION/PARTNERSHIP
  10. 7.4.1

US Food, Beverages & Nutrition Market Segmentation

Food, Beverages & Nutrition By Type (USD Million, 2025-2035)
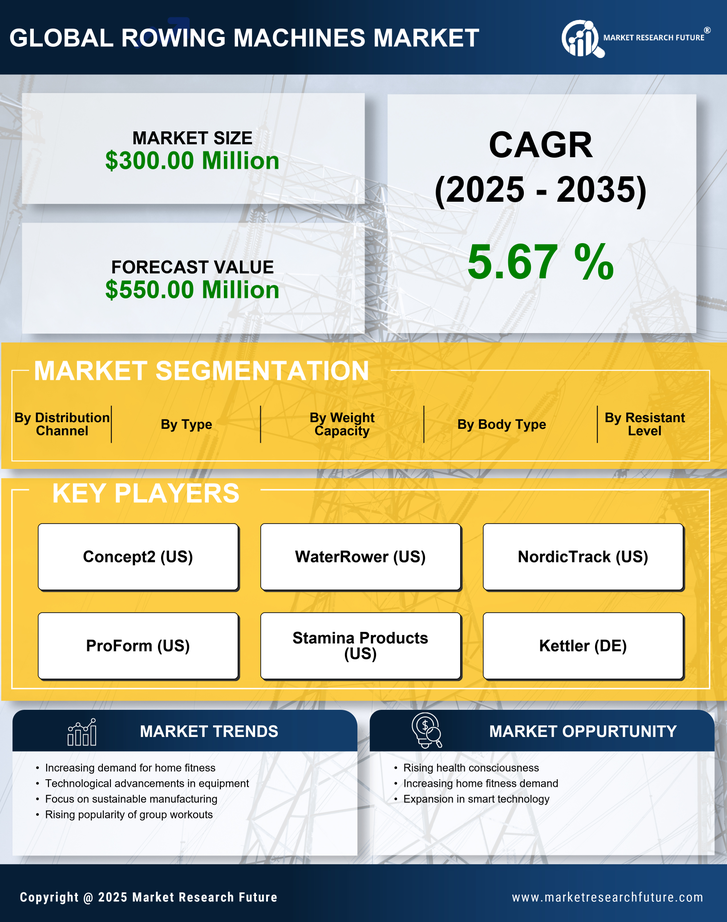
  • Air
  • Water
  • Magnetic
  • Hydraulic

Food, Beverages & Nutrition By Body Type (USD Million, 2025-2035)

  • Metal
  • Solid Wood

Food, Beverages & Nutrition By Weight Capacity (USD Million, 2025-2035)

  • 300 to 499 Pounds
  • 200 to 249 Pounds
  • 100 to 199 Pounds
  • Under 100 Pounds

Food, Beverages & Nutrition By Distribution Channel (USD Million, 2025-2035)

  • Online
  • Offline

Food, Beverages & Nutrition By Resistant Level (USD Million, 2025-2035)

  • Less Than 24
  • More Than 24

Food, Beverages & Nutrition By Color (USD Million, 2025-2035)

  • Black
  • Light Grey
  • Others

Food, Beverages & Nutrition By End-User (USD Million, 2025-2035)

  • Commercial
  • Residential