US Pump Jack Market

ID: MRFR/EnP/12135-HCR
100 Pages
Snehal Singh
Last Updated: April 06, 2026
US Pump Jack Market Research Report By Type (Conventional Pump Jacks, Smart Pump Jacks, Modular Pump Jacks), By Power Source (Electric Powered, Solar Powered, Hydraulic Powered, Gas Powered), By End Use (Onshore, Offshore) and By Application (Oil Extraction, Gas Extraction, Water Supply) - Forecast to 2035
Download PDF ×

We do not share your information with anyone. However, we may send you emails based on your report interest from time to time. You may contact us at any time to opt-out.

US Pump Jack Market

Market Size

Forecast Period2025 - 2035
CAGR (2025 - 2035)2.33%
2024 Market Size$ 749.35 Million
2025 Market Size$ 766.81 Million
2035 Market Size$ 965 Million

Key Players

Schlumberger
Halliburton
Baker Hughes
Weatherford International
National Oilwell Varco
Tenaris
Opportunities
  • Rising Exploration Activities
  • Increased Oil Production Demand
  • Growing Focus on Operational Efficiency
  1. 1 SECTION I: EXECUTIVE SUMMARY AND KEY HIGHLIGHTS
    1. 1.1 EXECUTIVE SUMMARY
      1. 1.1.1 Market Overview
      2. 1.1.2 Key Findings
      3. 1.1.3 Market Segmentation
      4. 1.1.4 Competitive Landscape
      5. 1.1.5 Challenges and Opportunities
      6. 1.1.6 Future Outlook
  2. 2 SECTION II: SCOPING, METHODOLOGY AND MARKET STRUCTURE
    1. 2.1 MARKET INTRODUCTION
      1. 2.1.1 Definition
      2. 2.1.2 Scope of the study
        1. 2.1.2.1 Research Objective
        2. 2.1.2.2 Assumption
        3. 2.1.2.3 Limitations
    2. 2.2 RESEARCH METHODOLOGY
      1. 2.2.1 Overview
      2. 2.2.2 Data Mining
      3. 2.2.3 Secondary Research
      4. 2.2.4 Primary Research
        1. 2.2.4.1 Primary Interviews and Information Gathering Process
        2. 2.2.4.2 Breakdown of Primary Respondents
      5. 2.2.5 Forecasting Model
      6. 2.2.6 Market Size Estimation
        1. 2.2.6.1 Bottom-Up Approach
        2. 2.2.6.2 Top-Down Approach
      7. 2.2.7 Data Triangulation
      8. 2.2.8 Validation
  3. 3 SECTION III: QUALITATIVE ANALYSIS
    1. 3.1 MARKET DYNAMICS
      1. 3.1.1 Overview
      2. 3.1.2 Drivers
      3. 3.1.3 Restraints
      4. 3.1.4 Opportunities
    2. 3.2 MARKET FACTOR ANALYSIS
      1. 3.2.1 Value chain Analysis
      2. 3.2.2 Porter's Five Forces Analysis
        1. 3.2.2.1 Bargaining Power of Suppliers
        2. 3.2.2.2 Bargaining Power of Buyers
        3. 3.2.2.3 Threat of New Entrants
        4. 3.2.2.4 Threat of Substitutes
        5. 3.2.2.5 Intensity of Rivalry
      3. 3.2.3 COVID-19 Impact Analysis
        1. 3.2.3.1 Market Impact Analysis
        2. 3.2.3.2 Regional Impact
        3. 3.2.3.3 Opportunity and Threat Analysis
  4. 4 SECTION IV: QUANTITATIVE ANALYSIS
    1. 4.1 Healthcare, BY Type (USD Million)
      1. 4.1.1 Conventional Pump Jacks
      2. 4.1.2 Smart Pump Jacks
      3. 4.1.3 Modular Pump Jacks
    2. 4.2 Healthcare, BY Power Source (USD Million)
      1. 4.2.1 Electric Powered
      2. 4.2.2 Solar Powered
      3. 4.2.3 Hydraulic Powered
      4. 4.2.4 Gas Powered
    3. 4.3 Healthcare, BY End Use (USD Million)
      1. 4.3.1 Onshore
      2. 4.3.2 Offshore
    4. 4.4 Healthcare, BY Application (USD Million)
      1. 4.4.1 Oil Extraction
      2. 4.4.2 Gas Extraction
      3. 4.4.3 Water Supply
  5. 5 SECTION V: COMPETITIVE ANALYSIS
    1. 5.1 Competitive Landscape
      1. 5.1.1 Overview
      2. 5.1.2 Competitive Analysis
      3. 5.1.3 Market share Analysis
      4. 5.1.4 Major Growth Strategy in the Healthcare
      5. 5.1.5 Competitive Benchmarking
      6. 5.1.6 Leading Players in Terms of Number of Developments in the Healthcare
      7. 5.1.7 Key developments and growth strategies
        1. 5.1.7.1 New Product Launch/Service Deployment
        2. 5.1.7.2 Merger & Acquisitions
        3. 5.1.7.3 Joint Ventures
      8. 5.1.8 Major Players Financial Matrix
        1. 5.1.8.1 Sales and Operating Income
        2. 5.1.8.2 Major Players R&D Expenditure. 2023
    2. 5.2 Company Profiles
      1. 5.2.1 Schlumberger (US)
        1. 5.2.1.1 Financial Overview
        2. 5.2.1.2 Products Offered
        3. 5.2.1.3 Key Developments
        4. 5.2.1.4 SWOT Analysis
        5. 5.2.1.5 Key Strategies
      2. 5.2.2 Halliburton (US)
        1. 5.2.2.1 Financial Overview
        2. 5.2.2.2 Products Offered
        3. 5.2.2.3 Key Developments
        4. 5.2.2.4 SWOT Analysis
        5. 5.2.2.5 Key Strategies
      3. 5.2.3 Baker Hughes (US)
        1. 5.2.3.1 Financial Overview
        2. 5.2.3.2 Products Offered
        3. 5.2.3.3 Key Developments
        4. 5.2.3.4 SWOT Analysis
        5. 5.2.3.5 Key Strategies
      4. 5.2.4 Weatherford International (US)
        1. 5.2.4.1 Financial Overview
        2. 5.2.4.2 Products Offered
        3. 5.2.4.3 Key Developments
        4. 5.2.4.4 SWOT Analysis
        5. 5.2.4.5 Key Strategies
      5. 5.2.5 National Oilwell Varco (US)
        1. 5.2.5.1 Financial Overview
        2. 5.2.5.2 Products Offered
        3. 5.2.5.3 Key Developments
        4. 5.2.5.4 SWOT Analysis
        5. 5.2.5.5 Key Strategies
      6. 5.2.6 Tenaris (AR)
        1. 5.2.6.1 Financial Overview
        2. 5.2.6.2 Products Offered
        3. 5.2.6.3 Key Developments
        4. 5.2.6.4 SWOT Analysis
        5. 5.2.6.5 Key Strategies
      7. 5.2.7 Cameron International (US)
        1. 5.2.7.1 Financial Overview
        2. 5.2.7.2 Products Offered
        3. 5.2.7.3 Key Developments
        4. 5.2.7.4 SWOT Analysis
        5. 5.2.7.5 Key Strategies
      8. 5.2.8 Parker Hannifin (US)
        1. 5.2.8.1 Financial Overview
        2. 5.2.8.2 Products Offered
        3. 5.2.8.3 Key Developments
        4. 5.2.8.4 SWOT Analysis
        5. 5.2.8.5 Key Strategies
      9. 5.2.9 Aker Solutions (NO)
        1. 5.2.9.1 Financial Overview
        2. 5.2.9.2 Products Offered
        3. 5.2.9.3 Key Developments
        4. 5.2.9.4 SWOT Analysis
        5. 5.2.9.5 Key Strategies
    3. 5.3 Appendix
      1. 5.3.1 References
      2. 5.3.2 Related Reports
  6. 6 LIST OF FIGURES
    1. 6.1 MARKET SYNOPSIS
    2. 6.2 US MARKET ANALYSIS BY TYPE
    3. 6.3 US MARKET ANALYSIS BY POWER SOURCE
    4. 6.4 US MARKET ANALYSIS BY END USE
    5. 6.5 US MARKET ANALYSIS BY APPLICATION
    6. 6.6 KEY BUYING CRITERIA OF HEALTHCARE
    7. 6.7 RESEARCH PROCESS OF MRFR
    8. 6.8 DRO ANALYSIS OF HEALTHCARE
    9. 6.9 DRIVERS IMPACT ANALYSIS: HEALTHCARE
    10. 6.10 RESTRAINTS IMPACT ANALYSIS: HEALTHCARE
    11. 6.11 SUPPLY / VALUE CHAIN: HEALTHCARE
    12. 6.12 HEALTHCARE, BY TYPE, 2024 (% SHARE)
    13. 6.13 HEALTHCARE, BY TYPE, 2024 TO 2035 (USD Million)
    14. 6.14 HEALTHCARE, BY POWER SOURCE, 2024 (% SHARE)
    15. 6.15 HEALTHCARE, BY POWER SOURCE, 2024 TO 2035 (USD Million)
    16. 6.16 HEALTHCARE, BY END USE, 2024 (% SHARE)
    17. 6.17 HEALTHCARE, BY END USE, 2024 TO 2035 (USD Million)
    18. 6.18 HEALTHCARE, BY APPLICATION, 2024 (% SHARE)
    19. 6.19 HEALTHCARE, BY APPLICATION, 2024 TO 2035 (USD Million)
    20. 6.20 BENCHMARKING OF MAJOR COMPETITORS
  7. 7 LIST OF TABLES
    1. 7.1 LIST OF ASSUMPTIONS
  8. 7.1.1
    1. 7.2 US MARKET SIZE ESTIMATES; FORECAST
      1. 7.2.1 BY TYPE, 2025-2035 (USD Million)
      2. 7.2.2 BY POWER SOURCE, 2025-2035 (USD Million)
      3. 7.2.3 BY END USE, 2025-2035 (USD Million)
      4. 7.2.4 BY APPLICATION, 2025-2035 (USD Million)
    2. 7.3 PRODUCT LAUNCH/PRODUCT DEVELOPMENT/APPROVAL
  9. 7.3.1
    1. 7.4 ACQUISITION/PARTNERSHIP
  10. 7.4.1

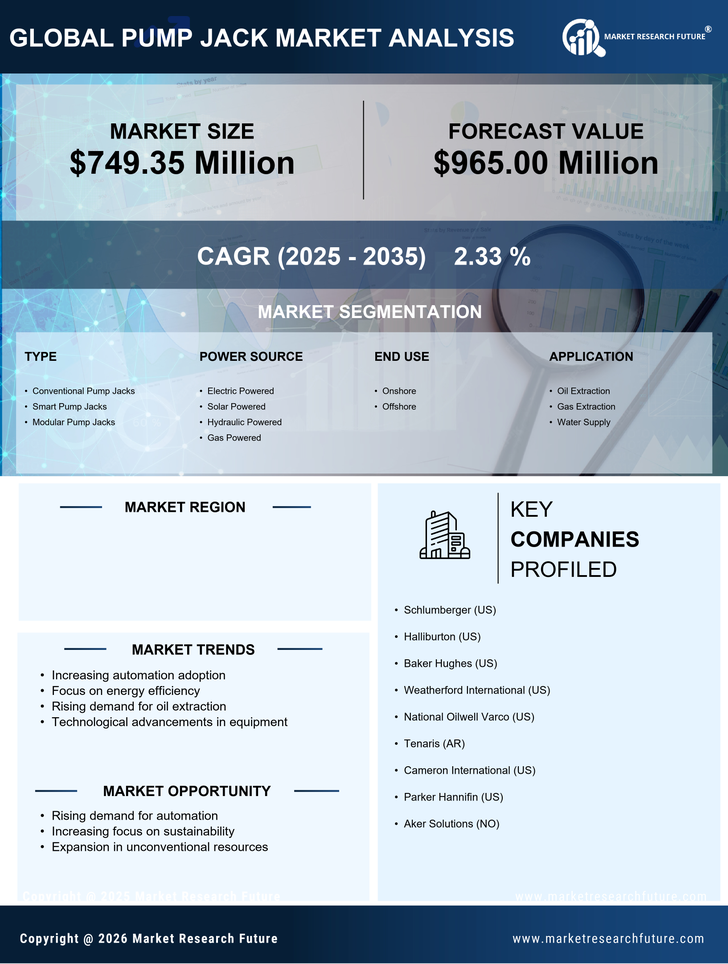
US Healthcare Market Segmentation

Healthcare By Type (USD Million, 2025-2035)

  • Conventional Pump Jacks
  • Smart Pump Jacks
  • Modular Pump Jacks

Healthcare By Power Source (USD Million, 2025-2035)

  • Electric Powered
  • Solar Powered
  • Hydraulic Powered
  • Gas Powered

Healthcare By End Use (USD Million, 2025-2035)

  • Onshore
  • Offshore

Healthcare By Application (USD Million, 2025-2035)

  • Oil Extraction
  • Gas Extraction
  • Water Supply