Request Free Sample ×

Kindly complete the form below to receive a free sample of this Report

* Please use a valid business email

Leading companies partner with us for data-driven Insights

clients tt-cursor
Hero Background

US Muscle Stimulator Market

ID: MRFR/MED/17907-HCR
100 Pages
Vikita Thakur
Last Updated: April 06, 2026

US Muscle Stimulator Market Research Report By Product (Transcutaneous Electrical Nerve Stimulator, Burst Mode Alternating Current, Neuromuscular Electric Stimulation, Interferential Current) and By Application (Pain Management, Neurological And Movement Disorder Management, Musculoskeletal Disorder Management) - Growth & Industry Forecast 2025 To 2035

Share:
Download PDF ×

We do not share your information with anyone. However, we may send you emails based on your report interest from time to time. You may contact us at any time to opt-out.

US Muscle Stimulator Market Infographic
Purchase Options
  1. 1 SECTION I: EXECUTIVE SUMMARY AND KEY HIGHLIGHTS
  2.   1.1 EXECUTIVE SUMMARY
  3.     1.1.1 Market Overview
  4.     1.1.2 Key Findings
  5.     1.1.3 Market Segmentation
  6.     1.1.4 Competitive Landscape
  7.     1.1.5 Challenges and Opportunities
  8.     1.1.6 Future Outlook
  9. 2 SECTION II: SCOPING, METHODOLOGY AND MARKET STRUCTURE
  10.   2.1 MARKET INTRODUCTION
  11.     2.1.1 Definition
  12.     2.1.2 Scope of the study
  13.       2.1.2.1 Research Objective
  14.       2.1.2.2 Assumption
  15.       2.1.2.3 Limitations
  16.   2.2 RESEARCH METHODOLOGY
  17.     2.2.1 Overview
  18.     2.2.2 Data Mining
  19.     2.2.3 Secondary Research
  20.     2.2.4 Primary Research
  21.       2.2.4.1 Primary Interviews and Information Gathering Process
  22.       2.2.4.2 Breakdown of Primary Respondents
  23.     2.2.5 Forecasting Model
  24.     2.2.6 Market Size Estimation
  25.       2.2.6.1 Bottom-Up Approach
  26.       2.2.6.2 Top-Down Approach
  27.     2.2.7 Data Triangulation
  28.     2.2.8 Validation
  29. 3 SECTION III: QUALITATIVE ANALYSIS
  30.   3.1 MARKET DYNAMICS
  31.     3.1.1 Overview
  32.     3.1.2 Drivers
  33.     3.1.3 Restraints
  34.     3.1.4 Opportunities
  35.   3.2 MARKET FACTOR ANALYSIS
  36.     3.2.1 Value chain Analysis
  37.     3.2.2 Porter's Five Forces Analysis
  38.       3.2.2.1 Bargaining Power of Suppliers
  39.       3.2.2.2 Bargaining Power of Buyers
  40.       3.2.2.3 Threat of New Entrants
  41.       3.2.2.4 Threat of Substitutes
  42.       3.2.2.5 Intensity of Rivalry
  43.     3.2.3 COVID-19 Impact Analysis
  44.       3.2.3.1 Market Impact Analysis
  45.       3.2.3.2 Regional Impact
  46.       3.2.3.3 Opportunity and Threat Analysis
  47. 4 SECTION IV: QUANTITATIVE ANALYSIS
  48.   4.1 Healthcare, BY Application (USD Million)
  49.     4.1.1 Pain Management
  50.     4.1.2 Rehabilitation
  51.     4.1.3 Muscle Strengthening
  52.     4.1.4 Athletic Performance Enhancement
  53.   4.2 Healthcare, BY Product Type (USD Million)
  54.     4.2.1 Transcutaneous Electrical Nerve Stimulation
  55.     4.2.2 Electrical Muscle Stimulation
  56.     4.2.3 Functional Electrical Stimulation
  57.     4.2.4 Neuromuscular Electrical Stimulation
  58.   4.3 Healthcare, BY End-use (USD Million)
  59.     4.3.1 Hospitals
  60.     4.3.2 Physiotherapy Clinics
  61.     4.3.3 Home Care Settings
  62.     4.3.4 Sports Facilities
  63.   4.4 Healthcare, BY Technology (USD Million)
  64.     4.4.1 Analog
  65.     4.4.2 Digital
  66.     4.4.3 Wireless
  67. 5 SECTION V: COMPETITIVE ANALYSIS
  68.   5.1 Competitive Landscape
  69.     5.1.1 Overview
  70.     5.1.2 Competitive Analysis
  71.     5.1.3 Market share Analysis
  72.     5.1.4 Major Growth Strategy in the Healthcare
  73.     5.1.5 Competitive Benchmarking
  74.     5.1.6 Leading Players in Terms of Number of Developments in the Healthcare
  75.     5.1.7 Key developments and growth strategies
  76.       5.1.7.1 New Product Launch/Service Deployment
  77.       5.1.7.2 Merger & Acquisitions
  78.       5.1.7.3 Joint Ventures
  79.     5.1.8 Major Players Financial Matrix
  80.       5.1.8.1 Sales and Operating Income
  81.       5.1.8.2 Major Players R&D Expenditure. 2023
  82.   5.2 Company Profiles
  83.     5.2.1 Compex (CH)
  84.       5.2.1.1 Financial Overview
  85.       5.2.1.2 Products Offered
  86.       5.2.1.3 Key Developments
  87.       5.2.1.4 SWOT Analysis
  88.       5.2.1.5 Key Strategies
  89.     5.2.2 TENS 7000 (US)
  90.       5.2.2.1 Financial Overview
  91.       5.2.2.2 Products Offered
  92.       5.2.2.3 Key Developments
  93.       5.2.2.4 SWOT Analysis
  94.       5.2.2.5 Key Strategies
  95.     5.2.3 Omron Healthcare (JP)
  96.       5.2.3.1 Financial Overview
  97.       5.2.3.2 Products Offered
  98.       5.2.3.3 Key Developments
  99.       5.2.3.4 SWOT Analysis
  100.       5.2.3.5 Key Strategies
  101.     5.2.4 PowerDot (US)
  102.       5.2.4.1 Financial Overview
  103.       5.2.4.2 Products Offered
  104.       5.2.4.3 Key Developments
  105.       5.2.4.4 SWOT Analysis
  106.       5.2.4.5 Key Strategies
  107.     5.2.5 Marc Pro (US)
  108.       5.2.5.1 Financial Overview
  109.       5.2.5.2 Products Offered
  110.       5.2.5.3 Key Developments
  111.       5.2.5.4 SWOT Analysis
  112.       5.2.5.5 Key Strategies
  113.     5.2.6 iReliev (US)
  114.       5.2.6.1 Financial Overview
  115.       5.2.6.2 Products Offered
  116.       5.2.6.3 Key Developments
  117.       5.2.6.4 SWOT Analysis
  118.       5.2.6.5 Key Strategies
  119.     5.2.7 Zynex Medical (US)
  120.       5.2.7.1 Financial Overview
  121.       5.2.7.2 Products Offered
  122.       5.2.7.3 Key Developments
  123.       5.2.7.4 SWOT Analysis
  124.       5.2.7.5 Key Strategies
  125.     5.2.8 BodyMed (US)
  126.       5.2.8.1 Financial Overview
  127.       5.2.8.2 Products Offered
  128.       5.2.8.3 Key Developments
  129.       5.2.8.4 SWOT Analysis
  130.       5.2.8.5 Key Strategies
  131.   5.3 Appendix
  132.     5.3.1 References
  133.     5.3.2 Related Reports
  134. 6 LIST OF FIGURES
  135.   6.1 MARKET SYNOPSIS
  136.   6.2 US MARKET ANALYSIS BY APPLICATION
  137.   6.3 US MARKET ANALYSIS BY PRODUCT TYPE
  138.   6.4 US MARKET ANALYSIS BY END-USE
  139.   6.5 US MARKET ANALYSIS BY TECHNOLOGY
  140.   6.6 KEY BUYING CRITERIA OF HEALTHCARE
  141.   6.7 RESEARCH PROCESS OF MRFR
  142.   6.8 DRO ANALYSIS OF HEALTHCARE
  143.   6.9 DRIVERS IMPACT ANALYSIS: HEALTHCARE
  144.   6.10 RESTRAINTS IMPACT ANALYSIS: HEALTHCARE
  145.   6.11 SUPPLY / VALUE CHAIN: HEALTHCARE
  146.   6.12 HEALTHCARE, BY APPLICATION, 2024 (% SHARE)
  147.   6.13 HEALTHCARE, BY APPLICATION, 2024 TO 2035 (USD Million)
  148.   6.14 HEALTHCARE, BY PRODUCT TYPE, 2024 (% SHARE)
  149.   6.15 HEALTHCARE, BY PRODUCT TYPE, 2024 TO 2035 (USD Million)
  150.   6.16 HEALTHCARE, BY END-USE, 2024 (% SHARE)
  151.   6.17 HEALTHCARE, BY END-USE, 2024 TO 2035 (USD Million)
  152.   6.18 HEALTHCARE, BY TECHNOLOGY, 2024 (% SHARE)
  153.   6.19 HEALTHCARE, BY TECHNOLOGY, 2024 TO 2035 (USD Million)
  154.   6.20 BENCHMARKING OF MAJOR COMPETITORS
  155. 7 LIST OF TABLES
  156.   7.1 LIST OF ASSUMPTIONS
  157.     7.1.1
  158.   7.2 US MARKET SIZE ESTIMATES; FORECAST
  159.     7.2.1 BY APPLICATION, 2025-2035 (USD Million)
  160.     7.2.2 BY PRODUCT TYPE, 2025-2035 (USD Million)
  161.     7.2.3 BY END-USE, 2025-2035 (USD Million)
  162.     7.2.4 BY TECHNOLOGY, 2025-2035 (USD Million)
  163.   7.3 PRODUCT LAUNCH/PRODUCT DEVELOPMENT/APPROVAL
  164.     7.3.1
  165.   7.4 ACQUISITION/PARTNERSHIP
  166.     7.4.1

US Healthcare Market Segmentation

Healthcare By Application (USD Million, 2025-2035)
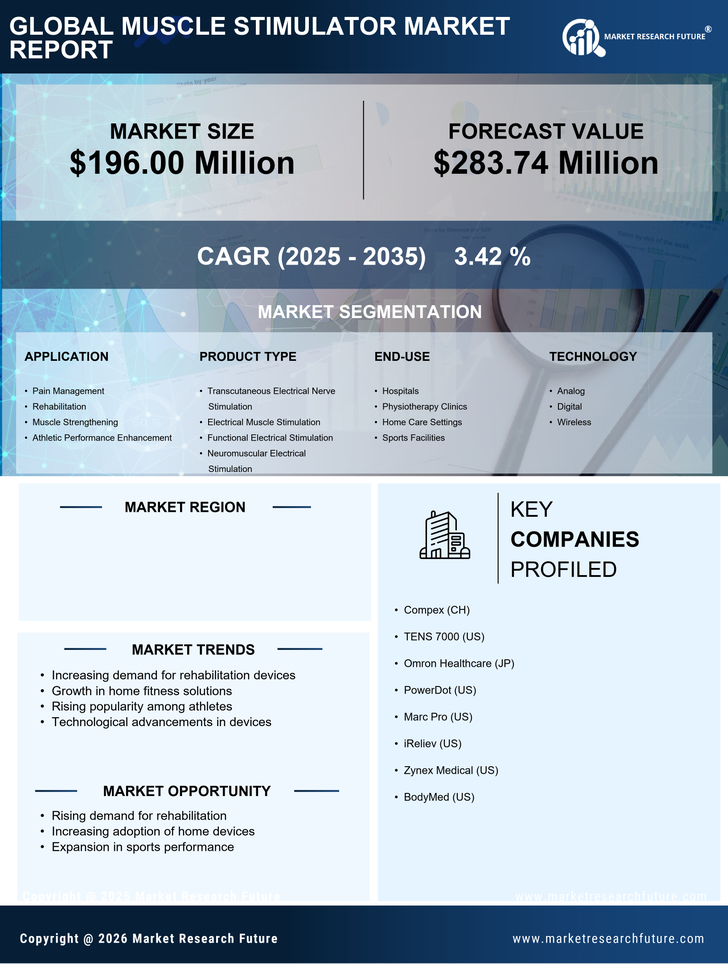
  • Pain Management
  • Rehabilitation
  • Muscle Strengthening
  • Athletic Performance Enhancement

Healthcare By Product Type (USD Million, 2025-2035)

  • Transcutaneous Electrical Nerve Stimulation
  • Electrical Muscle Stimulation
  • Functional Electrical Stimulation
  • Neuromuscular Electrical Stimulation

Healthcare By End-use (USD Million, 2025-2035)

  • Hospitals
  • Physiotherapy Clinics
  • Home Care Settings
  • Sports Facilities

Healthcare By Technology (USD Million, 2025-2035)

  • Analog
  • Digital
  • Wireless

Compare Licence

×
Features License Type
Single User Multiuser License Enterprise User
Price $4,950 $5,950 $7,250
Maximum User Access Limit 1 User Upto 10 Users Unrestricted Access Throughout the Organization
Free Customization
Direct Access to Analyst
Deliverable Format
Platform Access
Discount on Next Purchase 10% 15% 15%
Printable Versions