US Military Data Links Market

ID: MRFR/AD/63977-HCR
200 Pages
Triveni Bhoyar
Last Updated: April 06, 2026
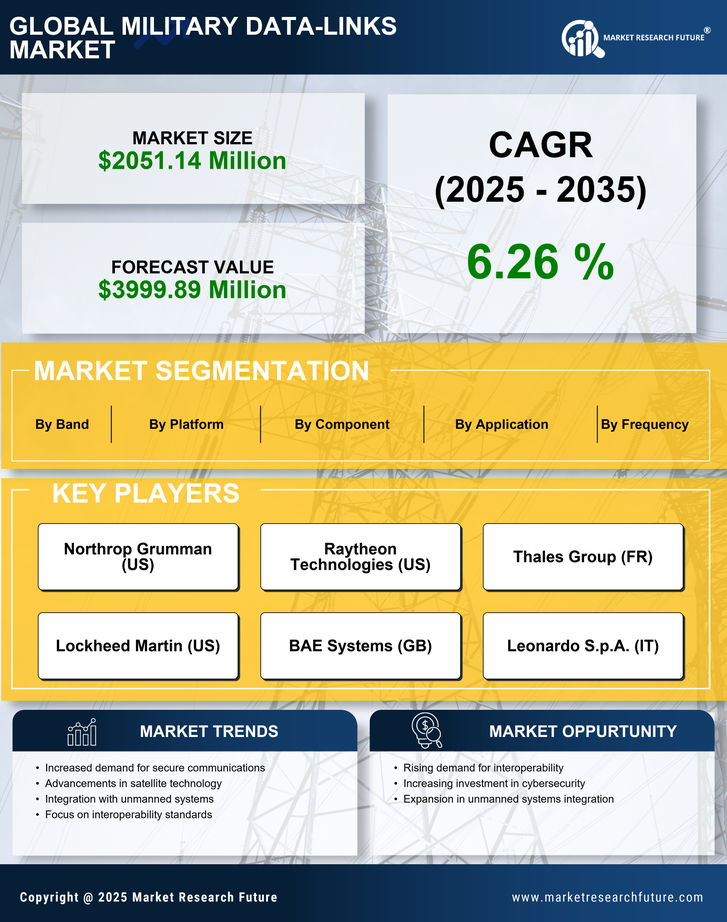
US Military Data Links Market Size, Share, Industry Trend & Analysis Research Report By Platform (Ground, Airborne, Naval, Unmanned Systems, Weapons), By Application (Command and Control, Intelligence, Surveillance, Reconnaissance, Radio Communications), By Component (Terminals, Radio Sets, Modems, Routers, Controllers, Transceivers, Monitors, Others), By Band (Ka/K Band, X-Band, Ku Band, S-Band, C-Band, L-Band, HF Band, VHF Band, UHF Band), By Frequency (High Frequency, Ultra-High Frequency), By Link Type (Link 11, Link 16, Link 22, JREAP-A, JREAP-C, VMF), By Point-of-Sale (OEM, Aftermarket) and By Military Standard (MIL STD 6011, MIL STD 6016, MIL STD 6017, MIL STD 6020, MIL STD 3011) - Forecast to 2035
Download PDF ×

We do not share your information with anyone. However, we may send you emails based on your report interest from time to time. You may contact us at any time to opt-out.

US Military Data Links Market

Market Size

Forecast Period2025 - 2035
CAGR (2025 - 2035)6.26%
2024 Market Size$ 2,051.14 Million
2025 Market Size$ 2,179.54 Million
2035 Market Size$ 3,999.89 Million

Key Players

Northrop Grumman
Raytheon Technologies
Thales Group
Lockheed Martin
BAE Systems
Leonardo S.p.A.
Opportunities
  • Rising Geopolitical Tensions
  • Emphasis on Cybersecurity Measures
  • Growing Focus on Network Resilience
  1. 1 SECTION I: EXECUTIVE SUMMARY AND KEY HIGHLIGHTS
    1. 1.1 EXECUTIVE SUMMARY
      1. 1.1.1 Market Overview
      2. 1.1.2 Key Findings
      3. 1.1.3 Market Segmentation
      4. 1.1.4 Competitive Landscape
      5. 1.1.5 Challenges and Opportunities
      6. 1.1.6 Future Outlook
  2. 2 SECTION II: SCOPING, METHODOLOGY AND MARKET STRUCTURE
    1. 2.1 MARKET INTRODUCTION
      1. 2.1.1 Definition
      2. 2.1.2 Scope of the study
        1. 2.1.2.1 Research Objective
        2. 2.1.2.2 Assumption
        3. 2.1.2.3 Limitations
    2. 2.2 RESEARCH METHODOLOGY
      1. 2.2.1 Overview
      2. 2.2.2 Data Mining
      3. 2.2.3 Secondary Research
      4. 2.2.4 Primary Research
        1. 2.2.4.1 Primary Interviews and Information Gathering Process
        2. 2.2.4.2 Breakdown of Primary Respondents
      5. 2.2.5 Forecasting Model
      6. 2.2.6 Market Size Estimation
        1. 2.2.6.1 Bottom-Up Approach
        2. 2.2.6.2 Top-Down Approach
      7. 2.2.7 Data Triangulation
      8. 2.2.8 Validation
  3. 3 SECTION III: QUALITATIVE ANALYSIS
    1. 3.1 MARKET DYNAMICS
      1. 3.1.1 Overview
      2. 3.1.2 Drivers
      3. 3.1.3 Restraints
      4. 3.1.4 Opportunities
    2. 3.2 MARKET FACTOR ANALYSIS
      1. 3.2.1 Value chain Analysis
      2. 3.2.2 Porter's Five Forces Analysis
        1. 3.2.2.1 Bargaining Power of Suppliers
        2. 3.2.2.2 Bargaining Power of Buyers
        3. 3.2.2.3 Threat of New Entrants
        4. 3.2.2.4 Threat of Substitutes
        5. 3.2.2.5 Intensity of Rivalry
      3. 3.2.3 COVID-19 Impact Analysis
        1. 3.2.3.1 Market Impact Analysis
        2. 3.2.3.2 Regional Impact
        3. 3.2.3.3 Opportunity and Threat Analysis
  4. 4 SECTION IV: QUANTITATIVE ANALYSIS
    1. 4.1 Security, Access Control and Robotics, BY Platform (USD Million)
      1. 4.1.1 Ground
      2. 4.1.2 Airborne
      3. 4.1.3 Naval
      4. 4.1.4 Unmanned Systems
      5. 4.1.5 Weapons
    2. 4.2 Security, Access Control and Robotics, BY Application (USD Million)
      1. 4.2.1 Command and Control
      2. 4.2.2 Intelligence, Surveillance, & Reconnaissance
      3. 4.2.3 Radio Communication
    3. 4.3 Security, Access Control and Robotics, BY Component (USD Million)
      1. 4.3.1 Terminals
      2. 4.3.2 Radio Sets
      3. 4.3.3 Modems
      4. 4.3.4 Routers
      5. 4.3.5 Controllers
      6. 4.3.6 Transceivers
      7. 4.3.7 Monitors
      8. 4.3.8 Others
    4. 4.4 Security, Access Control and Robotics, BY Band (USD Million)
      1. 4.4.1 Ka/K Band
      2. 4.4.2 X-Band (Air to Ground)
      3. 4.4.3 Ku Band
      4. 4.4.4 S-Band
      5. 4.4.5 C-Band
      6. 4.4.6 L-Band
      7. 4.4.7 HF Band
      8. 4.4.8 VHF Band
      9. 4.4.9 UHF Band
    5. 4.5 Security, Access Control and Robotics, BY Frequency (USD Million)
      1. 4.5.1 High Frequency
      2. 4.5.2 Ultra-High Frequency
    6. 4.6 Security, Access Control and Robotics, BY Link Type (USD Million)
      1. 4.6.1 Link 11
      2. 4.6.2 Link 16
      3. 4.6.3 Link 22
      4. 4.6.4 JREAP-A
      5. 4.6.5 JREAP-C
      6. 4.6.6 VMF
    7. 4.7 Security, Access Control and Robotics, BY Point-of-Sale (USD Million)
      1. 4.7.1 OEM
      2. 4.7.2 Aftermarket
    8. 4.8 Security, Access Control and Robotics, BY Military Standard (USD Million)
      1. 4.8.1 MIL STD 6011
      2. 4.8.2 MIL STD 6016
      3. 4.8.3 MIL STD 6017
      4. 4.8.4 MIL STD 6020
      5. 4.8.5 MIL STD 3011
  5. 5 SECTION V: COMPETITIVE ANALYSIS
    1. 5.1 Competitive Landscape
      1. 5.1.1 Overview
      2. 5.1.2 Competitive Analysis
      3. 5.1.3 Market share Analysis
      4. 5.1.4 Major Growth Strategy in the Security, Access Control and Robotics
      5. 5.1.5 Competitive Benchmarking
      6. 5.1.6 Leading Players in Terms of Number of Developments in the Security, Access Control and Robotics
      7. 5.1.7 Key developments and growth strategies
        1. 5.1.7.1 New Product Launch/Service Deployment
        2. 5.1.7.2 Merger & Acquisitions
        3. 5.1.7.3 Joint Ventures
      8. 5.1.8 Major Players Financial Matrix
        1. 5.1.8.1 Sales and Operating Income
        2. 5.1.8.2 Major Players R&D Expenditure. 2023
    2. 5.2 Company Profiles
      1. 5.2.1 Northrop Grumman (US)
        1. 5.2.1.1 Financial Overview
        2. 5.2.1.2 Products Offered
        3. 5.2.1.3 Key Developments
        4. 5.2.1.4 SWOT Analysis
        5. 5.2.1.5 Key Strategies
      2. 5.2.2 Raytheon Technologies (US)
        1. 5.2.2.1 Financial Overview
        2. 5.2.2.2 Products Offered
        3. 5.2.2.3 Key Developments
        4. 5.2.2.4 SWOT Analysis
        5. 5.2.2.5 Key Strategies
      3. 5.2.3 Thales Group (FR)
        1. 5.2.3.1 Financial Overview
        2. 5.2.3.2 Products Offered
        3. 5.2.3.3 Key Developments
        4. 5.2.3.4 SWOT Analysis
        5. 5.2.3.5 Key Strategies
      4. 5.2.4 Lockheed Martin (US)
        1. 5.2.4.1 Financial Overview
        2. 5.2.4.2 Products Offered
        3. 5.2.4.3 Key Developments
        4. 5.2.4.4 SWOT Analysis
        5. 5.2.4.5 Key Strategies
      5. 5.2.5 BAE Systems (GB)
        1. 5.2.5.1 Financial Overview
        2. 5.2.5.2 Products Offered
        3. 5.2.5.3 Key Developments
        4. 5.2.5.4 SWOT Analysis
        5. 5.2.5.5 Key Strategies
      6. 5.2.6 Leonardo S.p.A. (IT)
        1. 5.2.6.1 Financial Overview
        2. 5.2.6.2 Products Offered
        3. 5.2.6.3 Key Developments
        4. 5.2.6.4 SWOT Analysis
        5. 5.2.6.5 Key Strategies
      7. 5.2.7 Harris Corporation (US)
        1. 5.2.7.1 Financial Overview
        2. 5.2.7.2 Products Offered
        3. 5.2.7.3 Key Developments
        4. 5.2.7.4 SWOT Analysis
        5. 5.2.7.5 Key Strategies
      8. 5.2.8 General Dynamics (US)
        1. 5.2.8.1 Financial Overview
        2. 5.2.8.2 Products Offered
        3. 5.2.8.3 Key Developments
        4. 5.2.8.4 SWOT Analysis
        5. 5.2.8.5 Key Strategies
      9. 5.2.9 L3Harris Technologies (US)
        1. 5.2.9.1 Financial Overview
        2. 5.2.9.2 Products Offered
        3. 5.2.9.3 Key Developments
        4. 5.2.9.4 SWOT Analysis
        5. 5.2.9.5 Key Strategies
    3. 5.3 Appendix
      1. 5.3.1 References
      2. 5.3.2 Related Reports
  6. 6 LIST OF FIGURES
    1. 6.1 MARKET SYNOPSIS
    2. 6.2 US MARKET ANALYSIS BY PLATFORM
    3. 6.3 US MARKET ANALYSIS BY APPLICATION
    4. 6.4 US MARKET ANALYSIS BY COMPONENT
    5. 6.5 US MARKET ANALYSIS BY BAND
    6. 6.6 US MARKET ANALYSIS BY FREQUENCY
    7. 6.7 US MARKET ANALYSIS BY LINK TYPE
    8. 6.8 US MARKET ANALYSIS BY POINT-OF-SALE
    9. 6.9 US MARKET ANALYSIS BY MILITARY STANDARD
    10. 6.10 KEY BUYING CRITERIA OF SECURITY, ACCESS CONTROL AND ROBOTICS
    11. 6.11 RESEARCH PROCESS OF MRFR
    12. 6.12 DRO ANALYSIS OF SECURITY, ACCESS CONTROL AND ROBOTICS
    13. 6.13 DRIVERS IMPACT ANALYSIS: SECURITY, ACCESS CONTROL AND ROBOTICS
    14. 6.14 RESTRAINTS IMPACT ANALYSIS: SECURITY, ACCESS CONTROL AND ROBOTICS
    15. 6.15 SUPPLY / VALUE CHAIN: SECURITY, ACCESS CONTROL AND ROBOTICS
    16. 6.16 SECURITY, ACCESS CONTROL AND ROBOTICS, BY PLATFORM, 2024 (% SHARE)
    17. 6.17 SECURITY, ACCESS CONTROL AND ROBOTICS, BY PLATFORM, 2024 TO 2035 (USD Million)
    18. 6.18 SECURITY, ACCESS CONTROL AND ROBOTICS, BY APPLICATION, 2024 (% SHARE)
    19. 6.19 SECURITY, ACCESS CONTROL AND ROBOTICS, BY APPLICATION, 2024 TO 2035 (USD Million)
    20. 6.20 SECURITY, ACCESS CONTROL AND ROBOTICS, BY COMPONENT, 2024 (% SHARE)
    21. 6.21 SECURITY, ACCESS CONTROL AND ROBOTICS, BY COMPONENT, 2024 TO 2035 (USD Million)
    22. 6.22 SECURITY, ACCESS CONTROL AND ROBOTICS, BY BAND, 2024 (% SHARE)
    23. 6.23 SECURITY, ACCESS CONTROL AND ROBOTICS, BY BAND, 2024 TO 2035 (USD Million)
    24. 6.24 SECURITY, ACCESS CONTROL AND ROBOTICS, BY FREQUENCY, 2024 (% SHARE)
    25. 6.25 SECURITY, ACCESS CONTROL AND ROBOTICS, BY FREQUENCY, 2024 TO 2035 (USD Million)
    26. 6.26 SECURITY, ACCESS CONTROL AND ROBOTICS, BY LINK TYPE, 2024 (% SHARE)
    27. 6.27 SECURITY, ACCESS CONTROL AND ROBOTICS, BY LINK TYPE, 2024 TO 2035 (USD Million)
    28. 6.28 SECURITY, ACCESS CONTROL AND ROBOTICS, BY POINT-OF-SALE, 2024 (% SHARE)
    29. 6.29 SECURITY, ACCESS CONTROL AND ROBOTICS, BY POINT-OF-SALE, 2024 TO 2035 (USD Million)
    30. 6.30 SECURITY, ACCESS CONTROL AND ROBOTICS, BY MILITARY STANDARD, 2024 (% SHARE)
    31. 6.31 SECURITY, ACCESS CONTROL AND ROBOTICS, BY MILITARY STANDARD, 2024 TO 2035 (USD Million)
    32. 6.32 BENCHMARKING OF MAJOR COMPETITORS
  7. 7 LIST OF TABLES
    1. 7.1 LIST OF ASSUMPTIONS
  8. 7.1.1
    1. 7.2 US MARKET SIZE ESTIMATES; FORECAST
      1. 7.2.1 BY PLATFORM, 2025-2035 (USD Million)
      2. 7.2.2 BY APPLICATION, 2025-2035 (USD Million)
      3. 7.2.3 BY COMPONENT, 2025-2035 (USD Million)
      4. 7.2.4 BY BAND, 2025-2035 (USD Million)
      5. 7.2.5 BY FREQUENCY, 2025-2035 (USD Million)
      6. 7.2.6 BY LINK TYPE, 2025-2035 (USD Million)
      7. 7.2.7 BY POINT-OF-SALE, 2025-2035 (USD Million)
      8. 7.2.8 BY MILITARY STANDARD, 2025-2035 (USD Million)
    2. 7.3 PRODUCT LAUNCH/PRODUCT DEVELOPMENT/APPROVAL
  9. 7.3.1
    1. 7.4 ACQUISITION/PARTNERSHIP
  10. 7.4.1

US Security, Access Control and Robotics Market Segmentation

Security, Access Control and Robotics By Platform (USD Million, 2025-2035)

  • Ground
  • Airborne
  • Naval
  • Unmanned Systems
  • Weapons

Security, Access Control and Robotics By Application (USD Million, 2025-2035)

  • Command and Control
  • Intelligence, Surveillance, & Reconnaissance
  • Radio Communication

Security, Access Control and Robotics By Component (USD Million, 2025-2035)

  • Terminals
  • Radio Sets
  • Modems
  • Routers
  • Controllers
  • Transceivers
  • Monitors
  • Others

Security, Access Control and Robotics By Band (USD Million, 2025-2035)

  • Ka/K Band
  • X-Band (Air to Ground)
  • Ku Band
  • S-Band
  • C-Band
  • L-Band
  • HF Band
  • VHF Band
  • UHF Band

Security, Access Control and Robotics By Frequency (USD Million, 2025-2035)

  • High Frequency
  • Ultra-High Frequency

Security, Access Control and Robotics By Link Type (USD Million, 2025-2035)

  • Link 11
  • Link 16
  • Link 22
  • JREAP-A
  • JREAP-C
  • VMF

Security, Access Control and Robotics By Point-of-Sale (USD Million, 2025-2035)

  • OEM
  • Aftermarket

Security, Access Control and Robotics By Military Standard (USD Million, 2025-2035)

  • MIL STD 6011
  • MIL STD 6016
  • MIL STD 6017
  • MIL STD 6020
  • MIL STD 3011