Request Free Sample ×

Kindly complete the form below to receive a free sample of this Report

* Please use a valid business email

Leading companies partner with us for data-driven Insights

clients tt-cursor
Hero Background

US Migraine Drugs Market

ID: MRFR/Pharma/17894-HCR
100 Pages
Rahul Gotadki
Last Updated: April 06, 2026

US Migraine Drugs Market Research Report: Size, Share, Trend Analysis By End-User (Hospitals And Clinics, Retail Pharmacy, Online Pharmacy, Others), By Types (Episodic Migraine, Chronic Migraine), By Treatment Type (Acute, Preventive, Neuromodulation Devices) and By Drug Class (Triptans, Betablockers, Angiotensin Blockers, Tricyclics, Anticonvulsants) - Growth Outlook & Industry Forecast 2025 To 2035

Share:
Download PDF ×

We do not share your information with anyone. However, we may send you emails based on your report interest from time to time. You may contact us at any time to opt-out.

US Migraine Drugs Market Infographic
Purchase Options
  1. 1 SECTION I: EXECUTIVE SUMMARY AND KEY HIGHLIGHTS
  2.   1.1 EXECUTIVE SUMMARY
  3.     1.1.1 Market Overview
  4.     1.1.2 Key Findings
  5.     1.1.3 Market Segmentation
  6.     1.1.4 Competitive Landscape
  7.     1.1.5 Challenges and Opportunities
  8.     1.1.6 Future Outlook
  9. 2 SECTION II: SCOPING, METHODOLOGY AND MARKET STRUCTURE
  10.   2.1 MARKET INTRODUCTION
  11.     2.1.1 Definition
  12.     2.1.2 Scope of the study
  13.       2.1.2.1 Research Objective
  14.       2.1.2.2 Assumption
  15.       2.1.2.3 Limitations
  16.   2.2 RESEARCH METHODOLOGY
  17.     2.2.1 Overview
  18.     2.2.2 Data Mining
  19.     2.2.3 Secondary Research
  20.     2.2.4 Primary Research
  21.       2.2.4.1 Primary Interviews and Information Gathering Process
  22.       2.2.4.2 Breakdown of Primary Respondents
  23.     2.2.5 Forecasting Model
  24.     2.2.6 Market Size Estimation
  25.       2.2.6.1 Bottom-Up Approach
  26.       2.2.6.2 Top-Down Approach
  27.     2.2.7 Data Triangulation
  28.     2.2.8 Validation
  29. 3 SECTION III: QUALITATIVE ANALYSIS
  30.   3.1 MARKET DYNAMICS
  31.     3.1.1 Overview
  32.     3.1.2 Drivers
  33.     3.1.3 Restraints
  34.     3.1.4 Opportunities
  35.   3.2 MARKET FACTOR ANALYSIS
  36.     3.2.1 Value chain Analysis
  37.     3.2.2 Porter's Five Forces Analysis
  38.       3.2.2.1 Bargaining Power of Suppliers
  39.       3.2.2.2 Bargaining Power of Buyers
  40.       3.2.2.3 Threat of New Entrants
  41.       3.2.2.4 Threat of Substitutes
  42.       3.2.2.5 Intensity of Rivalry
  43.     3.2.3 COVID-19 Impact Analysis
  44.       3.2.3.1 Market Impact Analysis
  45.       3.2.3.2 Regional Impact
  46.       3.2.3.3 Opportunity and Threat Analysis
  47. 4 SECTION IV: QUANTITATIVE ANALYSIS
  48.   4.1 Construction, BY Type (USD Million)
  49.     4.1.1 Abortive Drugs
  50.     4.1.2 Preventive Drugs
  51.     4.1.3 CGRP Inhibitors
  52.     4.1.4 Triptans
  53.   4.2 Construction, BY Route of Administration (USD Million)
  54.     4.2.1 Oral
  55.     4.2.2 Injectable
  56.     4.2.3 Nasal
  57.   4.3 Construction, BY Therapeutic Class (USD Million)
  58.     4.3.1 NSAIDs
  59.     4.3.2 Ergots
  60.     4.3.3 Beta Blockers
  61.     4.3.4 Antidepressants
  62.   4.4 Construction, BY Patient Demographics (USD Million)
  63.     4.4.1 Adults
  64.     4.4.2 Children
  65.     4.4.3 Geriatrics
  66. 5 SECTION V: COMPETITIVE ANALYSIS
  67.   5.1 Competitive Landscape
  68.     5.1.1 Overview
  69.     5.1.2 Competitive Analysis
  70.     5.1.3 Market share Analysis
  71.     5.1.4 Major Growth Strategy in the Construction
  72.     5.1.5 Competitive Benchmarking
  73.     5.1.6 Leading Players in Terms of Number of Developments in the Construction
  74.     5.1.7 Key developments and growth strategies
  75.       5.1.7.1 New Product Launch/Service Deployment
  76.       5.1.7.2 Merger & Acquisitions
  77.       5.1.7.3 Joint Ventures
  78.     5.1.8 Major Players Financial Matrix
  79.       5.1.8.1 Sales and Operating Income
  80.       5.1.8.2 Major Players R&D Expenditure. 2023
  81.   5.2 Company Profiles
  82.     5.2.1 AbbVie Inc (US)
  83.       5.2.1.1 Financial Overview
  84.       5.2.1.2 Products Offered
  85.       5.2.1.3 Key Developments
  86.       5.2.1.4 SWOT Analysis
  87.       5.2.1.5 Key Strategies
  88.     5.2.2 Amgen Inc (US)
  89.       5.2.2.1 Financial Overview
  90.       5.2.2.2 Products Offered
  91.       5.2.2.3 Key Developments
  92.       5.2.2.4 SWOT Analysis
  93.       5.2.2.5 Key Strategies
  94.     5.2.3 Eli Lilly and Company (US)
  95.       5.2.3.1 Financial Overview
  96.       5.2.3.2 Products Offered
  97.       5.2.3.3 Key Developments
  98.       5.2.3.4 SWOT Analysis
  99.       5.2.3.5 Key Strategies
  100.     5.2.4 Teva Pharmaceutical Industries Ltd (IL)
  101.       5.2.4.1 Financial Overview
  102.       5.2.4.2 Products Offered
  103.       5.2.4.3 Key Developments
  104.       5.2.4.4 SWOT Analysis
  105.       5.2.4.5 Key Strategies
  106.     5.2.5 Pfizer Inc (US)
  107.       5.2.5.1 Financial Overview
  108.       5.2.5.2 Products Offered
  109.       5.2.5.3 Key Developments
  110.       5.2.5.4 SWOT Analysis
  111.       5.2.5.5 Key Strategies
  112.     5.2.6 Boehringer Ingelheim GmbH (DE)
  113.       5.2.6.1 Financial Overview
  114.       5.2.6.2 Products Offered
  115.       5.2.6.3 Key Developments
  116.       5.2.6.4 SWOT Analysis
  117.       5.2.6.5 Key Strategies
  118.     5.2.7 AstraZeneca PLC (GB)
  119.       5.2.7.1 Financial Overview
  120.       5.2.7.2 Products Offered
  121.       5.2.7.3 Key Developments
  122.       5.2.7.4 SWOT Analysis
  123.       5.2.7.5 Key Strategies
  124.     5.2.8 Novartis AG (CH)
  125.       5.2.8.1 Financial Overview
  126.       5.2.8.2 Products Offered
  127.       5.2.8.3 Key Developments
  128.       5.2.8.4 SWOT Analysis
  129.       5.2.8.5 Key Strategies
  130.     5.2.9 GlaxoSmithKline PLC (GB)
  131.       5.2.9.1 Financial Overview
  132.       5.2.9.2 Products Offered
  133.       5.2.9.3 Key Developments
  134.       5.2.9.4 SWOT Analysis
  135.       5.2.9.5 Key Strategies
  136.   5.3 Appendix
  137.     5.3.1 References
  138.     5.3.2 Related Reports
  139. 6 LIST OF FIGURES
  140.   6.1 MARKET SYNOPSIS
  141.   6.2 US MARKET ANALYSIS BY TYPE
  142.   6.3 US MARKET ANALYSIS BY ROUTE OF ADMINISTRATION
  143.   6.4 US MARKET ANALYSIS BY THERAPEUTIC CLASS
  144.   6.5 US MARKET ANALYSIS BY PATIENT DEMOGRAPHICS
  145.   6.6 KEY BUYING CRITERIA OF CONSTRUCTION
  146.   6.7 RESEARCH PROCESS OF MRFR
  147.   6.8 DRO ANALYSIS OF CONSTRUCTION
  148.   6.9 DRIVERS IMPACT ANALYSIS: CONSTRUCTION
  149.   6.10 RESTRAINTS IMPACT ANALYSIS: CONSTRUCTION
  150.   6.11 SUPPLY / VALUE CHAIN: CONSTRUCTION
  151.   6.12 CONSTRUCTION, BY TYPE, 2024 (% SHARE)
  152.   6.13 CONSTRUCTION, BY TYPE, 2024 TO 2035 (USD Million)
  153.   6.14 CONSTRUCTION, BY ROUTE OF ADMINISTRATION, 2024 (% SHARE)
  154.   6.15 CONSTRUCTION, BY ROUTE OF ADMINISTRATION, 2024 TO 2035 (USD Million)
  155.   6.16 CONSTRUCTION, BY THERAPEUTIC CLASS, 2024 (% SHARE)
  156.   6.17 CONSTRUCTION, BY THERAPEUTIC CLASS, 2024 TO 2035 (USD Million)
  157.   6.18 CONSTRUCTION, BY PATIENT DEMOGRAPHICS, 2024 (% SHARE)
  158.   6.19 CONSTRUCTION, BY PATIENT DEMOGRAPHICS, 2024 TO 2035 (USD Million)
  159.   6.20 BENCHMARKING OF MAJOR COMPETITORS
  160. 7 LIST OF TABLES
  161.   7.1 LIST OF ASSUMPTIONS
  162.     7.1.1
  163.   7.2 US MARKET SIZE ESTIMATES; FORECAST
  164.     7.2.1 BY TYPE, 2025-2035 (USD Million)
  165.     7.2.2 BY ROUTE OF ADMINISTRATION, 2025-2035 (USD Million)
  166.     7.2.3 BY THERAPEUTIC CLASS, 2025-2035 (USD Million)
  167.     7.2.4 BY PATIENT DEMOGRAPHICS, 2025-2035 (USD Million)
  168.   7.3 PRODUCT LAUNCH/PRODUCT DEVELOPMENT/APPROVAL
  169.     7.3.1
  170.   7.4 ACQUISITION/PARTNERSHIP
  171.     7.4.1

US Construction Market Segmentation

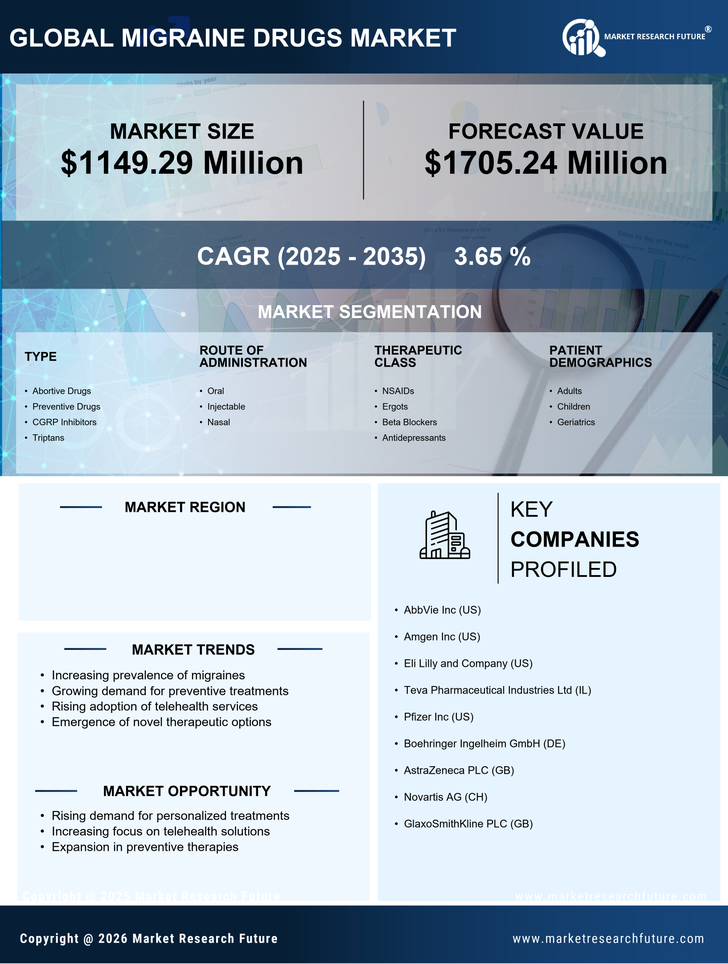
Construction By Type (USD Million, 2025-2035)

  • Abortive Drugs
  • Preventive Drugs
  • CGRP Inhibitors
  • Triptans

Construction By Route of Administration (USD Million, 2025-2035)

  • Oral
  • Injectable
  • Nasal

Construction By Therapeutic Class (USD Million, 2025-2035)

  • NSAIDs
  • Ergots
  • Beta Blockers
  • Antidepressants

Construction By Patient Demographics (USD Million, 2025-2035)

  • Adults
  • Children
  • Geriatrics

Compare Licence

×
Features License Type
Single User Multiuser License Enterprise User
Price $4,950 $5,950 $7,250
Maximum User Access Limit 1 User Upto 10 Users Unrestricted Access Throughout the Organization
Free Customization
Direct Access to Analyst
Deliverable Format
Platform Access
Discount on Next Purchase 10% 15% 15%
Printable Versions