Request Free Sample ×

Kindly complete the form below to receive a free sample of this Report

* Please use a valid business email

Leading companies partner with us for data-driven Insights

clients tt-cursor
Hero Background

US Marine Engine Market

ID: MRFR/EnP/14764-HCR
100 Pages
Garvit Vyas
Last Updated: April 06, 2026

US Marine Engine Market Research Report By Fuel (Diesel, Gas, Others), By Type (Auxiliary, Propulsion), By Speed (Low-Speed, Medium-Speed, High-Speed), By Stroke (2-Stroke, 4-Stroke), By Application (Cargo Ship, Cruise Ship, Others), By Power Rating (Upto 1000 kW, 1000-4000 kW, Above 4000 kW) - Forecast to 2035

Share:
Download PDF ×

We do not share your information with anyone. However, we may send you emails based on your report interest from time to time. You may contact us at any time to opt-out.

US Marine Engine Market Infographic
Purchase Options
  1. 1 SECTION I: EXECUTIVE SUMMARY AND KEY HIGHLIGHTS
  2.   1.1 EXECUTIVE SUMMARY
  3.     1.1.1 Market Overview
  4.     1.1.2 Key Findings
  5.     1.1.3 Market Segmentation
  6.     1.1.4 Competitive Landscape
  7.     1.1.5 Challenges and Opportunities
  8.     1.1.6 Future Outlook
  9. 2 SECTION II: SCOPING, METHODOLOGY AND MARKET STRUCTURE
  10.   2.1 MARKET INTRODUCTION
  11.     2.1.1 Definition
  12.     2.1.2 Scope of the study
  13.       2.1.2.1 Research Objective
  14.       2.1.2.2 Assumption
  15.       2.1.2.3 Limitations
  16.   2.2 RESEARCH METHODOLOGY
  17.     2.2.1 Overview
  18.     2.2.2 Data Mining
  19.     2.2.3 Secondary Research
  20.     2.2.4 Primary Research
  21.       2.2.4.1 Primary Interviews and Information Gathering Process
  22.       2.2.4.2 Breakdown of Primary Respondents
  23.     2.2.5 Forecasting Model
  24.     2.2.6 Market Size Estimation
  25.       2.2.6.1 Bottom-Up Approach
  26.       2.2.6.2 Top-Down Approach
  27.     2.2.7 Data Triangulation
  28.     2.2.8 Validation
  29. 3 SECTION III: QUALITATIVE ANALYSIS
  30.   3.1 MARKET DYNAMICS
  31.     3.1.1 Overview
  32.     3.1.2 Drivers
  33.     3.1.3 Restraints
  34.     3.1.4 Opportunities
  35.   3.2 MARKET FACTOR ANALYSIS
  36.     3.2.1 Value chain Analysis
  37.     3.2.2 Porter's Five Forces Analysis
  38.       3.2.2.1 Bargaining Power of Suppliers
  39.       3.2.2.2 Bargaining Power of Buyers
  40.       3.2.2.3 Threat of New Entrants
  41.       3.2.2.4 Threat of Substitutes
  42.       3.2.2.5 Intensity of Rivalry
  43.     3.2.3 COVID-19 Impact Analysis
  44.       3.2.3.1 Market Impact Analysis
  45.       3.2.3.2 Regional Impact
  46.       3.2.3.3 Opportunity and Threat Analysis
  47. 4 SECTION IV: QUANTITATIVE ANALYSIS
  48.   4.1 Life Sciences, BY Fuel (USD Million)
  49.     4.1.1 Diesel
  50.     4.1.2 Gas
  51.     4.1.3 Others
  52.   4.2 Life Sciences, BY Power Rating (USD Million)
  53.     4.2.1 Upto 1000 kW
  54.     4.2.2 1000-4000 kW
  55.     4.2.3 Above 4000 kW
  56.   4.3 Life Sciences, BY Type (USD Million)
  57.     4.3.1 Auxiliary
  58.     4.3.2 Propulsion
  59.   4.4 Life Sciences, BY Speed (USD Million)
  60.     4.4.1 Low-Speed
  61.     4.4.2 Medium-Speed
  62.     4.4.3 High-Speed
  63.   4.5 Life Sciences, BY Stroke (USD Million)
  64.     4.5.1 2-Stroke
  65.     4.5.2 4-Stroke
  66.   4.6 Life Sciences, BY Application (USD Million)
  67.     4.6.1 Cargo Ship
  68.     4.6.2 Cruise Ship
  69.     4.6.3 Others
  70. 5 SECTION V: COMPETITIVE ANALYSIS
  71.   5.1 Competitive Landscape
  72.     5.1.1 Overview
  73.     5.1.2 Competitive Analysis
  74.     5.1.3 Market share Analysis
  75.     5.1.4 Major Growth Strategy in the Life Sciences
  76.     5.1.5 Competitive Benchmarking
  77.     5.1.6 Leading Players in Terms of Number of Developments in the Life Sciences
  78.     5.1.7 Key developments and growth strategies
  79.       5.1.7.1 New Product Launch/Service Deployment
  80.       5.1.7.2 Merger & Acquisitions
  81.       5.1.7.3 Joint Ventures
  82.     5.1.8 Major Players Financial Matrix
  83.       5.1.8.1 Sales and Operating Income
  84.       5.1.8.2 Major Players R&D Expenditure. 2023
  85.   5.2 Company Profiles
  86.     5.2.1 Caterpillar Inc (US)
  87.       5.2.1.1 Financial Overview
  88.       5.2.1.2 Products Offered
  89.       5.2.1.3 Key Developments
  90.       5.2.1.4 SWOT Analysis
  91.       5.2.1.5 Key Strategies
  92.     5.2.2 Rolls-Royce Holdings plc (GB)
  93.       5.2.2.1 Financial Overview
  94.       5.2.2.2 Products Offered
  95.       5.2.2.3 Key Developments
  96.       5.2.2.4 SWOT Analysis
  97.       5.2.2.5 Key Strategies
  98.     5.2.3 Wärtsilä Corporation (FI)
  99.       5.2.3.1 Financial Overview
  100.       5.2.3.2 Products Offered
  101.       5.2.3.3 Key Developments
  102.       5.2.3.4 SWOT Analysis
  103.       5.2.3.5 Key Strategies
  104.     5.2.4 MAN Energy Solutions SE (DE)
  105.       5.2.4.1 Financial Overview
  106.       5.2.4.2 Products Offered
  107.       5.2.4.3 Key Developments
  108.       5.2.4.4 SWOT Analysis
  109.       5.2.4.5 Key Strategies
  110.     5.2.5 General Electric Company (US)
  111.       5.2.5.1 Financial Overview
  112.       5.2.5.2 Products Offered
  113.       5.2.5.3 Key Developments
  114.       5.2.5.4 SWOT Analysis
  115.       5.2.5.5 Key Strategies
  116.     5.2.6 Cummins Inc (US)
  117.       5.2.6.1 Financial Overview
  118.       5.2.6.2 Products Offered
  119.       5.2.6.3 Key Developments
  120.       5.2.6.4 SWOT Analysis
  121.       5.2.6.5 Key Strategies
  122.     5.2.7 Yanmar Holdings Co Ltd (JP)
  123.       5.2.7.1 Financial Overview
  124.       5.2.7.2 Products Offered
  125.       5.2.7.3 Key Developments
  126.       5.2.7.4 SWOT Analysis
  127.       5.2.7.5 Key Strategies
  128.     5.2.8 Honda Motor Co Ltd (JP)
  129.       5.2.8.1 Financial Overview
  130.       5.2.8.2 Products Offered
  131.       5.2.8.3 Key Developments
  132.       5.2.8.4 SWOT Analysis
  133.       5.2.8.5 Key Strategies
  134.     5.2.9 Kawasaki Heavy Industries Ltd (JP)
  135.       5.2.9.1 Financial Overview
  136.       5.2.9.2 Products Offered
  137.       5.2.9.3 Key Developments
  138.       5.2.9.4 SWOT Analysis
  139.       5.2.9.5 Key Strategies
  140.   5.3 Appendix
  141.     5.3.1 References
  142.     5.3.2 Related Reports
  143. 6 LIST OF FIGURES
  144.   6.1 MARKET SYNOPSIS
  145.   6.2 US MARKET ANALYSIS BY FUEL
  146.   6.3 US MARKET ANALYSIS BY POWER RATING
  147.   6.4 US MARKET ANALYSIS BY TYPE
  148.   6.5 US MARKET ANALYSIS BY SPEED
  149.   6.6 US MARKET ANALYSIS BY STROKE
  150.   6.7 US MARKET ANALYSIS BY APPLICATION
  151.   6.8 KEY BUYING CRITERIA OF LIFE SCIENCES
  152.   6.9 RESEARCH PROCESS OF MRFR
  153.   6.10 DRO ANALYSIS OF LIFE SCIENCES
  154.   6.11 DRIVERS IMPACT ANALYSIS: LIFE SCIENCES
  155.   6.12 RESTRAINTS IMPACT ANALYSIS: LIFE SCIENCES
  156.   6.13 SUPPLY / VALUE CHAIN: LIFE SCIENCES
  157.   6.14 LIFE SCIENCES, BY FUEL, 2024 (% SHARE)
  158.   6.15 LIFE SCIENCES, BY FUEL, 2024 TO 2035 (USD Million)
  159.   6.16 LIFE SCIENCES, BY POWER RATING, 2024 (% SHARE)
  160.   6.17 LIFE SCIENCES, BY POWER RATING, 2024 TO 2035 (USD Million)
  161.   6.18 LIFE SCIENCES, BY TYPE, 2024 (% SHARE)
  162.   6.19 LIFE SCIENCES, BY TYPE, 2024 TO 2035 (USD Million)
  163.   6.20 LIFE SCIENCES, BY SPEED, 2024 (% SHARE)
  164.   6.21 LIFE SCIENCES, BY SPEED, 2024 TO 2035 (USD Million)
  165.   6.22 LIFE SCIENCES, BY STROKE, 2024 (% SHARE)
  166.   6.23 LIFE SCIENCES, BY STROKE, 2024 TO 2035 (USD Million)
  167.   6.24 LIFE SCIENCES, BY APPLICATION, 2024 (% SHARE)
  168.   6.25 LIFE SCIENCES, BY APPLICATION, 2024 TO 2035 (USD Million)
  169.   6.26 BENCHMARKING OF MAJOR COMPETITORS
  170. 7 LIST OF TABLES
  171.   7.1 LIST OF ASSUMPTIONS
  172.     7.1.1
  173.   7.2 US MARKET SIZE ESTIMATES; FORECAST
  174.     7.2.1 BY FUEL, 2025-2035 (USD Million)
  175.     7.2.2 BY POWER RATING, 2025-2035 (USD Million)
  176.     7.2.3 BY TYPE, 2025-2035 (USD Million)
  177.     7.2.4 BY SPEED, 2025-2035 (USD Million)
  178.     7.2.5 BY STROKE, 2025-2035 (USD Million)
  179.     7.2.6 BY APPLICATION, 2025-2035 (USD Million)
  180.   7.3 PRODUCT LAUNCH/PRODUCT DEVELOPMENT/APPROVAL
  181.     7.3.1
  182.   7.4 ACQUISITION/PARTNERSHIP
  183.     7.4.1

US Life Sciences Market Segmentation

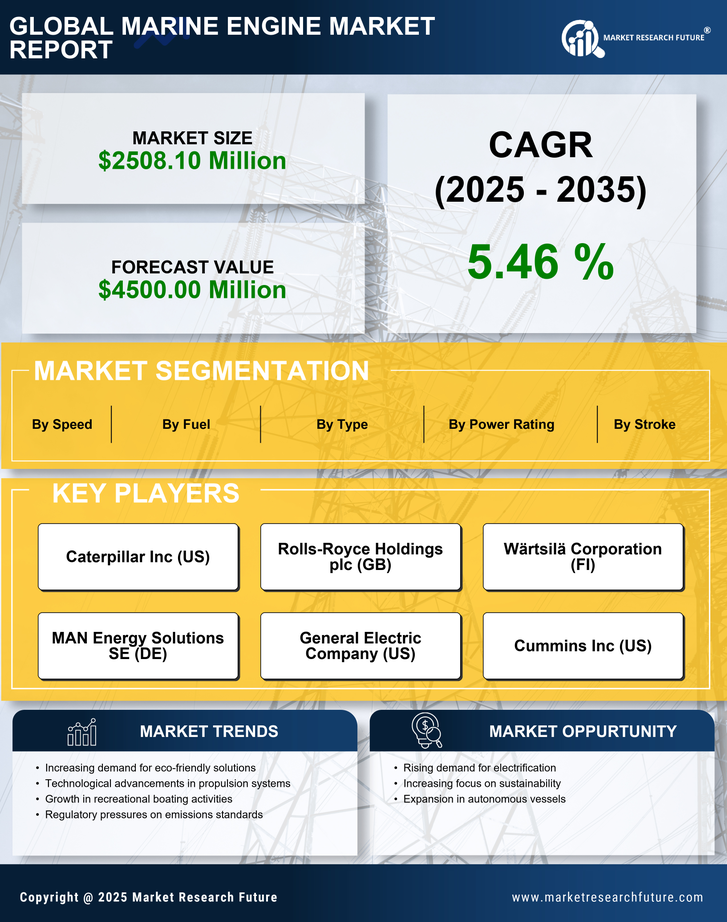
Life Sciences By Fuel (USD Million, 2025-2035)

  • Diesel
  • Gas
  • Others

Life Sciences By Power Rating (USD Million, 2025-2035)

  • Upto 1000 kW
  • 1000-4000 kW
  • Above 4000 kW

Life Sciences By Type (USD Million, 2025-2035)

  • Auxiliary
  • Propulsion

Life Sciences By Speed (USD Million, 2025-2035)

  • Low-Speed
  • Medium-Speed
  • High-Speed

Life Sciences By Stroke (USD Million, 2025-2035)

  • 2-Stroke
  • 4-Stroke

Life Sciences By Application (USD Million, 2025-2035)

  • Cargo Ship
  • Cruise Ship
  • Others

Compare Licence

×
Features License Type
Single User Multiuser License Enterprise User
Price $4,950 $5,950 $7,250
Maximum User Access Limit 1 User Upto 10 Users Unrestricted Access Throughout the Organization
Free Customization
Direct Access to Analyst
Deliverable Format
Platform Access
Discount on Next Purchase 10% 15% 15%
Printable Versions