Request Free Sample ×

Kindly complete the form below to receive a free sample of this Report

* Please use a valid business email

Leading companies partner with us for data-driven Insights

clients tt-cursor
Hero Background

US Maple Syrup Market

ID: MRFR/FnB/15635-HCR
128 Pages
Snehal Singh
Last Updated: April 06, 2026

US Maple Syrup Market Size, Share, Industry Trend & Analysis Research Report: By Product Type (Grade A, Grade B, Organic Maple Syrup, Flavored Maple Syrup), By Packaging Type (Glass Bottles, Plastic Containers, Maple Syrup Cans, Bulk Packaging), By Sales Channel (Supermarkets, Online Retail, Specialty Stores, Food Service) andBy End Use (Household, Food Industry, Beverage Industry)- Forecast to 2035

Share:
Download PDF ×

We do not share your information with anyone. However, we may send you emails based on your report interest from time to time. You may contact us at any time to opt-out.

US Maple Syrup Market Infographic
Purchase Options
  1. 1 SECTION I: EXECUTIVE SUMMARY AND KEY HIGHLIGHTS
  2.   1.1 EXECUTIVE SUMMARY
  3.     1.1.1 Market Overview
  4.     1.1.2 Key Findings
  5.     1.1.3 Market Segmentation
  6.     1.1.4 Competitive Landscape
  7.     1.1.5 Challenges and Opportunities
  8.     1.1.6 Future Outlook
  9. 2 SECTION II: SCOPING, METHODOLOGY AND MARKET STRUCTURE
  10.   2.1 MARKET INTRODUCTION
  11.     2.1.1 Definition
  12.     2.1.2 Scope of the study
  13.       2.1.2.1 Research Objective
  14.       2.1.2.2 Assumption
  15.       2.1.2.3 Limitations
  16.   2.2 RESEARCH METHODOLOGY
  17.     2.2.1 Overview
  18.     2.2.2 Data Mining
  19.     2.2.3 Secondary Research
  20.     2.2.4 Primary Research
  21.       2.2.4.1 Primary Interviews and Information Gathering Process
  22.       2.2.4.2 Breakdown of Primary Respondents
  23.     2.2.5 Forecasting Model
  24.     2.2.6 Market Size Estimation
  25.       2.2.6.1 Bottom-Up Approach
  26.       2.2.6.2 Top-Down Approach
  27.     2.2.7 Data Triangulation
  28.     2.2.8 Validation
  29. 3 SECTION III: QUALITATIVE ANALYSIS
  30.   3.1 MARKET DYNAMICS
  31.     3.1.1 Overview
  32.     3.1.2 Drivers
  33.     3.1.3 Restraints
  34.     3.1.4 Opportunities
  35.   3.2 MARKET FACTOR ANALYSIS
  36.     3.2.1 Value chain Analysis
  37.     3.2.2 Porter's Five Forces Analysis
  38.       3.2.2.1 Bargaining Power of Suppliers
  39.       3.2.2.2 Bargaining Power of Buyers
  40.       3.2.2.3 Threat of New Entrants
  41.       3.2.2.4 Threat of Substitutes
  42.       3.2.2.5 Intensity of Rivalry
  43.     3.2.3 COVID-19 Impact Analysis
  44.       3.2.3.1 Market Impact Analysis
  45.       3.2.3.2 Regional Impact
  46.       3.2.3.3 Opportunity and Threat Analysis
  47. 4 SECTION IV: QUANTITATIVE ANALYSIS
  48.   4.1 Security, Access Control and Robotics, BY Type (USD Million)
  49.     4.1.1 Grade A
  50.     4.1.2 Grade B
  51.     4.1.3 Organic Maple Syrup
  52.     4.1.4 Flavored Maple Syrup
  53.   4.2 Security, Access Control and Robotics, BY Packaging Type (USD Million)
  54.     4.2.1 Glass Bottles
  55.     4.2.2 Plastic Containers
  56.     4.2.3 Maple Syrup Cans
  57.     4.2.4 Bulk Packaging
  58.   4.3 Security, Access Control and Robotics, BY Sales Channel (USD Million)
  59.     4.3.1 Supermarkets
  60.     4.3.2 Online Retail
  61.     4.3.3 Specialty Stores
  62.     4.3.4 Food Service
  63.   4.4 Security, Access Control and Robotics, BY End Use (USD Million)
  64.     4.4.1 Household
  65.     4.4.2 Food Industry
  66.     4.4.3 Beverage Industry
  67. 5 SECTION V: COMPETITIVE ANALYSIS
  68.   5.1 Competitive Landscape
  69.     5.1.1 Overview
  70.     5.1.2 Competitive Analysis
  71.     5.1.3 Market share Analysis
  72.     5.1.4 Major Growth Strategy in the Security, Access Control and Robotics
  73.     5.1.5 Competitive Benchmarking
  74.     5.1.6 Leading Players in Terms of Number of Developments in the Security, Access Control and Robotics
  75.     5.1.7 Key developments and growth strategies
  76.       5.1.7.1 New Product Launch/Service Deployment
  77.       5.1.7.2 Merger & Acquisitions
  78.       5.1.7.3 Joint Ventures
  79.     5.1.8 Major Players Financial Matrix
  80.       5.1.8.1 Sales and Operating Income
  81.       5.1.8.2 Major Players R&D Expenditure. 2023
  82.   5.2 Company Profiles
  83.     5.2.1 Maple Grove Farms (US)
  84.       5.2.1.1 Financial Overview
  85.       5.2.1.2 Products Offered
  86.       5.2.1.3 Key Developments
  87.       5.2.1.4 SWOT Analysis
  88.       5.2.1.5 Key Strategies
  89.     5.2.2 Butternut Mountain Farm (US)
  90.       5.2.2.1 Financial Overview
  91.       5.2.2.2 Products Offered
  92.       5.2.2.3 Key Developments
  93.       5.2.2.4 SWOT Analysis
  94.       5.2.2.5 Key Strategies
  95.     5.2.3 Crown Maple (US)
  96.       5.2.3.1 Financial Overview
  97.       5.2.3.2 Products Offered
  98.       5.2.3.3 Key Developments
  99.       5.2.3.4 SWOT Analysis
  100.       5.2.3.5 Key Strategies
  101.     5.2.4 Vermont Maple Sugar Makers Association (US)
  102.       5.2.4.1 Financial Overview
  103.       5.2.4.2 Products Offered
  104.       5.2.4.3 Key Developments
  105.       5.2.4.4 SWOT Analysis
  106.       5.2.4.5 Key Strategies
  107.     5.2.5 Maple Valley Cooperative (US)
  108.       5.2.5.1 Financial Overview
  109.       5.2.5.2 Products Offered
  110.       5.2.5.3 Key Developments
  111.       5.2.5.4 SWOT Analysis
  112.       5.2.5.5 Key Strategies
  113.     5.2.6 Syrup of Vermont (US)
  114.       5.2.6.1 Financial Overview
  115.       5.2.6.2 Products Offered
  116.       5.2.6.3 Key Developments
  117.       5.2.6.4 SWOT Analysis
  118.       5.2.6.5 Key Strategies
  119.     5.2.7 New England Maple Syrup (US)
  120.       5.2.7.1 Financial Overview
  121.       5.2.7.2 Products Offered
  122.       5.2.7.3 Key Developments
  123.       5.2.7.4 SWOT Analysis
  124.       5.2.7.5 Key Strategies
  125.     5.2.8 Quebec Maple Syrup Producers (CA)
  126.       5.2.8.1 Financial Overview
  127.       5.2.8.2 Products Offered
  128.       5.2.8.3 Key Developments
  129.       5.2.8.4 SWOT Analysis
  130.       5.2.8.5 Key Strategies
  131.   5.3 Appendix
  132.     5.3.1 References
  133.     5.3.2 Related Reports
  134. 6 LIST OF FIGURES
  135.   6.1 MARKET SYNOPSIS
  136.   6.2 US MARKET ANALYSIS BY TYPE
  137.   6.3 US MARKET ANALYSIS BY PACKAGING TYPE
  138.   6.4 US MARKET ANALYSIS BY SALES CHANNEL
  139.   6.5 US MARKET ANALYSIS BY END USE
  140.   6.6 KEY BUYING CRITERIA OF SECURITY, ACCESS CONTROL AND ROBOTICS
  141.   6.7 RESEARCH PROCESS OF MRFR
  142.   6.8 DRO ANALYSIS OF SECURITY, ACCESS CONTROL AND ROBOTICS
  143.   6.9 DRIVERS IMPACT ANALYSIS: SECURITY, ACCESS CONTROL AND ROBOTICS
  144.   6.10 RESTRAINTS IMPACT ANALYSIS: SECURITY, ACCESS CONTROL AND ROBOTICS
  145.   6.11 SUPPLY / VALUE CHAIN: SECURITY, ACCESS CONTROL AND ROBOTICS
  146.   6.12 SECURITY, ACCESS CONTROL AND ROBOTICS, BY TYPE, 2024 (% SHARE)
  147.   6.13 SECURITY, ACCESS CONTROL AND ROBOTICS, BY TYPE, 2024 TO 2035 (USD Million)
  148.   6.14 SECURITY, ACCESS CONTROL AND ROBOTICS, BY PACKAGING TYPE, 2024 (% SHARE)
  149.   6.15 SECURITY, ACCESS CONTROL AND ROBOTICS, BY PACKAGING TYPE, 2024 TO 2035 (USD Million)
  150.   6.16 SECURITY, ACCESS CONTROL AND ROBOTICS, BY SALES CHANNEL, 2024 (% SHARE)
  151.   6.17 SECURITY, ACCESS CONTROL AND ROBOTICS, BY SALES CHANNEL, 2024 TO 2035 (USD Million)
  152.   6.18 SECURITY, ACCESS CONTROL AND ROBOTICS, BY END USE, 2024 (% SHARE)
  153.   6.19 SECURITY, ACCESS CONTROL AND ROBOTICS, BY END USE, 2024 TO 2035 (USD Million)
  154.   6.20 BENCHMARKING OF MAJOR COMPETITORS
  155. 7 LIST OF TABLES
  156.   7.1 LIST OF ASSUMPTIONS
  157.     7.1.1
  158.   7.2 US MARKET SIZE ESTIMATES; FORECAST
  159.     7.2.1 BY TYPE, 2025-2035 (USD Million)
  160.     7.2.2 BY PACKAGING TYPE, 2025-2035 (USD Million)
  161.     7.2.3 BY SALES CHANNEL, 2025-2035 (USD Million)
  162.     7.2.4 BY END USE, 2025-2035 (USD Million)
  163.   7.3 PRODUCT LAUNCH/PRODUCT DEVELOPMENT/APPROVAL
  164.     7.3.1
  165.   7.4 ACQUISITION/PARTNERSHIP
  166.     7.4.1

US Security, Access Control and Robotics Market Segmentation

Security, Access Control and Robotics By Type (USD Million, 2025-2035)
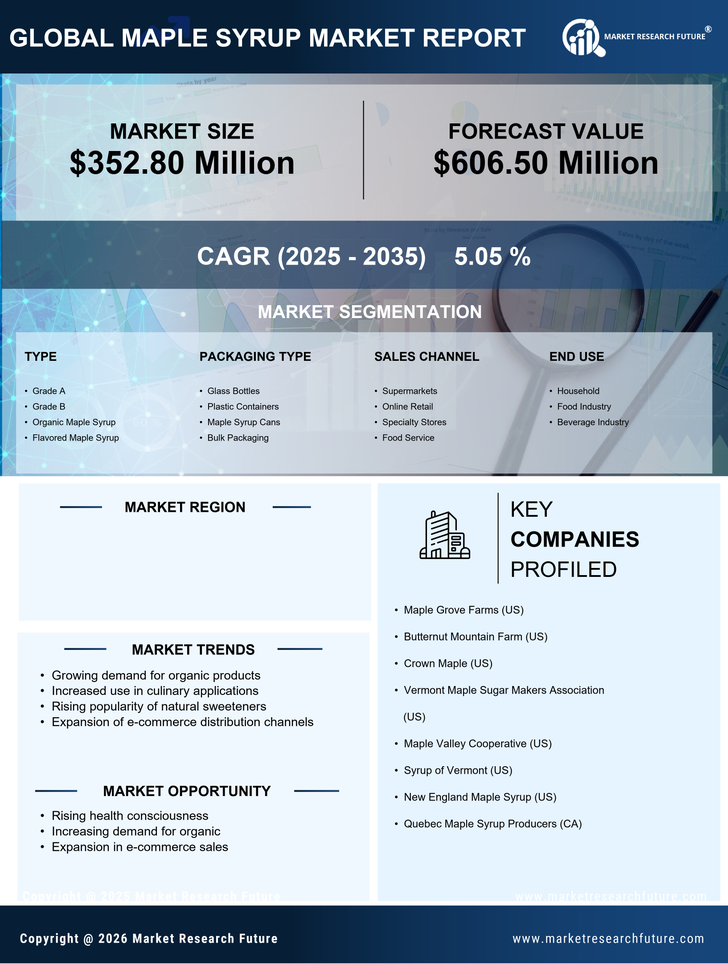
  • Grade A
  • Grade B
  • Organic Maple Syrup
  • Flavored Maple Syrup

Security, Access Control and Robotics By Packaging Type (USD Million, 2025-2035)

  • Glass Bottles
  • Plastic Containers
  • Maple Syrup Cans
  • Bulk Packaging

Security, Access Control and Robotics By Sales Channel (USD Million, 2025-2035)

  • Supermarkets
  • Online Retail
  • Specialty Stores
  • Food Service

Security, Access Control and Robotics By End Use (USD Million, 2025-2035)

  • Household
  • Food Industry
  • Beverage Industry

Compare Licence

×
Features License Type
Single User Multiuser License Enterprise User
Price $4,950 $5,950 $7,250
Maximum User Access Limit 1 User Upto 10 Users Unrestricted Access Throughout the Organization
Free Customization
Direct Access to Analyst
Deliverable Format
Platform Access
Discount on Next Purchase 10% 15% 15%
Printable Versions