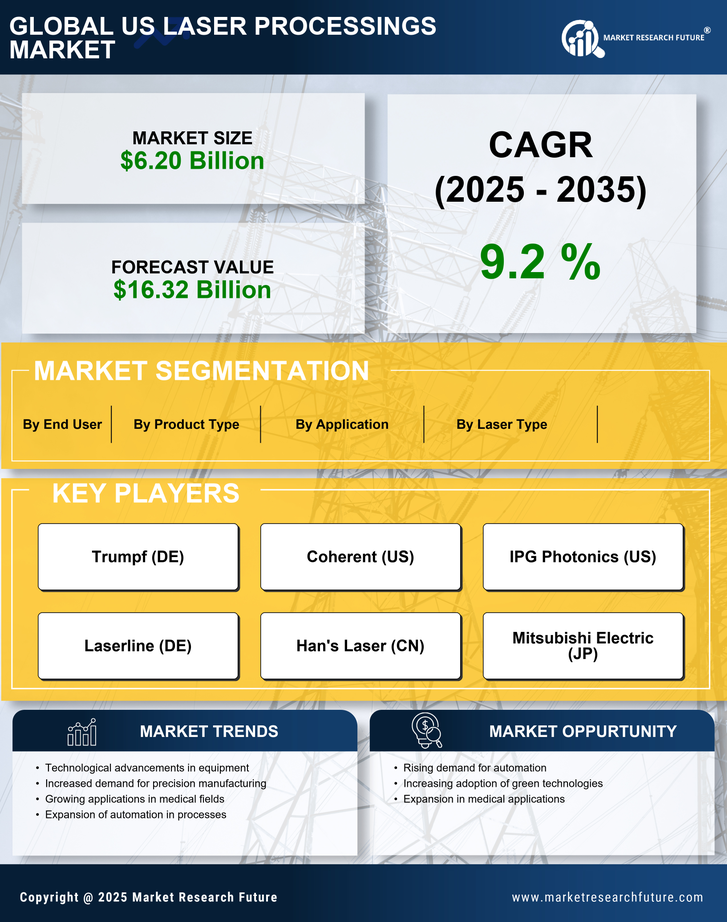
US Laser Processings Market
ID: MRFR/SEM/17135-HCR
200 Pages
Ankit Gupta
Last Updated: April 06, 2026
US Laser Processing Market Size, Share and Research Report: By Type (Gas Lasers, Solid State Lasers, Fiber lasers, Others), By Laser Type (Fixed Beam, Moving Beam, Hybrid Beam), By Application (Cutting, Making, Welding, Drilling, Engraving, Additive Manufacturing, Others) and By End User (Automotive, Manufacturing, Semiconductor & Electronics, Medical & life Sciences, Packaging, Oil & gas, Others) - Industry Forecast Till 2035