US Information and Communications Technology Market Segmentation
Information and Communications Technology By Technology (USD Million, 2025-2035)
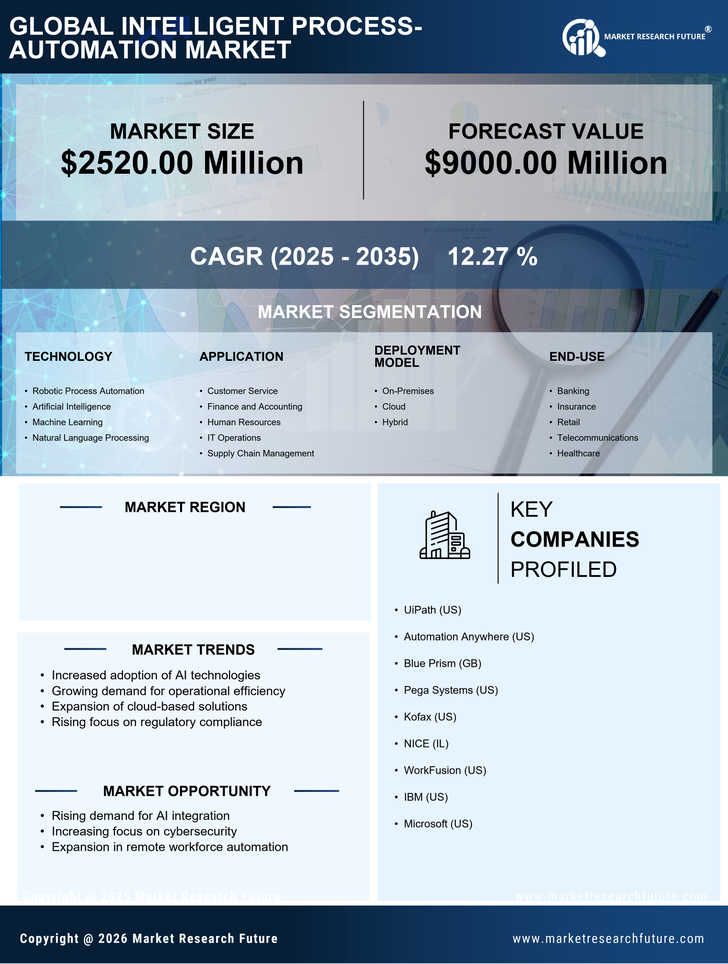
- Robotic Process Automation
- Artificial Intelligence
- Machine Learning
- Natural Language Processing
Information and Communications Technology By Application (USD Million, 2025-2035)
- Customer Service
- Finance and Accounting
- Human Resources
- IT Operations
- Supply Chain Management
Information and Communications Technology By Deployment Model (USD Million, 2025-2035)
- On-Premises
- Cloud
- Hybrid
Information and Communications Technology By End-use (USD Million, 2025-2035)
- Banking
- Insurance
- Retail
- Telecommunications
- Healthcare