Request Free Sample ×

Kindly complete the form below to receive a free sample of this Report

* Please use a valid business email

Leading companies partner with us for data-driven Insights

clients tt-cursor
Hero Background

US GRP Pipes Market

ID: MRFR/PCM/18961-HCR
111 Pages
Snehal Singh
Last Updated: April 06, 2026

US GRP Pipes Market Research Report: By Resin Type (Epoxy, Polyester, Vinyl Ester) and By End-User Type (Oil and Gas, Chemicals, Wastewater Treatment, Irrigation, Other) - Forecast to 2035

Share:
Download PDF ×

We do not share your information with anyone. However, we may send you emails based on your report interest from time to time. You may contact us at any time to opt-out.

US GRP Pipes Market Infographic
Purchase Options
  1. 1 SECTION I: EXECUTIVE SUMMARY AND KEY HIGHLIGHTS
  2.   1.1 EXECUTIVE SUMMARY
  3.     1.1.1 Market Overview
  4.     1.1.2 Key Findings
  5.     1.1.3 Market Segmentation
  6.     1.1.4 Competitive Landscape
  7.     1.1.5 Challenges and Opportunities
  8.     1.1.6 Future Outlook
  9. 2 SECTION II: SCOPING, METHODOLOGY AND MARKET STRUCTURE
  10.   2.1 MARKET INTRODUCTION
  11.     2.1.1 Definition
  12.     2.1.2 Scope of the study
  13.       2.1.2.1 Research Objective
  14.       2.1.2.2 Assumption
  15.       2.1.2.3 Limitations
  16.   2.2 RESEARCH METHODOLOGY
  17.     2.2.1 Overview
  18.     2.2.2 Data Mining
  19.     2.2.3 Secondary Research
  20.     2.2.4 Primary Research
  21.       2.2.4.1 Primary Interviews and Information Gathering Process
  22.       2.2.4.2 Breakdown of Primary Respondents
  23.     2.2.5 Forecasting Model
  24.     2.2.6 Market Size Estimation
  25.       2.2.6.1 Bottom-Up Approach
  26.       2.2.6.2 Top-Down Approach
  27.     2.2.7 Data Triangulation
  28.     2.2.8 Validation
  29. 3 SECTION III: QUALITATIVE ANALYSIS
  30.   3.1 MARKET DYNAMICS
  31.     3.1.1 Overview
  32.     3.1.2 Drivers
  33.     3.1.3 Restraints
  34.     3.1.4 Opportunities
  35.   3.2 MARKET FACTOR ANALYSIS
  36.     3.2.1 Value chain Analysis
  37.     3.2.2 Porter's Five Forces Analysis
  38.       3.2.2.1 Bargaining Power of Suppliers
  39.       3.2.2.2 Bargaining Power of Buyers
  40.       3.2.2.3 Threat of New Entrants
  41.       3.2.2.4 Threat of Substitutes
  42.       3.2.2.5 Intensity of Rivalry
  43.     3.2.3 COVID-19 Impact Analysis
  44.       3.2.3.1 Market Impact Analysis
  45.       3.2.3.2 Regional Impact
  46.       3.2.3.3 Opportunity and Threat Analysis
  47. 4 SECTION IV: QUANTITATIVE ANALYSIS
  48.   4.1 Packaging & Transport, BY Type (USD Million)
  49.     4.1.1 Pultruded GRP Pipes
  50.     4.1.2 Filament Wound GRP Pipes
  51.     4.1.3 Centrifugally Cast GRP Pipes
  52.     4.1.4 Hand Lay-up GRP Pipes
  53.     4.1.5 Other Types
  54.   4.2 Packaging & Transport, BY Manufacturing Process (USD Million)
  55.     4.2.1 Pultrusion
  56.     4.2.2 Filament Winding
  57.     4.2.3 Centrifugal Casting
  58.     4.2.4 Hand Lay-up
  59.     4.2.5 Other MP
  60.   4.3 Packaging & Transport, BY Diameter Size (USD Million)
  61.     4.3.1 Small Diameter (Up to 200 mm)
  62.     4.3.2 Medium Diameter (200-800 mm)
  63.     4.3.3 Large Diameter (Above 800 mm)
  64.   4.4 Packaging & Transport, BY Pressure Rating (USD Million)
  65.     4.4.1 Low Pressure (Up to 10 bar)
  66.     4.4.2 Medium Pressure (10-25 bar)
  67.     4.4.3 High Pressure (Above 25 bar)
  68.   4.5 Packaging & Transport, BY Resin Type (USD Million)
  69.     4.5.1 Polyester Resin
  70.     4.5.2 Epoxy Resin
  71.     4.5.3 Phenolic Resin
  72.     4.5.4 Other Resins Type
  73.     4.5.5 Vinyl Ester Resin
  74.   4.6 Packaging & Transport, BY Application (USD Million)
  75.     4.6.1 Water Wastewater
  76.     4.6.2 Oil & Gas
  77.     4.6.3 Chemical & Industrial
  78.     4.6.4 Other App
  79.   4.7 Packaging & Transport, BY End-Use Industry (USD Million)
  80.     4.7.1 Water Utilities
  81.     4.7.2 Oil & Gas
  82.     4.7.3 Chemicals & Fertilizers
  83.     4.7.4 Construction & Infrastructure
  84.     4.7.5 Marine
  85.     4.7.6 Others (Agriculture, HVAC, etc.)
  86. 5 SECTION V: COMPETITIVE ANALYSIS
  87.   5.1 Competitive Landscape
  88.     5.1.1 Overview
  89.     5.1.2 Competitive Analysis
  90.     5.1.3 Market share Analysis
  91.     5.1.4 Major Growth Strategy in the Packaging & Transport
  92.     5.1.5 Competitive Benchmarking
  93.     5.1.6 Leading Players in Terms of Number of Developments in the Packaging & Transport
  94.     5.1.7 Key developments and growth strategies
  95.       5.1.7.1 New Product Launch/Service Deployment
  96.       5.1.7.2 Merger & Acquisitions
  97.       5.1.7.3 Joint Ventures
  98.     5.1.8 Major Players Financial Matrix
  99.       5.1.8.1 Sales and Operating Income
  100.       5.1.8.2 Major Players R&D Expenditure. 2023
  101.   5.2 Company Profiles
  102.     5.2.1 Hobas (CH)
  103.       5.2.1.1 Financial Overview
  104.       5.2.1.2 Products Offered
  105.       5.2.1.3 Key Developments
  106.       5.2.1.4 SWOT Analysis
  107.       5.2.1.5 Key Strategies
  108.     5.2.2 Aqualia (ES)
  109.       5.2.2.1 Financial Overview
  110.       5.2.2.2 Products Offered
  111.       5.2.2.3 Key Developments
  112.       5.2.2.4 SWOT Analysis
  113.       5.2.2.5 Key Strategies
  114.     5.2.3 Saint-Gobain (FR)
  115.       5.2.3.1 Financial Overview
  116.       5.2.3.2 Products Offered
  117.       5.2.3.3 Key Developments
  118.       5.2.3.4 SWOT Analysis
  119.       5.2.3.5 Key Strategies
  120.     5.2.4 Enduro Composites (US)
  121.       5.2.4.1 Financial Overview
  122.       5.2.4.2 Products Offered
  123.       5.2.4.3 Key Developments
  124.       5.2.4.4 SWOT Analysis
  125.       5.2.4.5 Key Strategies
  126.     5.2.5 Fibrex (US)
  127.       5.2.5.1 Financial Overview
  128.       5.2.5.2 Products Offered
  129.       5.2.5.3 Key Developments
  130.       5.2.5.4 SWOT Analysis
  131.       5.2.5.5 Key Strategies
  132.     5.2.6 ZCL Composites (CA)
  133.       5.2.6.1 Financial Overview
  134.       5.2.6.2 Products Offered
  135.       5.2.6.3 Key Developments
  136.       5.2.6.4 SWOT Analysis
  137.       5.2.6.5 Key Strategies
  138.     5.2.7 Sika (CH)
  139.       5.2.7.1 Financial Overview
  140.       5.2.7.2 Products Offered
  141.       5.2.7.3 Key Developments
  142.       5.2.7.4 SWOT Analysis
  143.       5.2.7.5 Key Strategies
  144.     5.2.8 Pultrall (NL)
  145.       5.2.8.1 Financial Overview
  146.       5.2.8.2 Products Offered
  147.       5.2.8.3 Key Developments
  148.       5.2.8.4 SWOT Analysis
  149.       5.2.8.5 Key Strategies
  150.     5.2.9 KWH Pipe (FI)
  151.       5.2.9.1 Financial Overview
  152.       5.2.9.2 Products Offered
  153.       5.2.9.3 Key Developments
  154.       5.2.9.4 SWOT Analysis
  155.       5.2.9.5 Key Strategies
  156.   5.3 Appendix
  157.     5.3.1 References
  158.     5.3.2 Related Reports
  159. 6 LIST OF FIGURES
  160.   6.1 MARKET SYNOPSIS
  161.   6.2 US MARKET ANALYSIS BY TYPE
  162.   6.3 US MARKET ANALYSIS BY MANUFACTURING PROCESS
  163.   6.4 US MARKET ANALYSIS BY DIAMETER SIZE
  164.   6.5 US MARKET ANALYSIS BY PRESSURE RATING
  165.   6.6 US MARKET ANALYSIS BY RESIN TYPE
  166.   6.7 US MARKET ANALYSIS BY APPLICATION
  167.   6.8 US MARKET ANALYSIS BY END-USE INDUSTRY
  168.   6.9 KEY BUYING CRITERIA OF PACKAGING & TRANSPORT
  169.   6.10 RESEARCH PROCESS OF MRFR
  170.   6.11 DRO ANALYSIS OF PACKAGING & TRANSPORT
  171.   6.12 DRIVERS IMPACT ANALYSIS: PACKAGING & TRANSPORT
  172.   6.13 RESTRAINTS IMPACT ANALYSIS: PACKAGING & TRANSPORT
  173.   6.14 SUPPLY / VALUE CHAIN: PACKAGING & TRANSPORT
  174.   6.15 PACKAGING & TRANSPORT, BY TYPE, 2024 (% SHARE)
  175.   6.16 PACKAGING & TRANSPORT, BY TYPE, 2024 TO 2035 (USD Million)
  176.   6.17 PACKAGING & TRANSPORT, BY MANUFACTURING PROCESS, 2024 (% SHARE)
  177.   6.18 PACKAGING & TRANSPORT, BY MANUFACTURING PROCESS, 2024 TO 2035 (USD Million)
  178.   6.19 PACKAGING & TRANSPORT, BY DIAMETER SIZE, 2024 (% SHARE)
  179.   6.20 PACKAGING & TRANSPORT, BY DIAMETER SIZE, 2024 TO 2035 (USD Million)
  180.   6.21 PACKAGING & TRANSPORT, BY PRESSURE RATING, 2024 (% SHARE)
  181.   6.22 PACKAGING & TRANSPORT, BY PRESSURE RATING, 2024 TO 2035 (USD Million)
  182.   6.23 PACKAGING & TRANSPORT, BY RESIN TYPE, 2024 (% SHARE)
  183.   6.24 PACKAGING & TRANSPORT, BY RESIN TYPE, 2024 TO 2035 (USD Million)
  184.   6.25 PACKAGING & TRANSPORT, BY APPLICATION, 2024 (% SHARE)
  185.   6.26 PACKAGING & TRANSPORT, BY APPLICATION, 2024 TO 2035 (USD Million)
  186.   6.27 PACKAGING & TRANSPORT, BY END-USE INDUSTRY, 2024 (% SHARE)
  187.   6.28 PACKAGING & TRANSPORT, BY END-USE INDUSTRY, 2024 TO 2035 (USD Million)
  188.   6.29 BENCHMARKING OF MAJOR COMPETITORS
  189. 7 LIST OF TABLES
  190.   7.1 LIST OF ASSUMPTIONS
  191.     7.1.1
  192.   7.2 US MARKET SIZE ESTIMATES; FORECAST
  193.     7.2.1 BY TYPE, 2025-2035 (USD Million)
  194.     7.2.2 BY MANUFACTURING PROCESS, 2025-2035 (USD Million)
  195.     7.2.3 BY DIAMETER SIZE, 2025-2035 (USD Million)
  196.     7.2.4 BY PRESSURE RATING, 2025-2035 (USD Million)
  197.     7.2.5 BY RESIN TYPE, 2025-2035 (USD Million)
  198.     7.2.6 BY APPLICATION, 2025-2035 (USD Million)
  199.     7.2.7 BY END-USE INDUSTRY, 2025-2035 (USD Million)
  200.   7.3 PRODUCT LAUNCH/PRODUCT DEVELOPMENT/APPROVAL
  201.     7.3.1
  202.   7.4 ACQUISITION/PARTNERSHIP
  203.     7.4.1

US Packaging & Transport Market Segmentation

Packaging & Transport By Type (USD Million, 2025-2035)
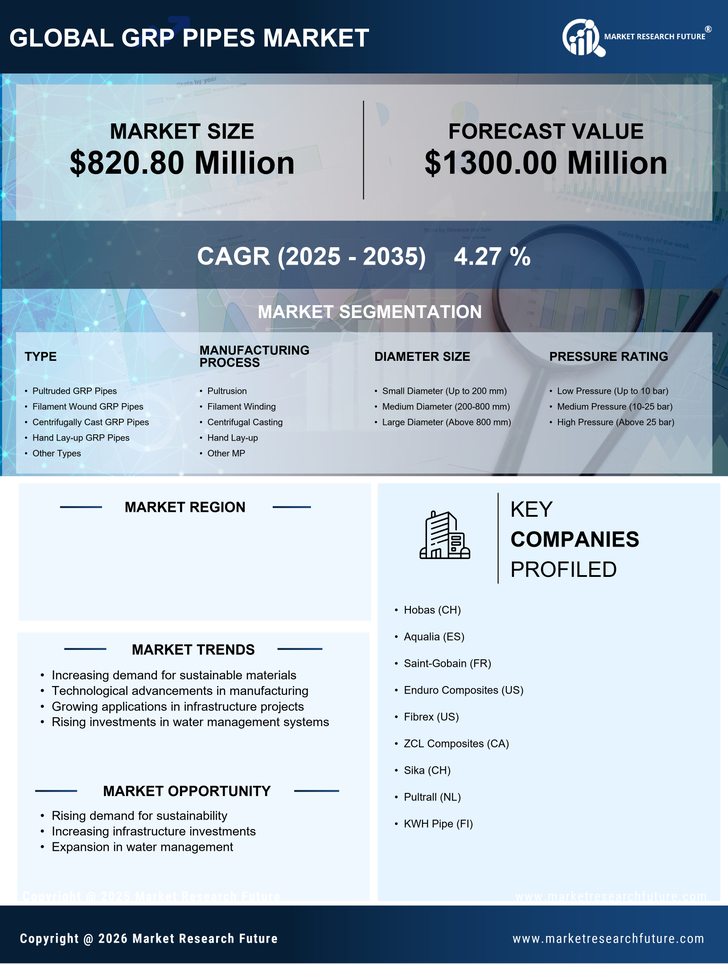
  • Pultruded GRP Pipes
  • Filament Wound GRP Pipes
  • Centrifugally Cast GRP Pipes
  • Hand Lay-up GRP Pipes
  • Other Types

Packaging & Transport By Manufacturing Process (USD Million, 2025-2035)

  • Pultrusion
  • Filament Winding
  • Centrifugal Casting
  • Hand Lay-up
  • Other MP

Packaging & Transport By Diameter Size (USD Million, 2025-2035)

  • Small Diameter (Up to 200 mm)
  • Medium Diameter (200-800 mm)
  • Large Diameter (Above 800 mm)

Packaging & Transport By Pressure Rating (USD Million, 2025-2035)

  • Low Pressure (Up to 10 bar)
  • Medium Pressure (10-25 bar)
  • High Pressure (Above 25 bar)

Packaging & Transport By Resin Type (USD Million, 2025-2035)

  • Polyester Resin
  • Epoxy Resin
  • Phenolic Resin
  • Other Resins Type
  • Vinyl Ester Resin

Packaging & Transport By Application (USD Million, 2025-2035)

  • Water Wastewater
  • Oil & Gas
  • Chemical & Industrial
  • Other App

Packaging & Transport By End-Use Industry (USD Million, 2025-2035)

  • Water Utilities
  • Oil & Gas
  • Chemicals & Fertilizers
  • Construction & Infrastructure
  • Marine
  • Others (Agriculture, HVAC, etc.)

Compare Licence

×
Features License Type
Single User Multiuser License Enterprise User
Price $4,950 $5,950 $7,250
Maximum User Access Limit 1 User Upto 10 Users Unrestricted Access Throughout the Organization
Free Customization
Direct Access to Analyst
Deliverable Format
Platform Access
Discount on Next Purchase 10% 15% 15%
Printable Versions