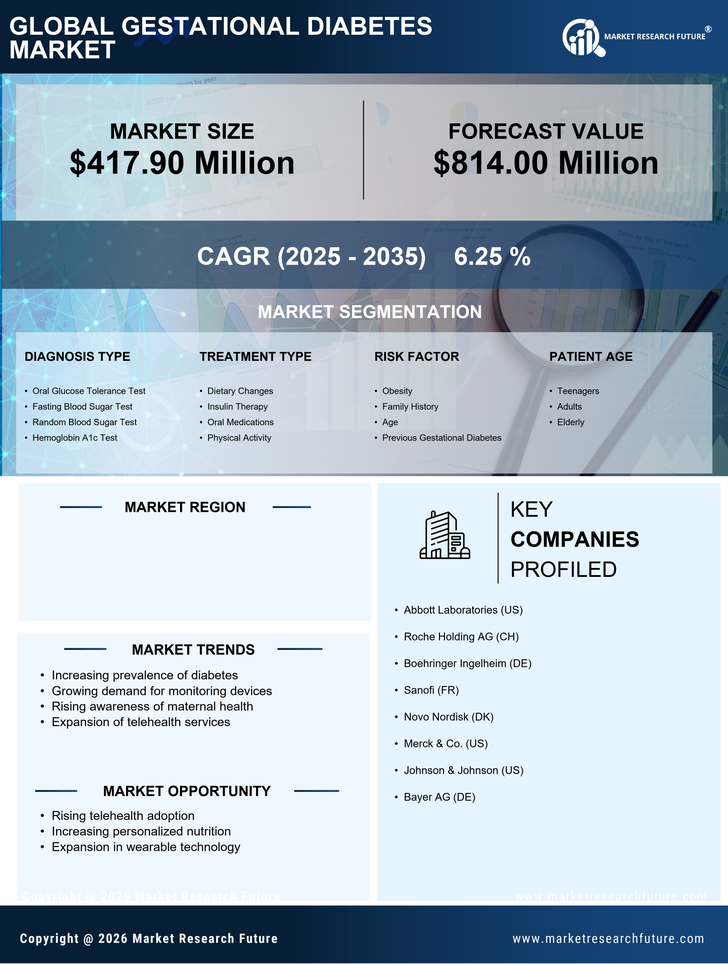
Request Free Sample ×

Kindly complete the form below to receive a free sample of this Report

* Please use a valid business email

Leading companies partner with us for data-driven Insights

clients tt-cursor
Hero Background

US Gestational Diabetes Market

ID: MRFR/Pharma/18397-HCR
100 Pages
Satyendra Maurya
Last Updated: April 06, 2026

US Gestational Diabetes Market Research Report By Diagnosis Type (Oral Glucose Tolerance Test, Fasting Blood Sugar Test, Random Blood Sugar Test, Hemoglobin A1c Test), By Treatment Type (Dietary Changes, Insulin Therapy, Oral Medications, Physical Activity), By Risk Factor (Obesity, Family History, Age, Previous Gestational Diabetes) and By Patient Age (Teenagers, Adults, Elderly) - Growth & Industry Forecast 2025 To 2035

Share:
Download PDF ×

We do not share your information with anyone. However, we may send you emails based on your report interest from time to time. You may contact us at any time to opt-out.

  1. 1 SECTION I: EXECUTIVE SUMMARY AND KEY HIGHLIGHTS
    1. 1.1 EXECUTIVE SUMMARY
      1. 1.1.1 Market Overview
      2. 1.1.2 Key Findings
      3. 1.1.3 Market Segmentation
      4. 1.1.4 Competitive Landscape
      5. 1.1.5 Challenges and Opportunities
      6. 1.1.6 Future Outlook
  2. 2 SECTION II: SCOPING, METHODOLOGY AND MARKET STRUCTURE
    1. 2.1 MARKET INTRODUCTION
      1. 2.1.1 Definition
      2. 2.1.2 Scope of the study
        1. 2.1.2.1 Research Objective
        2. 2.1.2.2 Assumption
        3. 2.1.2.3 Limitations
    2. 2.2 RESEARCH METHODOLOGY
      1. 2.2.1 Overview
      2. 2.2.2 Data Mining
      3. 2.2.3 Secondary Research
      4. 2.2.4 Primary Research
        1. 2.2.4.1 Primary Interviews and Information Gathering Process
        2. 2.2.4.2 Breakdown of Primary Respondents
      5. 2.2.5 Forecasting Model
      6. 2.2.6 Market Size Estimation
        1. 2.2.6.1 Bottom-Up Approach
        2. 2.2.6.2 Top-Down Approach
      7. 2.2.7 Data Triangulation
      8. 2.2.8 Validation
  3. 3 SECTION III: QUALITATIVE ANALYSIS
    1. 3.1 MARKET DYNAMICS
      1. 3.1.1 Overview
      2. 3.1.2 Drivers
      3. 3.1.3 Restraints
      4. 3.1.4 Opportunities
    2. 3.2 MARKET FACTOR ANALYSIS
      1. 3.2.1 Value chain Analysis
      2. 3.2.2 Porter's Five Forces Analysis
        1. 3.2.2.1 Bargaining Power of Suppliers
        2. 3.2.2.2 Bargaining Power of Buyers
        3. 3.2.2.3 Threat of New Entrants
        4. 3.2.2.4 Threat of Substitutes
        5. 3.2.2.5 Intensity of Rivalry
      3. 3.2.3 COVID-19 Impact Analysis
        1. 3.2.3.1 Market Impact Analysis
        2. 3.2.3.2 Regional Impact
        3. 3.2.3.3 Opportunity and Threat Analysis
  4. 4 SECTION IV: QUANTITATIVE ANALYSIS
    1. 4.1 Pharmaceutical, BY Diagnosis Type (USD Million)
      1. 4.1.1 Oral Glucose Tolerance Test
      2. 4.1.2 Fasting Blood Sugar Test
      3. 4.1.3 Random Blood Sugar Test
      4. 4.1.4 Hemoglobin A1c Test
    2. 4.2 Pharmaceutical, BY Treatment Type (USD Million)
      1. 4.2.1 Dietary Changes
      2. 4.2.2 Insulin Therapy
      3. 4.2.3 Oral Medications
      4. 4.2.4 Physical Activity
    3. 4.3 Pharmaceutical, BY Risk Factor (USD Million)
      1. 4.3.1 Obesity
      2. 4.3.2 Family History
      3. 4.3.3 Age
      4. 4.3.4 Previous Gestational Diabetes
    4. 4.4 Pharmaceutical, BY Patient Age (USD Million)
      1. 4.4.1 Teenagers
      2. 4.4.2 Adults
      3. 4.4.3 Elderly
  5. 5 SECTION V: COMPETITIVE ANALYSIS
    1. 5.1 Competitive Landscape
      1. 5.1.1 Overview
      2. 5.1.2 Competitive Analysis
      3. 5.1.3 Market share Analysis
      4. 5.1.4 Major Growth Strategy in the Pharmaceutical
      5. 5.1.5 Competitive Benchmarking
      6. 5.1.6 Leading Players in Terms of Number of Developments in the Pharmaceutical
      7. 5.1.7 Key developments and growth strategies
        1. 5.1.7.1 New Product Launch/Service Deployment
        2. 5.1.7.2 Merger & Acquisitions
        3. 5.1.7.3 Joint Ventures
      8. 5.1.8 Major Players Financial Matrix
        1. 5.1.8.1 Sales and Operating Income
        2. 5.1.8.2 Major Players R&D Expenditure. 2023
    2. 5.2 Company Profiles
      1. 5.2.1 Abbott Laboratories (US)
        1. 5.2.1.1 Financial Overview
        2. 5.2.1.2 Products Offered
        3. 5.2.1.3 Key Developments
        4. 5.2.1.4 SWOT Analysis
        5. 5.2.1.5 Key Strategies
      2. 5.2.2 Roche Holding AG (CH)
        1. 5.2.2.1 Financial Overview
        2. 5.2.2.2 Products Offered
        3. 5.2.2.3 Key Developments
        4. 5.2.2.4 SWOT Analysis
        5. 5.2.2.5 Key Strategies
      3. 5.2.3 Boehringer Ingelheim (DE)
        1. 5.2.3.1 Financial Overview
        2. 5.2.3.2 Products Offered
        3. 5.2.3.3 Key Developments
        4. 5.2.3.4 SWOT Analysis
        5. 5.2.3.5 Key Strategies
      4. 5.2.4 Sanofi (FR)
        1. 5.2.4.1 Financial Overview
        2. 5.2.4.2 Products Offered
        3. 5.2.4.3 Key Developments
        4. 5.2.4.4 SWOT Analysis
        5. 5.2.4.5 Key Strategies
      5. 5.2.5 Novo Nordisk (DK)
        1. 5.2.5.1 Financial Overview
        2. 5.2.5.2 Products Offered
        3. 5.2.5.3 Key Developments
        4. 5.2.5.4 SWOT Analysis
        5. 5.2.5.5 Key Strategies
      6. 5.2.6 Merck & Co. (US)
        1. 5.2.6.1 Financial Overview
        2. 5.2.6.2 Products Offered
        3. 5.2.6.3 Key Developments
        4. 5.2.6.4 SWOT Analysis
        5. 5.2.6.5 Key Strategies
      7. 5.2.7 Johnson & Johnson (US)
        1. 5.2.7.1 Financial Overview
        2. 5.2.7.2 Products Offered
        3. 5.2.7.3 Key Developments
        4. 5.2.7.4 SWOT Analysis
        5. 5.2.7.5 Key Strategies
      8. 5.2.8 Bayer AG (DE)
        1. 5.2.8.1 Financial Overview
        2. 5.2.8.2 Products Offered
        3. 5.2.8.3 Key Developments
        4. 5.2.8.4 SWOT Analysis
        5. 5.2.8.5 Key Strategies
    3. 5.3 Appendix
      1. 5.3.1 References
      2. 5.3.2 Related Reports
  6. 6 LIST OF FIGURES
    1. 6.1 MARKET SYNOPSIS
    2. 6.2 US MARKET ANALYSIS BY DIAGNOSIS TYPE
    3. 6.3 US MARKET ANALYSIS BY TREATMENT TYPE
    4. 6.4 US MARKET ANALYSIS BY RISK FACTOR
    5. 6.5 US MARKET ANALYSIS BY PATIENT AGE
    6. 6.6 KEY BUYING CRITERIA OF PHARMACEUTICAL
    7. 6.7 RESEARCH PROCESS OF MRFR
    8. 6.8 DRO ANALYSIS OF PHARMACEUTICAL
    9. 6.9 DRIVERS IMPACT ANALYSIS: PHARMACEUTICAL
    10. 6.10 RESTRAINTS IMPACT ANALYSIS: PHARMACEUTICAL
    11. 6.11 SUPPLY / VALUE CHAIN: PHARMACEUTICAL
    12. 6.12 PHARMACEUTICAL, BY DIAGNOSIS TYPE, 2024 (% SHARE)
    13. 6.13 PHARMACEUTICAL, BY DIAGNOSIS TYPE, 2024 TO 2035 (USD Million)
    14. 6.14 PHARMACEUTICAL, BY TREATMENT TYPE, 2024 (% SHARE)
    15. 6.15 PHARMACEUTICAL, BY TREATMENT TYPE, 2024 TO 2035 (USD Million)
    16. 6.16 PHARMACEUTICAL, BY RISK FACTOR, 2024 (% SHARE)
    17. 6.17 PHARMACEUTICAL, BY RISK FACTOR, 2024 TO 2035 (USD Million)
    18. 6.18 PHARMACEUTICAL, BY PATIENT AGE, 2024 (% SHARE)
    19. 6.19 PHARMACEUTICAL, BY PATIENT AGE, 2024 TO 2035 (USD Million)
    20. 6.20 BENCHMARKING OF MAJOR COMPETITORS
  7. 7 LIST OF TABLES
    1. 7.1 LIST OF ASSUMPTIONS
  8. 7.1.1
    1. 7.2 US MARKET SIZE ESTIMATES; FORECAST
      1. 7.2.1 BY DIAGNOSIS TYPE, 2025-2035 (USD Million)
      2. 7.2.2 BY TREATMENT TYPE, 2025-2035 (USD Million)
      3. 7.2.3 BY RISK FACTOR, 2025-2035 (USD Million)
      4. 7.2.4 BY PATIENT AGE, 2025-2035 (USD Million)
    2. 7.3 PRODUCT LAUNCH/PRODUCT DEVELOPMENT/APPROVAL
  9. 7.3.1
    1. 7.4 ACQUISITION/PARTNERSHIP
  10. 7.4.1

US Pharmaceutical Market Segmentation

Pharmaceutical By Diagnosis Type (USD Million, 2025-2035)

  • Oral Glucose Tolerance Test
  • Fasting Blood Sugar Test
  • Random Blood Sugar Test
  • Hemoglobin A1c Test

Pharmaceutical By Treatment Type (USD Million, 2025-2035)

  • Dietary Changes
  • Insulin Therapy
  • Oral Medications
  • Physical Activity

Pharmaceutical By Risk Factor (USD Million, 2025-2035)

  • Obesity
  • Family History
  • Age
  • Previous Gestational Diabetes

Pharmaceutical By Patient Age (USD Million, 2025-2035)

  • Teenagers
  • Adults
  • Elderly

Compare Licence

×
Features License Type
Single User Multiuser License Enterprise User
Price $4,950 $5,950 $7,250
Maximum User Access Limit 1 User Upto 10 Users Unrestricted Access Throughout the Organization
Free Customization
Direct Access to Analyst
Deliverable Format
Platform Access
Discount on Next Purchase 10% 15% 15%
Printable Versions