Request Free Sample ×

Kindly complete the form below to receive a free sample of this Report

* Please use a valid business email

Leading companies partner with us for data-driven Insights

clients tt-cursor
Hero Background

US Food Emulsifiers Market

ID: MRFR/FnB/19499-HCR
128 Pages
Snehal Singh
Last Updated: April 06, 2026

US Food Emulsifiers Market Size, Share, Industry Trend & Analysis Research Report: By Source (plant, animal, synthetic), By Type (lecithin, sorbitan derivatives, monoglycerides, polyhydric emulsifiers, anionic emulsifiers) andBy Application (processed meat, poultry & fish, bakery & confectionery, spreads, infant formula)- Forecast to 2035

Share:
Download PDF ×

We do not share your information with anyone. However, we may send you emails based on your report interest from time to time. You may contact us at any time to opt-out.

  1. 1 SECTION I: EXECUTIVE SUMMARY AND KEY HIGHLIGHTS
    1. 1.1 EXECUTIVE SUMMARY
      1. 1.1.1 Market Overview
      2. 1.1.2 Key Findings
      3. 1.1.3 Market Segmentation
      4. 1.1.4 Competitive Landscape
      5. 1.1.5 Challenges and Opportunities
      6. 1.1.6 Future Outlook
  2. 2 SECTION II: SCOPING, METHODOLOGY AND MARKET STRUCTURE
    1. 2.1 MARKET INTRODUCTION
      1. 2.1.1 Definition
      2. 2.1.2 Scope of the study
        1. 2.1.2.1 Research Objective
        2. 2.1.2.2 Assumption
        3. 2.1.2.3 Limitations
    2. 2.2 RESEARCH METHODOLOGY
      1. 2.2.1 Overview
      2. 2.2.2 Data Mining
      3. 2.2.3 Secondary Research
      4. 2.2.4 Primary Research
        1. 2.2.4.1 Primary Interviews and Information Gathering Process
        2. 2.2.4.2 Breakdown of Primary Respondents
      5. 2.2.5 Forecasting Model
      6. 2.2.6 Market Size Estimation
        1. 2.2.6.1 Bottom-Up Approach
        2. 2.2.6.2 Top-Down Approach
      7. 2.2.7 Data Triangulation
      8. 2.2.8 Validation
  3. 3 SECTION III: QUALITATIVE ANALYSIS
    1. 3.1 MARKET DYNAMICS
      1. 3.1.1 Overview
      2. 3.1.2 Drivers
      3. 3.1.3 Restraints
      4. 3.1.4 Opportunities
    2. 3.2 MARKET FACTOR ANALYSIS
      1. 3.2.1 Value chain Analysis
      2. 3.2.2 Porter's Five Forces Analysis
        1. 3.2.2.1 Bargaining Power of Suppliers
        2. 3.2.2.2 Bargaining Power of Buyers
        3. 3.2.2.3 Threat of New Entrants
        4. 3.2.2.4 Threat of Substitutes
        5. 3.2.2.5 Intensity of Rivalry
      3. 3.2.3 COVID-19 Impact Analysis
        1. 3.2.3.1 Market Impact Analysis
        2. 3.2.3.2 Regional Impact
        3. 3.2.3.3 Opportunity and Threat Analysis
  4. 4 SECTION IV: QUANTITATIVE ANALYSIS
    1. 4.1 Healthcare, BY Application (USD Million)
      1. 4.1.1 Bakery Products
      2. 4.1.2 Dairy Products
      3. 4.1.3 Sauces and Dressings
      4. 4.1.4 Beverages
    2. 4.2 Healthcare, BY Type (USD Million)
      1. 4.2.1 Natural Emulsifiers
      2. 4.2.2 Synthetic Emulsifiers
      3. 4.2.3 Modified Starches
    3. 4.3 Healthcare, BY Functional Benefit (USD Million)
      1. 4.3.1 Stabilizers
      2. 4.3.2 Thickeners
      3. 4.3.3 Texture Modifiers
      4. 4.3.4 Shelf Life Extenders
    4. 4.4 Healthcare, BY End Use (USD Million)
      1. 4.4.1 Food Industry
      2. 4.4.2 Beverage Industry
      3. 4.4.3 Pharmaceuticals
  5. 5 SECTION V: COMPETITIVE ANALYSIS
    1. 5.1 Competitive Landscape
      1. 5.1.1 Overview
      2. 5.1.2 Competitive Analysis
      3. 5.1.3 Market share Analysis
      4. 5.1.4 Major Growth Strategy in the Healthcare
      5. 5.1.5 Competitive Benchmarking
      6. 5.1.6 Leading Players in Terms of Number of Developments in the Healthcare
      7. 5.1.7 Key developments and growth strategies
        1. 5.1.7.1 New Product Launch/Service Deployment
        2. 5.1.7.2 Merger & Acquisitions
        3. 5.1.7.3 Joint Ventures
      8. 5.1.8 Major Players Financial Matrix
        1. 5.1.8.1 Sales and Operating Income
        2. 5.1.8.2 Major Players R&D Expenditure. 2023
    2. 5.2 Company Profiles
      1. 5.2.1 BASF SE (DE)
        1. 5.2.1.1 Financial Overview
        2. 5.2.1.2 Products Offered
        3. 5.2.1.3 Key Developments
        4. 5.2.1.4 SWOT Analysis
        5. 5.2.1.5 Key Strategies
      2. 5.2.2 DuPont de Nemours Inc (US)
        1. 5.2.2.1 Financial Overview
        2. 5.2.2.2 Products Offered
        3. 5.2.2.3 Key Developments
        4. 5.2.2.4 SWOT Analysis
        5. 5.2.2.5 Key Strategies
      3. 5.2.3 Cargill Inc (US)
        1. 5.2.3.1 Financial Overview
        2. 5.2.3.2 Products Offered
        3. 5.2.3.3 Key Developments
        4. 5.2.3.4 SWOT Analysis
        5. 5.2.3.5 Key Strategies
      4. 5.2.4 Kerry Group plc (IE)
        1. 5.2.4.1 Financial Overview
        2. 5.2.4.2 Products Offered
        3. 5.2.4.3 Key Developments
        4. 5.2.4.4 SWOT Analysis
        5. 5.2.4.5 Key Strategies
      5. 5.2.5 ADM (US)
        1. 5.2.5.1 Financial Overview
        2. 5.2.5.2 Products Offered
        3. 5.2.5.3 Key Developments
        4. 5.2.5.4 SWOT Analysis
        5. 5.2.5.5 Key Strategies
      6. 5.2.6 Evonik Industries AG (DE)
        1. 5.2.6.1 Financial Overview
        2. 5.2.6.2 Products Offered
        3. 5.2.6.3 Key Developments
        4. 5.2.6.4 SWOT Analysis
        5. 5.2.6.5 Key Strategies
      7. 5.2.7 Palsgaard A/S (DK)
        1. 5.2.7.1 Financial Overview
        2. 5.2.7.2 Products Offered
        3. 5.2.7.3 Key Developments
        4. 5.2.7.4 SWOT Analysis
        5. 5.2.7.5 Key Strategies
      8. 5.2.8 Sethness Products Company (US)
        1. 5.2.8.1 Financial Overview
        2. 5.2.8.2 Products Offered
        3. 5.2.8.3 Key Developments
        4. 5.2.8.4 SWOT Analysis
        5. 5.2.8.5 Key Strategies
    3. 5.3 Appendix
      1. 5.3.1 References
      2. 5.3.2 Related Reports
  6. 6 LIST OF FIGURES
    1. 6.1 MARKET SYNOPSIS
    2. 6.2 US MARKET ANALYSIS BY APPLICATION
    3. 6.3 US MARKET ANALYSIS BY TYPE
    4. 6.4 US MARKET ANALYSIS BY FUNCTIONAL BENEFIT
    5. 6.5 US MARKET ANALYSIS BY END USE
    6. 6.6 KEY BUYING CRITERIA OF HEALTHCARE
    7. 6.7 RESEARCH PROCESS OF MRFR
    8. 6.8 DRO ANALYSIS OF HEALTHCARE
    9. 6.9 DRIVERS IMPACT ANALYSIS: HEALTHCARE
    10. 6.10 RESTRAINTS IMPACT ANALYSIS: HEALTHCARE
    11. 6.11 SUPPLY / VALUE CHAIN: HEALTHCARE
    12. 6.12 HEALTHCARE, BY APPLICATION, 2024 (% SHARE)
    13. 6.13 HEALTHCARE, BY APPLICATION, 2024 TO 2035 (USD Million)
    14. 6.14 HEALTHCARE, BY TYPE, 2024 (% SHARE)
    15. 6.15 HEALTHCARE, BY TYPE, 2024 TO 2035 (USD Million)
    16. 6.16 HEALTHCARE, BY FUNCTIONAL BENEFIT, 2024 (% SHARE)
    17. 6.17 HEALTHCARE, BY FUNCTIONAL BENEFIT, 2024 TO 2035 (USD Million)
    18. 6.18 HEALTHCARE, BY END USE, 2024 (% SHARE)
    19. 6.19 HEALTHCARE, BY END USE, 2024 TO 2035 (USD Million)
    20. 6.20 BENCHMARKING OF MAJOR COMPETITORS
  7. 7 LIST OF TABLES
    1. 7.1 LIST OF ASSUMPTIONS
  8. 7.1.1
    1. 7.2 US MARKET SIZE ESTIMATES; FORECAST
      1. 7.2.1 BY APPLICATION, 2025-2035 (USD Million)
      2. 7.2.2 BY TYPE, 2025-2035 (USD Million)
      3. 7.2.3 BY FUNCTIONAL BENEFIT, 2025-2035 (USD Million)
      4. 7.2.4 BY END USE, 2025-2035 (USD Million)
    2. 7.3 PRODUCT LAUNCH/PRODUCT DEVELOPMENT/APPROVAL
  9. 7.3.1
    1. 7.4 ACQUISITION/PARTNERSHIP
  10. 7.4.1

US Healthcare Market Segmentation

Healthcare By Application (USD Million, 2025-2035)
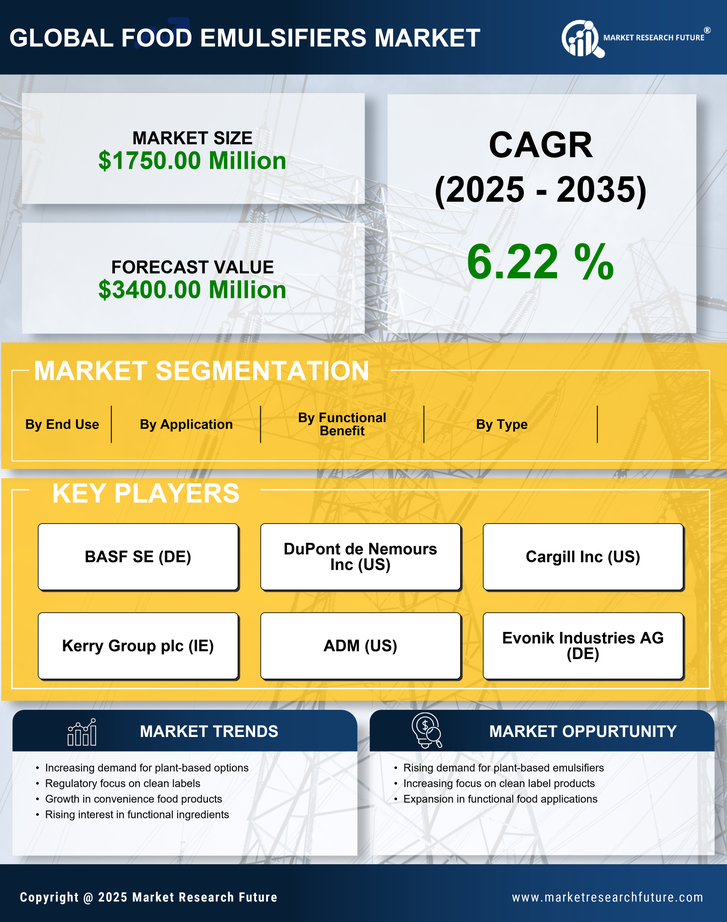
  • Bakery Products
  • Dairy Products
  • Sauces and Dressings
  • Beverages

Healthcare By Type (USD Million, 2025-2035)

  • Natural Emulsifiers
  • Synthetic Emulsifiers
  • Modified Starches

Healthcare By Functional Benefit (USD Million, 2025-2035)

  • Stabilizers
  • Thickeners
  • Texture Modifiers
  • Shelf Life Extenders

Healthcare By End Use (USD Million, 2025-2035)

  • Food Industry
  • Beverage Industry
  • Pharmaceuticals

Compare Licence

×
Features License Type
Single User Multiuser License Enterprise User
Price $4,950 $5,950 $7,250
Maximum User Access Limit 1 User Upto 10 Users Unrestricted Access Throughout the Organization
Free Customization
Direct Access to Analyst
Deliverable Format
Platform Access
Discount on Next Purchase 10% 15% 15%
Printable Versions