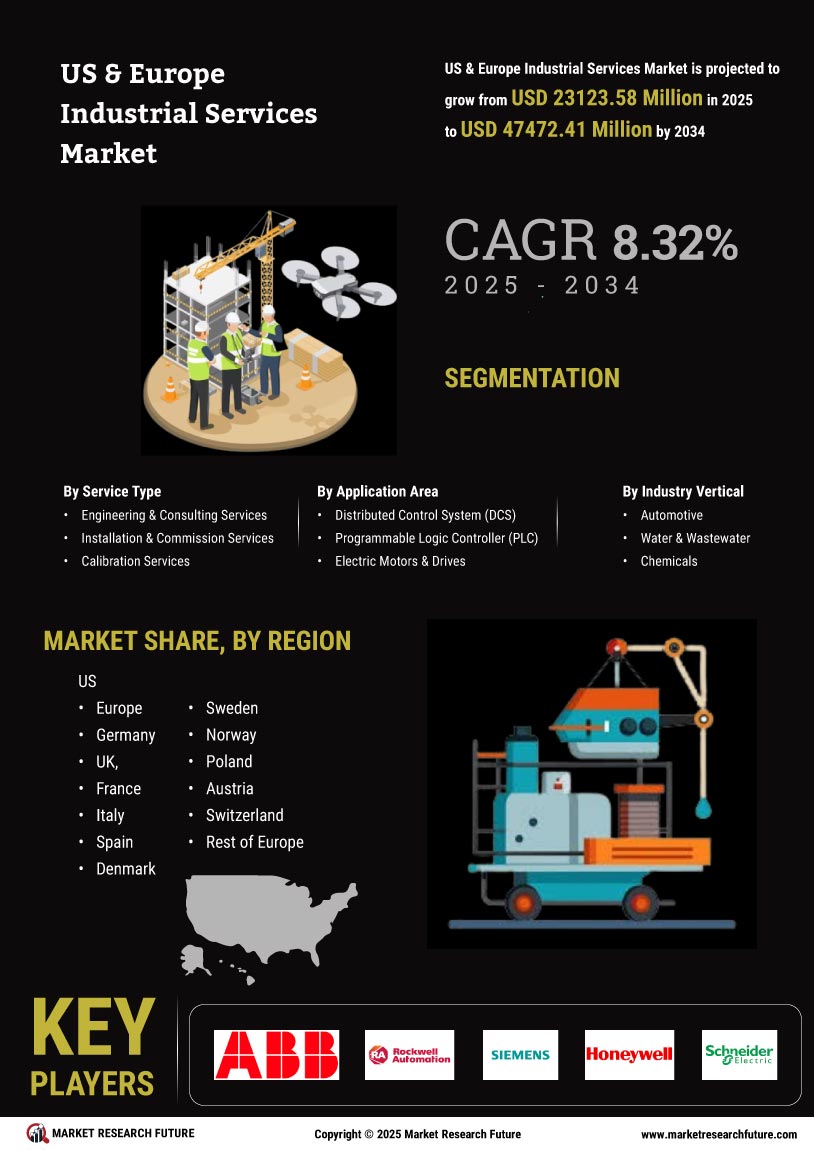
Certified Global Research Member
Isomar fd.webp Wcrc 57.webp
Key Questions Answered
  • Global Market Outlook
  • In-depth analysis of global and regional trends
  • Analyze and identify the major players in the market, their market share, key developments, etc.
  • To understand the capability of the major players based on products offered, financials, and strategies.
  • Identify disrupting products, companies, and trends.
  • To identify opportunities in the market.
  • Analyze the key challenges in the market.
  • Analyze the regional penetration of players, products, and services in the market.
  • Comparison of major playersโ€™ financial performance.
  • Evaluate strategies adopted by major players.
  • Recommendations
Why Choose Market Research Future?
  • Vigorous research methodologies for specific market.
  • Knowledge partners across the globe
  • Large network of partner consultants.
  • Ever-increasing/ Escalating data base with quarterly monitoring of various markets
  • Trusted by fortune 500 companies/startups/ universities/organizations
  • Large database of 5000+ markets reports.
  • Effective and prompt pre- and post-sales support.

US & Europe Industrial Services Market Research Report By Service Type (Engineering and Consulting, Installation And Commissioning, Calibration Services, GXP-Services, Operational Improvement And Maintenance and, Others), by Application Area (Distributed Control System, Programmable Logic Controller, Supervisory Control And Data Acquisition, Electric Motors and Drives, Valves and Actuators, Human Machine Interface, Manufacturing Execution System, Safety Systems, Industrial Pc, Industrial Robotics and Others), by Industry Vertical (Oil and G


ID: MRFR/ICT/19757-CR | 128 Pages | Author: Aarti Dhapte| March 2024

US & Europe Industrial Services Market Segmentation


US & Europe Industrial Services Service Type Outlook (USD Million, 2019-2032)


  • Engineering & Consulting Services

  • Installation & Commission Services

  • Calibration Services

  • GxP Services

  • Operational Improvement & Maintenance Services

  • Others


US & Europe Industrial Services Application Area Outlook (USD Million, 2019-2032)


  • Distributed Control System (DCS)

  • Programmable Logic Controller (PLC)

  • Electric Motors & Drives

  • Supervisory Control and Data Acquisition (SCADA)

  • Valves and Actuators

  • Human Machine Interface (HMI)

  • Manufacturing Execution System (MES)

  • Safety Systems

  • Industrial PC

  • Industrial Robots

  • Others


US & Europe Industrial Services Industry Vertical Outlook (USD Million, 2019-2032)


  • Oil & Gas

  • Healthcare & Pharmaceuticals

  • Automotive

  • Water & Wastewater

  • Chemicals

  • Food & Beverages

  • Energy & Power

  • Semiconductor & Electronics

  • Paper & Pulp

  • Metals & Mining

  • Aerospace

  • Others


US & Europe Industrial Services Regional Outlook (USD Million, 2019-2032)


US Industrial Services Service Type Outlook (USD Million, 2019-2032)


  • Engineering & Consulting Services

  • Installation & Commission Services

  • Calibration Services

  • GxP Services

  • Operational Improvement & Maintenance Services

  • Others


US Industrial Services Application Area Outlook (USD Million, 2019-2032)


  • Distributed Control System (DCS)

  • Programmable Logic Controller (PLC)

  • Electric Motors & Drives

  • Supervisory Control and Data Acquisition (SCADA)

  • Valves and Actuators

  • Human Machine Interface (HMI)

  • Manufacturing Execution System (MES)

  • Safety Systems

  • Industrial PC

  • Industrial Robots

  • Others


US Industrial Services Industry Vertical Outlook (USD Million, 2019-2032)


  • Oil & Gas

  • Healthcare & Pharmaceuticals

  • Automotive

  • Water & Wastewater

  • Chemicals

  • Food & Beverages

  • Energy & Power

  • Semiconductor & Electronics

  • Paper & Pulp

  • Metals & Mining

  • Aerospace

  • Others


Europe Industrial Services Service Type Outlook (USD Million, 2019-2032)


  • Engineering & Consulting Services

  • Installation & Commission Services

  • Calibration Services

  • GxP Services

  • Operational Improvement & Maintenance Services

  • Others


Europe Industrial Services Application Area Outlook (USD Million, 2019-2032)


  • Distributed Control System (DCS)

  • Programmable Logic Controller (PLC)

  • Electric Motors & Drives

  • Supervisory Control and Data Acquisition (SCADA)

  • Valves and Actuators

  • Human Machine Interface (HMI)

  • Manufacturing Execution System (MES)

  • Safety Systems

  • Industrial PC

  • Industrial Robots

  • Others


Europe Industrial Services Industry Vertical Outlook (USD Million, 2019-2032)


  • Oil & Gas

  • Healthcare & Pharmaceuticals

  • Automotive

  • Water & Wastewater

  • Chemicals

  • Food & Beverages

  • Energy & Power

  • Semiconductor & Electronics

  • Paper & Pulp

  • Metals & Mining

  • Aerospace

  • Others


Germany Industrial Services Service Type Outlook (USD Million, 2019-2032)


  • Engineering & Consulting Services

  • Installation & Commission Services

  • Calibration Services

  • GxP Services

  • Operational Improvement & Maintenance Services

  • Others


Germany Industrial Services Application Area Outlook (USD Million, 2019-2032)


  • Distributed Control System (DCS)

  • Programmable Logic Controller (PLC)

  • Electric Motors & Drives

  • Supervisory Control and Data Acquisition (SCADA)

  • Valves and Actuators

  • Human Machine Interface (HMI)

  • Manufacturing Execution System (MES)

  • Safety Systems

  • Industrial PC

  • Industrial Robots

  • Others


Germany Industrial Services Industry Vertical Outlook (USD Million, 2019-2032)


  • Oil & Gas

  • Healthcare & Pharmaceuticals

  • Automotive

  • Water & Wastewater

  • Chemicals

  • Food & Beverages

  • Energy & Power

  • Semiconductor & Electronics

  • Paper & Pulp

  • Metals & Mining

  • Aerospace

  • Others


UK Industrial Services Service Type Outlook (USD Million, 2019-2032)


  • Engineering & Consulting Services

  • Installation & Commission Services

  • Calibration Services

  • GxP Services

  • Operational Improvement & Maintenance Services

  • Others


UK Industrial Services Application Area Outlook (USD Million, 2019-2032)


  • Distributed Control System (DCS)

  • Programmable Logic Controller (PLC)

  • Electric Motors & Drives

  • Supervisory Control and Data Acquisition (SCADA)

  • Valves and Actuators

  • Human Machine Interface (HMI)

  • Manufacturing Execution System (MES)

  • Safety Systems

  • Industrial PC

  • Industrial Robots

  • Others


UK Industrial Services Industry Vertical Outlook (USD Million, 2019-2032)


  • Oil & Gas

  • Healthcare & Pharmaceuticals

  • Automotive

  • Water & Wastewater

  • Chemicals

  • Food & Beverages

  • Energy & Power

  • Semiconductor & Electronics

  • Paper & Pulp

  • Metals & Mining

  • Aerospace

  • Others


France Industrial Services Service Type Outlook (USD Million, 2019-2032)


  • Engineering & Consulting Services

  • Installation & Commission Services

  • Calibration Services

  • GxP Services

  • Operational Improvement & Maintenance Services

  • Others


France Industrial Services Application Area Outlook (USD Million, 2019-2032)


  • Distributed Control System (DCS)

  • Programmable Logic Controller (PLC)

  • Electric Motors & Drives

  • Supervisory Control and Data Acquisition (SCADA)

  • Valves and Actuators

  • Human Machine Interface (HMI)

  • Manufacturing Execution System (MES)

  • Safety Systems

  • Industrial PC

  • Industrial Robots

  • Others


France Industrial Services Industry Vertical Outlook (USD Million, 2019-2032)


  • Oil & Gas

  • Healthcare & Pharmaceuticals

  • Automotive

  • Water & Wastewater

  • Chemicals

  • Food & Beverages

  • Energy & Power

  • Semiconductor & Electronics

  • Paper & Pulp

  • Metals & Mining

  • Aerospace

  • Others


Italy Industrial Services Service Type Outlook (USD Million, 2019-2032)


  • Engineering & Consulting Services

  • Installation & Commission Services

  • Calibration Services

  • GxP Services

  • Operational Improvement & Maintenance Services

  • Others


Italy Industrial Services Application Area Outlook (USD Million, 2019-2032)


  • Distributed Control System (DCS)

  • Programmable Logic Controller (PLC)

  • Electric Motors & Drives

  • Supervisory Control and Data Acquisition (SCADA)

  • Valves and Actuators

  • Human Machine Interface (HMI)

  • Manufacturing Execution System (MES)

  • Safety Systems

  • Industrial PC

  • Industrial Robots

  • Others


Italy Industrial Services Industry Vertical Outlook (USD Million, 2019-2032)


  • Oil & Gas

  • Healthcare & Pharmaceuticals

  • Automotive

  • Water & Wastewater

  • Chemicals

  • Food & Beverages

  • Energy & Power

  • Semiconductor & Electronics

  • Paper & Pulp

  • Metals & Mining

  • Aerospace

  • Others


Spain Industrial Services Service Type Outlook (USD Million, 2019-2032)


  • Engineering & Consulting Services

  • Installation & Commission Services

  • Calibration Services

  • GxP Services

  • Operational Improvement & Maintenance Services

  • Others


Spain Industrial Services Application Area Outlook (USD Million, 2019-2032)


  • Distributed Control System (DCS)

  • Programmable Logic Controller (PLC)

  • Electric Motors & Drives

  • Supervisory Control and Data Acquisition (SCADA)

  • Valves and Actuators

  • Human Machine Interface (HMI)

  • Manufacturing Execution System (MES)

  • Safety Systems

  • Industrial PC

  • Industrial Robots

  • Others


Spain Industrial Services Industry Vertical Outlook (USD Million, 2019-2032)


  • Oil & Gas

  • Healthcare & Pharmaceuticals

  • Automotive

  • Water & Wastewater

  • Chemicals

  • Food & Beverages

  • Energy & Power

  • Semiconductor & Electronics

  • Paper & Pulp

  • Metals & Mining

  • Aerospace

  • Others


Denmark Industrial Services Service Type Outlook (USD Million, 2019-2032)


  • Engineering & Consulting Services

  • Installation & Commission Services

  • Calibration Services

  • GxP Services

  • Operational Improvement & Maintenance Services

  • Others


Denmark Industrial Services Application Area Outlook (USD Million, 2019-2032)


  • Distributed Control System (DCS)

  • Programmable Logic Controller (PLC)

  • Electric Motors & Drives

  • Supervisory Control and Data Acquisition (SCADA)

  • Valves and Actuators

  • Human Machine Interface (HMI)

  • Manufacturing Execution System (MES)

  • Safety Systems

  • Industrial PC

  • Industrial Robots

  • Others


Denmark Industrial Services Industry Vertical Outlook (USD Million, 2019-2032)


  • Oil & Gas

  • Healthcare & Pharmaceuticals

  • Automotive

  • Water & Wastewater

  • Chemicals

  • Food & Beverages

  • Energy & Power

  • Semiconductor & Electronics

  • Paper & Pulp

  • Metals & Mining

  • Aerospace

  • Others


Sweden Industrial Services Service Type Outlook (USD Million, 2019-2032)


  • Engineering & Consulting Services

  • Installation & Commission Services

  • Calibration Services

  • GxP Services

  • Operational Improvement & Maintenance Services

  • Others


Sweden Industrial Services Application Area Outlook (USD Million, 2019-2032)


  • Distributed Control System (DCS)

  • Programmable Logic Controller (PLC)

  • Electric Motors & Drives

  • Supervisory Control and Data Acquisition (SCADA)

  • Valves and Actuators

  • Human Machine Interface (HMI)

  • Manufacturing Execution System (MES)

  • Safety Systems

  • Industrial PC

  • Industrial Robots

  • Others


Sweden Industrial Services Industry Vertical Outlook (USD Million, 2019-2032)


  • Oil & Gas

  • Healthcare & Pharmaceuticals

  • Automotive

  • Water & Wastewater

  • Chemicals

  • Food & Beverages

  • Energy & Power

  • Semiconductor & Electronics

  • Paper & Pulp

  • Metals & Mining

  • Aerospace

  • Others


Norway Industrial Services Service Type Outlook (USD Million, 2019-2032)


  • Engineering & Consulting Services

  • Installation & Commission Services

  • Calibration Services

  • GxP Services

  • Operational Improvement & Maintenance Services

  • Others


Norway Industrial Services Application Area Outlook (USD Million, 2019-2032)


  • Distributed Control System (DCS)

  • Programmable Logic Controller (PLC)

  • Electric Motors & Drives

  • Supervisory Control and Data Acquisition (SCADA)

  • Valves and Actuators

  • Human Machine Interface (HMI)

  • Manufacturing Execution System (MES)

  • Safety Systems

  • Industrial PC

  • Industrial Robots

  • Others


Norway Industrial Services Industry Vertical Outlook (USD Million, 2019-2032)


  • Oil & Gas

  • Healthcare & Pharmaceuticals

  • Automotive

  • Water & Wastewater

  • Chemicals

  • Food & Beverages

  • Energy & Power

  • Semiconductor & Electronics

  • Paper & Pulp

  • Metals & Mining

  • Aerospace

  • Others


Poland Industrial Services Service Type Outlook (USD Million, 2019-2032)


  • Engineering & Consulting Services

  • Installation & Commission Services

  • Calibration Services

  • GxP Services

  • Operational Improvement & Maintenance Services

  • Others


Poland Industrial Services Application Area Outlook (USD Million, 2019-2032)


  • Distributed Control System (DCS)

  • Programmable Logic Controller (PLC)

  • Electric Motors & Drives

  • Supervisory Control and Data Acquisition (SCADA)

  • Valves and Actuators

  • Human Machine Interface (HMI)

  • Manufacturing Execution System (MES)

  • Safety Systems

  • Industrial PC

  • Industrial Robots

  • Others


Poland Industrial Services Industry Vertical Outlook (USD Million, 2019-2032)


  • Oil & Gas

  • Healthcare & Pharmaceuticals

  • Automotive

  • Water & Wastewater

  • Chemicals

  • Food & Beverages

  • Energy & Power

  • Semiconductor & Electronics

  • Paper & Pulp

  • Metals & Mining

  • Aerospace

  • Others


Austria Industrial Services Service Type Outlook (USD Million, 2019-2032)


  • Engineering & Consulting Services

  • Installation & Commission Services

  • Calibration Services

  • GxP Services

  • Operational Improvement & Maintenance Services

  • Others


Austria Industrial Services Application Area Outlook (USD Million, 2019-2032)


  • Distributed Control System (DCS)

  • Programmable Logic Controller (PLC)

  • Electric Motors & Drives

  • Supervisory Control and Data Acquisition (SCADA)

  • Valves and Actuators

  • Human Machine Interface (HMI)

  • Manufacturing Execution System (MES)

  • Safety Systems

  • Industrial PC

  • Industrial Robots

  • Others


Austria Industrial Services Industry Vertical Outlook (USD Million, 2019-2032)


  • Oil & Gas

  • Healthcare & Pharmaceuticals

  • Automotive

  • Water & Wastewater

  • Chemicals

  • Food & Beverages

  • Energy & Power

  • Semiconductor & Electronics

  • Paper & Pulp

  • Metals & Mining

  • Aerospace

  • Others


Switzerland Industrial Services Service Type Outlook (USD Million, 2019-2032)


  • Engineering & Consulting Services

  • Installation & Commission Services

  • Calibration Services

  • GxP Services

  • Operational Improvement & Maintenance Services

  • Others


Switzerland Industrial Services Application Area Outlook (USD Million, 2019-2032)


  • Distributed Control System (DCS)

  • Programmable Logic Controller (PLC)

  • Electric Motors & Drives

  • Supervisory Control and Data Acquisition (SCADA)

  • Valves and Actuators

  • Human Machine Interface (HMI)

  • Manufacturing Execution System (MES)

  • Safety Systems

  • Industrial PC

  • Industrial Robots

  • Others


Switzerland Industrial Services Industry Vertical Outlook (USD Million, 2019-2032)


  • Oil & Gas

  • Healthcare & Pharmaceuticals

  • Automotive

  • Water & Wastewater

  • Chemicals

  • Food & Beverages

  • Energy & Power

  • Semiconductor & Electronics

  • Paper & Pulp

  • Metals & Mining

  • Aerospace

  • Others


Rest of Europe Industrial Services Service Type Outlook (USD Million, 2019-2032)


  • Engineering & Consulting Services

  • Installation & Commission Services

  • Calibration Services

  • GxP Services

  • Operational Improvement & Maintenance Services

  • Others


Rest of Europe Industrial Services Application Area Outlook (USD Million, 2019-2032)


  • Distributed Control System (DCS)

  • Programmable Logic Controller (PLC)

  • Electric Motors & Drives

  • Supervisory Control and Data Acquisition (SCADA)

  • Valves and Actuators

  • Human Machine Interface (HMI)

  • Manufacturing Execution System (MES)

  • Safety Systems

  • Industrial PC

  • Industrial Robots

  • Others


Rest of Europe Industrial Services Industry Vertical Outlook (USD Million, 2019-2032)


  • Oil & Gas

  • Healthcare & Pharmaceuticals

  • Automotive

  • Water & Wastewater

  • Chemicals

  • Food & Beverages

  • Energy & Power

  • Semiconductor & Electronics

  • Paper & Pulp

  • Metals & Mining

  • Aerospace

  • Others

Leading companies partner with us for data-driven Insights
client_1 client_2 client_3 client_4 client_5 client_6 client_7 client_8 client_9 client_10
Please fill in Business Email for Quick Response

TABLE OF CONTENTS

1 EXECUTIVE SUMMARY 14

2 MARKET INTRODUCTION 18

2.1 DEFINITION 18

2.2 SCOPE OF THE STUDY 18

2.3 RESEARCH OBJECTIVE 18

2.4 MARKET STRUCTURE 19

3 RESEARCH METHODOLOGY 20

4 MARKET DYNAMICS 27

4.1 DRIVERS 27

4.1.1 EMPHASIS ON COST REDUCTION AND OPERATIONAL EFFICIENCY 27

4.1.2 GROWING COMPLEXITY IN INDUSTRIAL OPERATIONS 28

4.1.3 INCREASING DEMAND FOR MAINTENANCE AND REPAIR SERVICES 29

4.2 RESTRAINTS 30

4.2.1 LIMITED AVAILABILITY OF SKILLED LABOR 30

4.2.2 LACK OF END-TO-END QUALITY AND PROCESS CONTROL 31

4.2.3 HIGH COST ASSOCIATED WITH SPECIALIZED SERVICES 31

4.3 OPPORTUNITY 32

4.3.1 THE ADVENT OF MAINTENANCE AS A SERVICE 32

4.3.2 INCREASE IN MANUFACTURING AND PRODUCTION ACTIVITIES 33

4.4 TRENDS 33

4.4.1 USE OF AI APPLICATION FOR MONITORING 33

4.4.2 RISE IN ADOPTION OF OUTSOURCING SERVICES 34

4.5 COVID 19 IMPACT ANALYSIS 35

4.5.1 IMPACT ON MANUFACTURING INDUSTRY 35

4.5.2 IMPACT ON SERVICES INDUSTRY 36

4.5.3 IMPACT ON DEMAND BY END USER 36

5 MARKET FACTOR ANALYSIS 37

5.1 VALUE CHAIN ANALYSIS 37

5.1.1 SERVICE PROVIDER 37

5.1.2 END USER 38

5.2 PORTERโ€™S FIVE FORCES MODEL 38

5.2.1 BARGAINING POWER OF SUPPLIERS 39

5.2.2 BARGAINING POWER OF BUYERS 39

5.2.3 THREAT OF NEW ENTRANTS 39

5.2.4 THREAT OF SUBSTITUTES 39

5.2.5 INTENSITY OF RIVALRY 40

6 US & EUROPE INDUSTRIAL SERVICES MARKET, BY SERVICE TYPE 41

6.1 OVERVIEW 41

6.2 ENGINEERING AND CONSULTING 42

6.3 INSTALLATION AND COMMISSIONING 42

6.4 CALIBRATION SERVICES 42

6.5 GXP-SERVICES 43

6.6 OPERATIONAL IMPROVEMENT AND MAINTENANCE 43

6.7 OTHERS 43

7 US & EUROPE INDUSTRIAL SERVICES MARKET, BY APPLICATION AREA 44

7.1 OVERVIEW 44

7.2 DISTRIBUTED CONTROL SYSTEM 45

7.3 PROGRAMMABLE LOGIC CONTROLLER 45

7.4 SUPERVISORY CONTROL AND DATA ACQUISITION 46

7.5 ELECTRIC MOTORS AND DRIVES 46

7.6 VALVES AND ACTUATORS 46

7.7 HUMAN MACHINE INTERFACE 46

7.8 MANUFACTURING EXECUTION SYSTEM 46

7.9 SAFETY SYSTEMS 46

7.10 INDUSTRIAL PC 47

7.11 INDUSTRIAL ROBOTICS 47

7.12 OTHERS 47

8 US & EUROPE INDUSTRIAL SERVICES MARKET, BY INDUSTRY VERTICAL 48

8.1 OVERVIEW 48

8.2 OIL AND GAS 49

8.3 HEALTHCARE AND PHARMACEUTICALS 49

8.4 AUTOMOTIVE 50

8.5 WATER AND WASTEWATER 50

8.6 CHEMICALS 50

8.7 FOOD AND BEVERAGES 50

8.8 ENERGY AND POWER 50

8.9 SEMICONDUCTOR AND ELECTRONICS 51

8.10 PAPER AND PULP 51

8.11 METALS AND MINING 51

8.12 AEROSPACE 51

8.13 OTHERS 52

9 US & EUROPE INDUSTRIAL SERVICES MARKET, BY REGION 53

9.1 OVERVIEW 53

9.1.1 US & EUROPE INDUSTRIAL SERVICES MARKET, BY REGION, 2019โ€“2032 (USD MILLION) 54

9.2 US 55

9.3 EUROPE 59

9.3.1 EUROPE: INDUSTRIAL SERVICES MARKET, BY COUNTRY, 2019โ€“2032 (USD MILLION) 61

9.3.2 GERMANY 64

9.3.3 UK 66

9.3.4 FRANCE 67

9.3.5 ITALY 69

9.3.6 SPAIN 70

9.3.7 DENMARK 72

9.3.8 NORWAY 73

9.3.9 POLAND 75

9.3.10 SWEDEN 76

9.3.11 AUSTRIA 78

9.3.12 SWITZERLAND 79

9.3.13 REST OF EUROPE 81

10 COMPETITVE LANDSCAPE 83

10.1 COMPETITIVE BENCHMARKING 84

10.2 VENDOR SHARE ANALYSIS 85

10.3 RECENT DEVELOPMENTS 85

10.3.1 PRODUCT DEVELOPMENT 85

11 COMPANY PROFILE 87

11.1 ABB GROUP 87

11.1.1 COMPANY OVERVIEW 87

11.1.2 FINANCIAL OVERVIEW 88

11.1.3 PRODUCTS/SOLUTIONS/SERVICES OFFERED 89

11.1.4 KEY DEVELOPMENTS 89

11.1.5 SWOT ANALYSIS 90

11.1.6 KEY STRATEGIES 90

11.2 ROCKWELL AUTOMATION INC 91

11.2.1 COMPANY OVERVIEW 91

11.2.2 FINANCIAL OVERVIEW 92

11.2.3 PRODUCTS/SERVICES OFFERED 92

KEY DEVELOPMENTS 93

11.2.4 SWOT ANALYSIS 93

11.2.5 KEY STRATEGIES 93

11.3 SIEMENS 94

11.3.1 COMPANY OVERVIEW 94

11.3.2 FINANCIAL OVERVIEW 95

11.3.3 PRODUCTS OFFERED 95

11.3.4 KEY DEVELOPMENTS 96

11.3.5 SWOT ANALYSIS 96

11.3.6 KEY STRATEGIES 96

11.4 HONEYWELL INTERNATIONAL INC 97

11.4.1 COMPANY OVERVIEW 97

11.4.2 FINANCIAL OVERVIEW 98

11.4.3 PRODUCTS OFFERED 98

11.4.4 KEY DEVELOPMENTS 99

11.4.5 SWOT ANALYSIS 99

11.4.6 KEY STRATEGIES 99

11.5 SCHNEIDER ELECTRIC SE 100

11.5.1 COMPANY OVERVIEW 100

11.5.2 FINANCIAL OVERVIEW 101

11.5.3 PRODUCTS/SERVICES/SOLUTIONS OFFERED 101

11.5.4 KEY DEVELOPMENTS 102

11.5.5 SWOT ANALYSIS 103

11.5.6 KEY STRATEGIES 103

11.6 EMERSON ELECTRIC CO. 104

11.6.1 COMPANY OVERVIEW 104

11.6.2 FINANCIAL OVERVIEW 105

11.6.3 PRODUCTS/SERVICES OFFERED 105

11.6.4 KEY DEVELOPMENTS 106

11.6.5 SWOT ANALYSIS 106

11.6.6 KEY STRATEGIES 106

11.7 GENERAL ELECTRIC (GE). 107

11.7.1 COMPANY OVERVIEW 107

11.7.2 FINANCIAL OVERVIEW 108

11.7.3 PRODUCTS/SERVICES OFFERED 108

11.7.4 KEY DEVELOPMENTS 109

11.7.5 SWOT ANALYSIS 109

11.7.6 KEY STRATEGIES 109

11.8 ALTRAD GROUP 110

11.8.1 COMPANY OVERVIEW 110

11.8.2 FINANCIAL OVERVIEW 111

11.8.3 SERVICES OFFERED 111

11.8.4 KEY DEVELOPMENTS 112

11.8.5 SWOT ANALYSIS 112

11.8.6 KEY STRATEGIES 112

11.9 HORVATH. 113

11.9.1 COMPANY OVERVIEW 113

11.9.2 FINANCIAL OVERVIEW 113

11.9.3 PRODUCTS/SERVICES OFFERED 113

11.9.4 KEY DEVELOPMENTS 113

11.10 MICRO PRECISION. 114

11.10.1 COMPANY OVERVIEW 114

11.10.2 FINANCIAL OVERVIEW 114

11.10.3 PRODUCTS/SERVICES OFFERED 114

11.10.4 KEY DEVELOPMENTS 114

11.11 LEADEC HOLDING BV & CO. KG. 115

11.11.1 COMPANY OVERVIEW 115

11.11.2 FINANCIAL OVERVIEW 115

11.11.3 PRODUCTS/SERVICES OFFERED 115

11.11.4 KEY DEVELOPMENTS 116

11.11.5 SWOT ANALYSIS 116

11.11.6 KEY STRATEGIES 116

11.12 PROCESS SENSING TECHNOLOGIES (PST). 117

11.12.1 COMPANY OVERVIEW 117

11.12.2 FINANCIAL OVERVIEW 117

11.12.3 PRODUCTS/SERVICES OFFERED 117

11.12.4 KEY DEVELOPMENTS 118

LIST OF TABLES

TABLE 1 MARKET SYNOPSIS 16

TABLE 2 US & EUROPE INDUSTRIAL SERVICES MARKET, BY SERVICE TYPE, 2019โ€“2032 (USD MILLION) 42

TABLE 3 US & EUROPE INDUSTRIAL SERVICES MARKET, BY ML TECHNOLOGY, 2019โ€“2032 (USD MILLION) 45

TABLE 4 US & EUROPE INDUSTRIAL SERVICES MARKET, BY INDUSTRY VERTICAL, 2019โ€“2032 (USD MILLION) 49

TABLE 5 US & EUROPE INDUSTRIAL SERVICES MARKET, BY REGION, 2019โ€“2032 (USD MILLION) 54

TABLE 6 US INDUSTRIAL SERVICES MARKET, BY SERVICE TYPE, 2019โ€“2032 (USD MILLION) 56

TABLE 7 US INDUSTRIAL SERVICES MARKET, BY ML TECHNOLOGY, 2019โ€“2032 (USD MILLION) 57

TABLE 8 US INDUSTRIAL SERVICES MARKET, BY INDUSTRY VERTICAL, 2019โ€“2032 (USD MILLION) 58

TABLE 9 EUROPE INDUSTRIAL SERVICES MARKET, BY COUNTRY, 2019โ€“2032 (USD MILLION) 61

TABLE 10 EUROPE INDUSTRIAL SERVICES MARKET, BY SERVICE TYPE, 2019โ€“2032 (USD MILLION) 62

TABLE 11 EUROPE INDUSTRIAL SERVICES MARKET, BY ML TECHNOLOGY, 2019โ€“2032 (USD MILLION) 63

TABLE 12 EUROPE INDUSTRIAL SERVICES MARKET, BY INDUSTRY VERTICAL, 2019โ€“2032 (USD MILLION) 64

TABLE 13 GERMANY INDUSTRIAL SERVICES MARKET, BY SERVICE TYPE, 2019โ€“2032 (USD MILLION) 64

TABLE 14 GERMANY INDUSTRIAL SERVICES MARKET, BY ML TECHNOLOGY, 2019โ€“2032 (USD MILLION) 65

TABLE 15 GERMANY INDUSTRIAL SERVICES MARKET, BY INDUSTRY VERTICAL, 2019โ€“2032 (USD MILLION) 65

TABLE 16 UK INDUSTRIAL SERVICES MARKET, BY SERVICE TYPE, 2019โ€“2032 (USD MILLION) 66

TABLE 17 UK INDUSTRIAL SERVICES MARKET, BY ML TECHNOLOGY, 2019โ€“2032 (USD MILLION) 66

TABLE 18 UK INDUSTRIAL SERVICES MARKET, BY INDUSTRY VERTICAL, 2019โ€“2032 (USD MILLION) 67

TABLE 19 FRANCE INDUSTRIAL SERVICES MARKET, BY SERVICE TYPE, 2019โ€“2032 (USD MILLION) 67

TABLE 20 FRANCE INDUSTRIAL SERVICES MARKET, BY ML TECHNOLOGY, 2019โ€“2032 (USD MILLION) 68

TABLE 21 FRANCE INDUSTRIAL SERVICES MARKET, BY INDUSTRY VERTICAL, 2019โ€“2032 (USD MILLION) 68

TABLE 22 ITALY INDUSTRIAL SERVICES MARKET, BY SERVICE TYPE, 2019โ€“2032 (USD MILLION) 69

TABLE 23 ITALY INDUSTRIAL SERVICES MARKET, BY ML TECHNOLOGY, 2019โ€“2032 (USD MILLION) 69

TABLE 24 ITALY INDUSTRIAL SERVICES MARKET, BY INDUSTRY VERTICAL, 2019โ€“2032 (USD MILLION) 70

TABLE 25 SPAIN INDUSTRIAL SERVICES MARKET, BY SERVICE TYPE, 2019โ€“2032 (USD MILLION) 70

TABLE 26 SPAIN INDUSTRIAL SERVICES MARKET, BY ML TECHNOLOGY, 2019โ€“2032 (USD MILLION) 71

TABLE 27 SPAIN INDUSTRIAL SERVICES MARKET, BY INDUSTRY VERTICAL, 2019โ€“2032 (USD MILLION) 71

TABLE 28 DENMARK INDUSTRIAL SERVICES MARKET, BY SERVICE TYPE, 2019โ€“2032 (USD MILLION) 72

TABLE 29 DENMARK INDUSTRIAL SERVICES MARKET, BY ML TECHNOLOGY, 2019โ€“2032 (USD MILLION) 72

TABLE 30 DENMARK INDUSTRIAL SERVICES MARKET, BY INDUSTRY VERTICAL, 2019โ€“2032 (USD MILLION) 73

TABLE 31 NORWAY INDUSTRIAL SERVICES MARKET, BY SERVICE TYPE, 2019โ€“2032 (USD MILLION) 73

TABLE 32 NORWAY INDUSTRIAL SERVICES MARKET, BY ML TECHNOLOGY, 2019โ€“2032 (USD MILLION) 74

TABLE 33 NORWAY INDUSTRIAL SERVICES MARKET, BY INDUSTRY VERTICAL, 2019โ€“2032 (USD MILLION) 74

TABLE 34 POLAND INDUSTRIAL SERVICES MARKET, BY SERVICE TYPE, 2019โ€“2032 (USD MILLION) 75

TABLE 35 POLAND INDUSTRIAL SERVICES MARKET, BY ML TECHNOLOGY, 2019โ€“2032 (USD MILLION) 75

TABLE 36 POLAND INDUSTRIAL SERVICES MARKET, BY INDUSTRY VERTICAL, 2019โ€“2032 (USD MILLION) 76

TABLE 37 SWEDEN INDUSTRIAL SERVICES MARKET, BY SERVICE TYPE, 2019โ€“2032 (USD MILLION) 76

TABLE 38 SWEDEN INDUSTRIAL SERVICES MARKET, BY ML TECHNOLOGY, 2019โ€“2032 (USD MILLION) 77

TABLE 39 SWEDEN INDUSTRIAL SERVICES MARKET, BY INDUSTRY VERTICAL, 2019โ€“2032 (USD MILLION) 77

TABLE 40 AUSTRIA INDUSTRIAL SERVICES MARKET, BY SERVICE TYPE, 2019โ€“2032 (USD MILLION) 78

TABLE 41 AUSTRIA INDUSTRIAL SERVICES MARKET, BY ML TECHNOLOGY, 2019โ€“2032 (USD MILLION) 78

TABLE 42 AUSTRIA INDUSTRIAL SERVICES MARKET, BY INDUSTRY VERTICAL, 2019โ€“2032 (USD MILLION) 79

TABLE 43 SWITZERLAND INDUSTRIAL SERVICES MARKET, BY SERVICE TYPE, 2019โ€“2032 (USD MILLION) 79

TABLE 44 SWITZERLAND INDUSTRIAL SERVICES MARKET, BY ML TECHNOLOGY, 2019โ€“2032 (USD MILLION) 80

TABLE 45 SWITZERLAND INDUSTRIAL SERVICES MARKET, BY INDUSTRY VERTICAL, 2019โ€“2032 (USD MILLION) 80

TABLE 46 REST OF EUROPE INDUSTRIAL SERVICES MARKET, BY SERVICE TYPE, 2019โ€“2032 (USD MILLION) 81

TABLE 47 REST OF EUROPE INDUSTRIAL SERVICES MARKET, BY ML TECHNOLOGY, 2019โ€“2032 (USD MILLION) 81

TABLE 48 REST OF EUROPE INDUSTRIAL SERVICES MARKET, BY INDUSTRY VERTICAL, 2019โ€“2032 (USD MILLION) 82

TABLE 49 PRODUCT DEVELOPMENT 85

TABLE 50 PARTNERSHIP/ ACQUISITION 86

TABLE 51 ABB GROUP: PRODUCTS/SOLUTIONS OFFERED 89

TABLE 52 ABB GROUP: KEY DEVELOPMENTS 89

TABLE 53 ROCKWELL AUTOMATION INC: PRODUCTS/SERVICES OFFERED 92

TABLE 54 ROCKWELL AUTOMATION INC: KEY DEVELOPMENTS 93

TABLE 55 SIEMENS: PRODUCTS OFFERED 95

TABLE 56 SIEMENS: KEY DEVELOPMENTS 96

TABLE 57 HONEYWELL INTERNATIONAL INC: PRODUCTS OFFERED 98

TABLE 58 SCHNEIDER ELECTRIC SE: PRODUCTS/SOLUTIONS/SERVICES OFFERED 101

TABLE 59 SCHNEIDER ELECTRIC SE: KEY DEVELOPMENTS 102

TABLE 60 EMERSON ELECTRIC CO.: PRODUCTS/SERVICES OFFERED 105

TABLE 61 GENERAL ELECTRIC (GE).: PRODUCTS/SERVICES OFFERED 108

TABLE 62 ALTRAD GROUP: SERVICES OFFERED 111

TABLE 63 ALTRAD GROUP: KEY DEVELOPMENTS 112

TABLE 64 HORVATH.: PRODUCTS/SERVICES OFFERED 113

TABLE 65 MICRO PRECISION.: PRODUCTS/SERVICES OFFERED 114

TABLE 66 LEADEC HOLDING BV & CO. KG.: PRODUCTS/SERVICES OFFERED 115

TABLE 67 ALTRAD GROUP: KEY DEVELOPMENTS 116

TABLE 68 PROCESS SENSING TECHNOLOGIES (PST).: PRODUCTS/SERVICES OFFERED 117

LIST OF FIGURES

FIGURE 1 INDUSTRIAL REVOLUTIONS ACROSS THE YEARS 15

FIGURE 2 US & EUROPE INDUSTRIAL SERVICES MARKET: MARKET STRUCTURE 19

FIGURE 3 BOTTOM-UP AND TOP-DOWN APPROACHES 24

FIGURE 4 MARKET DYNAMIC ANALYSIS OF THE US & EUROPE INDUSTRIAL SERVICES MARKET 27

FIGURE 5 DRIVER IMPACT ANALYSIS 30

FIGURE 6 RESTRAINT IMPACT ANALYSIS 32

FIGURE 7 VALUE CHAIN ANALYSIS 37

FIGURE 8 PORTERโ€™S FIVE FORCES MODEL: INDUSTRIAL SERVICES MARKET 38

FIGURE 9 US & EUROPE INDUSTRIAL SERVICES MARKET, BY SERVICE TYPE, 2022 (% SHARE) 41

FIGURE 10 US & EUROPE INDUSTRIAL SERVICES MARKET, BY SERVICE TYPE, 2022 VS 2032 (USD MILLION) 41

FIGURE 11 US & EUROPE INDUSTRIAL SERVICES MARKET, BY APPLICATION AREA, 2022 (% SHARE) 44

FIGURE 12 US & EUROPE INDUSTRIAL SERVICES MARKET, BY APPLICATION AREA, 2022 VS 2032 (USD MILLION) 44

FIGURE 13 US & EUROPE INDUSTRIAL SERVICES MARKET, BY INDUSTRY VERTICAL, 2022 (% SHARE) 48

FIGURE 14 US & EUROPE INDUSTRIAL SERVICES MARKET, BY INDUSTRY VERTICAL, 2022 VS 2032 (USD MILLION) 48

FIGURE 15 US & EUROPE INDUSTRIAL SERVICES MARKET, BY REGION, 2022 (% SHARE) 54

FIGURE 16 US & EUROPE INDUSTRIAL SERVICES MARKET, BY REGION, 2019โ€“2032 (USD MILLION) 54

FIGURE 17 US INDUSTRIAL SERVICES MARKET, BY SERVICE TYPE, 2019-2032 (USD MILLION) 56

FIGURE 18 US INDUSTRIAL SERVICES MARKET, BY APPLICATION AREA, 2019-2032 (USD MILLION) 57

FIGURE 19 US INDUSTRIAL SERVICES MARKET, BY INDUSTRY VERTICAL, 2019-2032 (USD MILLION) 58

FIGURE 20 EUROPE INDUSTRIAL SERVICES MARKET, BY COUNTRY, 2022 (% SHARE) 60

FIGURE 21 EUROPE INDUSTRIAL SERVICES MARKET, BY COUNTRY, 2019โ€“2032 (USD MILLION) 60

FIGURE 22 EUROPE INDUSTRIAL SERVICES MARKET, BY SERVICEC TYPE, 2019-2032 (USD MILLION) 61

FIGURE 23 EUROPE INDUSTRIAL SERVICES MARKET, BY APPLICATION AREA, 2019-2032 (USD MILLION) 62

FIGURE 24 EUROPE INDUSTRIAL SERVICES MARKET, BY INDUSTRY VERTICAL, 2019-2032 (USD MILLION) 63

FIGURE 25 INDUSTRIAL SERVICES MARKET: COMPETITIVE BENCHMARKING 84

FIGURE 26 VENDOR SHARE ANALYSIS (2022, %) 85

FIGURE 27 ABB GROUP: FINANCIAL OVERVIEW SNAPSHOT 88

FIGURE 28 ABB GROUP: SWOT ANALYSIS 90

FIGURE 29 ROCKWELL AUTOMATION INC: FINANCIAL OVERVIEW SNAPSHOT 92

FIGURE 30 ROCKWELL AUTOMATION INC: SWOT ANALYSIS 93

FIGURE 31 SIEMENS: FINANCIAL OVERVIEW SNAPSHOT 95

FIGURE 32 SIEMENS: SWOT ANALYSIS 96

FIGURE 33 HONEYWELL INTERNATIONAL INC: FINANCIAL OVERVIEW SNAPSHOT 98

FIGURE 34 HONEYWELL INTERNATIONAL INC: SWOT ANALYSIS 99

FIGURE 35 SCHNEIDER ELECTRIC SE: FINANCIAL OVERVIEW SNAPSHOT 101

FIGURE 36 SCHNEIDER ELECTRIC SE: SWOT ANALYSIS 103

FIGURE 37 EMERSON ELECTRIC CO.: FINANCIAL OVERVIEW SNAPSHOT 105

FIGURE 38 EMERSON ELECTRIC CO.: SWOT ANALYSIS 106

FIGURE 39 GENERAL ELECTRIC (GE).: FINANCIAL OVERVIEW SNAPSHOT 108

FIGURE 40 GENERAL ELECTRIC (GE).: SWOT ANALYSIS 109

FIGURE 41 ALTRAD GROUP: FINANCIAL OVERVIEW SNAPSHOT 111

FIGURE 42 ALTRAD GROUP: SWOT ANALYSIS 112

FIGURE 43 LEADEC HOLDING BV & CO. KG.: SWOT ANALYSIS 116

Purchase Option
Single User $ 4,950
Multiuser License $ 5,950
Enterprise User $ 7,250
Compare Licenses
Tailored for You
  • Dedicated Research on any specifics segment or region.
  • Focused Research on specific players in the market.
  • Custom Report based only on your requirements.
  • Flexibility to add or subtract any chapter in the study.
  • Historic data from 2014 and forecasts outlook till 2040.
  • Flexibility of providing data/insights in formats (PDF, PPT, Excel).
  • Provide cross segmentation in applicable scenario/markets.