US Industrial Automation & Equipment Market Segmentation
Industrial Automation & Equipment By Imaging Modality (USD Million, 2025-2035)
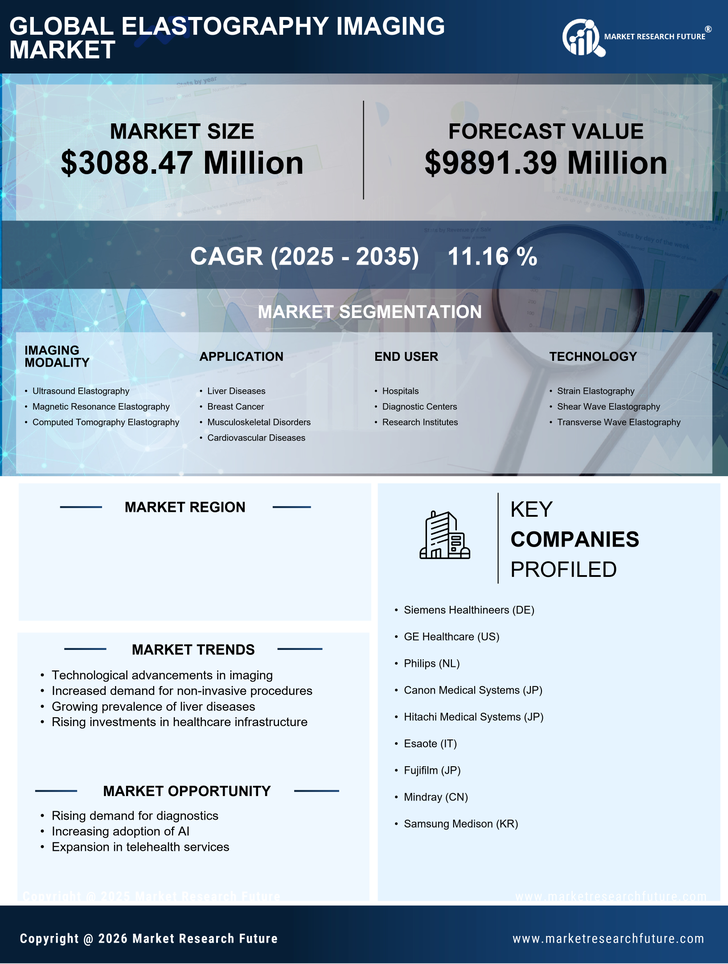
- Ultrasound Elastography
- Magnetic Resonance Elastography
- Computed Tomography Elastography
Industrial Automation & Equipment By Application (USD Million, 2025-2035)
- Liver Diseases
- Breast Cancer
- Musculoskeletal Disorders
- Cardiovascular Diseases
Industrial Automation & Equipment By End User (USD Million, 2025-2035)
- Hospitals
- Diagnostic Centers
- Research Institutes
Industrial Automation & Equipment By Technology (USD Million, 2025-2035)
- Strain Elastography
- Shear Wave Elastography
- Transverse Wave Elastography