Request Free Sample ×

Kindly complete the form below to receive a free sample of this Report

* Please use a valid business email

Leading companies partner with us for data-driven Insights

clients tt-cursor
Hero Background

US Drilling Fluids Market

ID: MRFR/EnP/16686-HCR
100 Pages
Garvit Vyas
Last Updated: April 06, 2026

US Drilling Fluids Market Research Report By Type (Water-Based Fluids, Oil-Based Fluids, Synthetic-Based Fluids, Gas-Based Fluids), By Application (Onshore Drilling, Offshore Drilling, Geothermal Energy, Mining), By Function (Cooling, Lubrication, Cuttings Removal, Pressure Control) and By End Use (Oil and Gas, Construction, Environmental, Mining) - Forecast to 2035

Share:
Download PDF ×

We do not share your information with anyone. However, we may send you emails based on your report interest from time to time. You may contact us at any time to opt-out.

US Drilling Fluids Market Infographic
Purchase Options
  1. 1 SECTION I: EXECUTIVE SUMMARY AND KEY HIGHLIGHTS
  2.   1.1 EXECUTIVE SUMMARY
  3.     1.1.1 Market Overview
  4.     1.1.2 Key Findings
  5.     1.1.3 Market Segmentation
  6.     1.1.4 Competitive Landscape
  7.     1.1.5 Challenges and Opportunities
  8.     1.1.6 Future Outlook
  9. 2 SECTION II: SCOPING, METHODOLOGY AND MARKET STRUCTURE
  10.   2.1 MARKET INTRODUCTION
  11.     2.1.1 Definition
  12.     2.1.2 Scope of the study
  13.       2.1.2.1 Research Objective
  14.       2.1.2.2 Assumption
  15.       2.1.2.3 Limitations
  16.   2.2 RESEARCH METHODOLOGY
  17.     2.2.1 Overview
  18.     2.2.2 Data Mining
  19.     2.2.3 Secondary Research
  20.     2.2.4 Primary Research
  21.       2.2.4.1 Primary Interviews and Information Gathering Process
  22.       2.2.4.2 Breakdown of Primary Respondents
  23.     2.2.5 Forecasting Model
  24.     2.2.6 Market Size Estimation
  25.       2.2.6.1 Bottom-Up Approach
  26.       2.2.6.2 Top-Down Approach
  27.     2.2.7 Data Triangulation
  28.     2.2.8 Validation
  29. 3 SECTION III: QUALITATIVE ANALYSIS
  30.   3.1 MARKET DYNAMICS
  31.     3.1.1 Overview
  32.     3.1.2 Drivers
  33.     3.1.3 Restraints
  34.     3.1.4 Opportunities
  35.   3.2 MARKET FACTOR ANALYSIS
  36.     3.2.1 Value chain Analysis
  37.     3.2.2 Porter's Five Forces Analysis
  38.       3.2.2.1 Bargaining Power of Suppliers
  39.       3.2.2.2 Bargaining Power of Buyers
  40.       3.2.2.3 Threat of New Entrants
  41.       3.2.2.4 Threat of Substitutes
  42.       3.2.2.5 Intensity of Rivalry
  43.     3.2.3 COVID-19 Impact Analysis
  44.       3.2.3.1 Market Impact Analysis
  45.       3.2.3.2 Regional Impact
  46.       3.2.3.3 Opportunity and Threat Analysis
  47. 4 SECTION IV: QUANTITATIVE ANALYSIS
  48.   4.1 Chemicals and Materials, BY Type (USD Billion)
  49.     4.1.1 Water-Based Fluids
  50.     4.1.2 Oil-Based Fluids
  51.     4.1.3 Synthetic-Based Fluids
  52.     4.1.4 Gas-Based Fluids
  53.   4.2 Chemicals and Materials, BY Application (USD Billion)
  54.     4.2.1 Onshore Drilling
  55.     4.2.2 Offshore Drilling
  56.     4.2.3 Geothermal Energy
  57.     4.2.4 Mining
  58.   4.3 Chemicals and Materials, BY Function (USD Billion)
  59.     4.3.1 Cooling
  60.     4.3.2 Lubrication
  61.     4.3.3 Cuttings Removal
  62.     4.3.4 Pressure Control
  63.   4.4 Chemicals and Materials, BY End Use (USD Billion)
  64.     4.4.1 Oil and Gas
  65.     4.4.2 Construction
  66.     4.4.3 Environmental
  67.     4.4.4 Mining
  68. 5 SECTION V: COMPETITIVE ANALYSIS
  69.   5.1 Competitive Landscape
  70.     5.1.1 Overview
  71.     5.1.2 Competitive Analysis
  72.     5.1.3 Market share Analysis
  73.     5.1.4 Major Growth Strategy in the Chemicals and Materials
  74.     5.1.5 Competitive Benchmarking
  75.     5.1.6 Leading Players in Terms of Number of Developments in the Chemicals and Materials
  76.     5.1.7 Key developments and growth strategies
  77.       5.1.7.1 New Product Launch/Service Deployment
  78.       5.1.7.2 Merger & Acquisitions
  79.       5.1.7.3 Joint Ventures
  80.     5.1.8 Major Players Financial Matrix
  81.       5.1.8.1 Sales and Operating Income
  82.       5.1.8.2 Major Players R&D Expenditure. 2023
  83.   5.2 Company Profiles
  84.     5.2.1 Schlumberger (US)
  85.       5.2.1.1 Financial Overview
  86.       5.2.1.2 Products Offered
  87.       5.2.1.3 Key Developments
  88.       5.2.1.4 SWOT Analysis
  89.       5.2.1.5 Key Strategies
  90.     5.2.2 Halliburton (US)
  91.       5.2.2.1 Financial Overview
  92.       5.2.2.2 Products Offered
  93.       5.2.2.3 Key Developments
  94.       5.2.2.4 SWOT Analysis
  95.       5.2.2.5 Key Strategies
  96.     5.2.3 Baker Hughes (US)
  97.       5.2.3.1 Financial Overview
  98.       5.2.3.2 Products Offered
  99.       5.2.3.3 Key Developments
  100.       5.2.3.4 SWOT Analysis
  101.       5.2.3.5 Key Strategies
  102.     5.2.4 National Oilwell Varco (US)
  103.       5.2.4.1 Financial Overview
  104.       5.2.4.2 Products Offered
  105.       5.2.4.3 Key Developments
  106.       5.2.4.4 SWOT Analysis
  107.       5.2.4.5 Key Strategies
  108.     5.2.5 Weatherford International (US)
  109.       5.2.5.1 Financial Overview
  110.       5.2.5.2 Products Offered
  111.       5.2.5.3 Key Developments
  112.       5.2.5.4 SWOT Analysis
  113.       5.2.5.5 Key Strategies
  114.     5.2.6 Newpark Resources (US)
  115.       5.2.6.1 Financial Overview
  116.       5.2.6.2 Products Offered
  117.       5.2.6.3 Key Developments
  118.       5.2.6.4 SWOT Analysis
  119.       5.2.6.5 Key Strategies
  120.     5.2.7 Aker Solutions (NO)
  121.       5.2.7.1 Financial Overview
  122.       5.2.7.2 Products Offered
  123.       5.2.7.3 Key Developments
  124.       5.2.7.4 SWOT Analysis
  125.       5.2.7.5 Key Strategies
  126.     5.2.8 Cimarex Energy (US)
  127.       5.2.8.1 Financial Overview
  128.       5.2.8.2 Products Offered
  129.       5.2.8.3 Key Developments
  130.       5.2.8.4 SWOT Analysis
  131.       5.2.8.5 Key Strategies
  132.     5.2.9 Tetra Technologies (US)
  133.       5.2.9.1 Financial Overview
  134.       5.2.9.2 Products Offered
  135.       5.2.9.3 Key Developments
  136.       5.2.9.4 SWOT Analysis
  137.       5.2.9.5 Key Strategies
  138.   5.3 Appendix
  139.     5.3.1 References
  140.     5.3.2 Related Reports
  141. 6 LIST OF FIGURES
  142.   6.1 MARKET SYNOPSIS
  143.   6.2 US MARKET ANALYSIS BY TYPE
  144.   6.3 US MARKET ANALYSIS BY APPLICATION
  145.   6.4 US MARKET ANALYSIS BY FUNCTION
  146.   6.5 US MARKET ANALYSIS BY END USE
  147.   6.6 KEY BUYING CRITERIA OF CHEMICALS AND MATERIALS
  148.   6.7 RESEARCH PROCESS OF MRFR
  149.   6.8 DRO ANALYSIS OF CHEMICALS AND MATERIALS
  150.   6.9 DRIVERS IMPACT ANALYSIS: CHEMICALS AND MATERIALS
  151.   6.10 RESTRAINTS IMPACT ANALYSIS: CHEMICALS AND MATERIALS
  152.   6.11 SUPPLY / VALUE CHAIN: CHEMICALS AND MATERIALS
  153.   6.12 CHEMICALS AND MATERIALS, BY TYPE, 2024 (% SHARE)
  154.   6.13 CHEMICALS AND MATERIALS, BY TYPE, 2024 TO 2035 (USD Billion)
  155.   6.14 CHEMICALS AND MATERIALS, BY APPLICATION, 2024 (% SHARE)
  156.   6.15 CHEMICALS AND MATERIALS, BY APPLICATION, 2024 TO 2035 (USD Billion)
  157.   6.16 CHEMICALS AND MATERIALS, BY FUNCTION, 2024 (% SHARE)
  158.   6.17 CHEMICALS AND MATERIALS, BY FUNCTION, 2024 TO 2035 (USD Billion)
  159.   6.18 CHEMICALS AND MATERIALS, BY END USE, 2024 (% SHARE)
  160.   6.19 CHEMICALS AND MATERIALS, BY END USE, 2024 TO 2035 (USD Billion)
  161.   6.20 BENCHMARKING OF MAJOR COMPETITORS
  162. 7 LIST OF TABLES
  163.   7.1 LIST OF ASSUMPTIONS
  164.     7.1.1
  165.   7.2 US MARKET SIZE ESTIMATES; FORECAST
  166.     7.2.1 BY TYPE, 2025-2035 (USD Billion)
  167.     7.2.2 BY APPLICATION, 2025-2035 (USD Billion)
  168.     7.2.3 BY FUNCTION, 2025-2035 (USD Billion)
  169.     7.2.4 BY END USE, 2025-2035 (USD Billion)
  170.   7.3 PRODUCT LAUNCH/PRODUCT DEVELOPMENT/APPROVAL
  171.     7.3.1
  172.   7.4 ACQUISITION/PARTNERSHIP
  173.     7.4.1

US Chemicals and Materials Market Segmentation

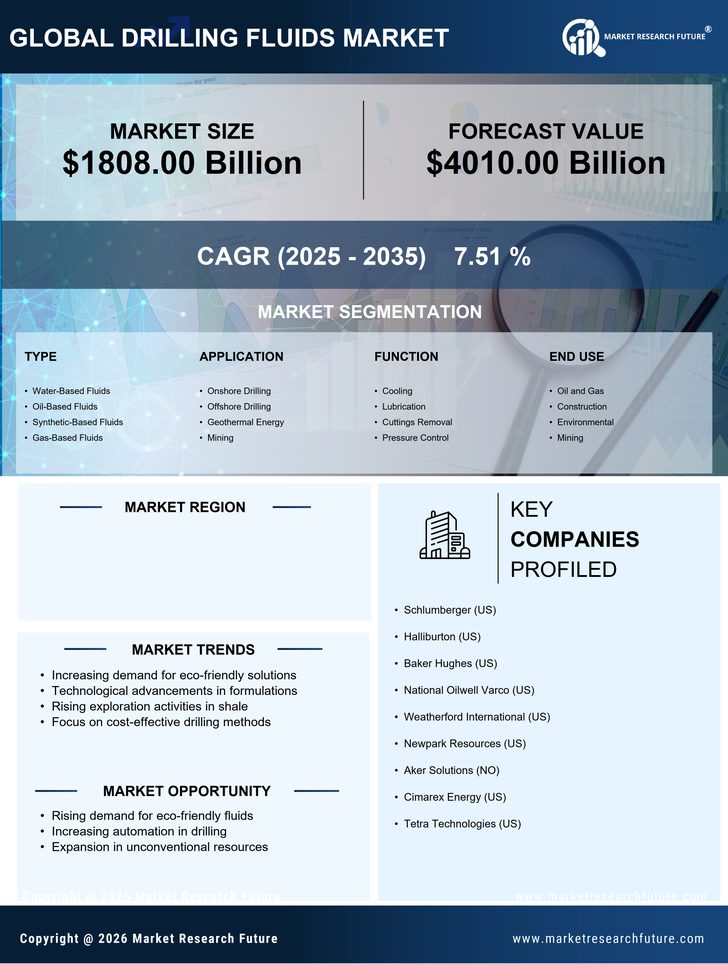
Chemicals and Materials By Type (USD Billion, 2025-2035)

  • Water-Based Fluids
  • Oil-Based Fluids
  • Synthetic-Based Fluids
  • Gas-Based Fluids

Chemicals and Materials By Application (USD Billion, 2025-2035)

  • Onshore Drilling
  • Offshore Drilling
  • Geothermal Energy
  • Mining

Chemicals and Materials By Function (USD Billion, 2025-2035)

  • Cooling
  • Lubrication
  • Cuttings Removal
  • Pressure Control

Chemicals and Materials By End Use (USD Billion, 2025-2035)

  • Oil and Gas
  • Construction
  • Environmental
  • Mining

Compare Licence

×
Features License Type
Single User Multiuser License Enterprise User
Price $4,950 $5,950 $7,250
Maximum User Access Limit 1 User Upto 10 Users Unrestricted Access Throughout the Organization
Free Customization
Direct Access to Analyst
Deliverable Format
Platform Access
Discount on Next Purchase 10% 15% 15%
Printable Versions