US Display Driver Market

ID: MRFR/SEM/14225-HCR
200 Pages
Ankit Gupta
Last Updated: April 06, 2026
US Display Driver Market Size, Share and Research Report By Type (Display Driver IC, Touch Display Driver Integration), By Device (Smartphone, Tablet, Wearable, TV, Automotive Display), By Technology (LCD, OLED, Others), and By Package Type (Chip-On-Glass, Chip-On-Film) - Industry Forecast Till 2035
Download PDF ×

We do not share your information with anyone. However, we may send you emails based on your report interest from time to time. You may contact us at any time to opt-out.

US Display Driver Market

Market Size

Forecast Period2025 - 2035
CAGR (2025 - 2035)6.23%
2024 Market Size$ 2,067.77 Million
2025 Market Size$ 2,196.59 Million
2035 Market Size$ 4,020.72 Million

Key Players

NVIDIA
Intel
Advanced Micro Devices
Texas Instruments
Qualcomm
Samsung Electronics
Opportunities
  • Expansion of the Gaming Industry
  • Increased Adoption of Smart Devices
  • Rising Demand for Automotive Displays
  1. 1 SECTION I: EXECUTIVE SUMMARY AND KEY HIGHLIGHTS
    1. 1.1 EXECUTIVE SUMMARY
      1. 1.1.1 Market Overview
      2. 1.1.2 Key Findings
      3. 1.1.3 Market Segmentation
      4. 1.1.4 Competitive Landscape
      5. 1.1.5 Challenges and Opportunities
      6. 1.1.6 Future Outlook
  2. 2 SECTION II: SCOPING, METHODOLOGY AND MARKET STRUCTURE
    1. 2.1 MARKET INTRODUCTION
      1. 2.1.1 Definition
      2. 2.1.2 Scope of the study
        1. 2.1.2.1 Research Objective
        2. 2.1.2.2 Assumption
        3. 2.1.2.3 Limitations
    2. 2.2 RESEARCH METHODOLOGY
      1. 2.2.1 Overview
      2. 2.2.2 Data Mining
      3. 2.2.3 Secondary Research
      4. 2.2.4 Primary Research
        1. 2.2.4.1 Primary Interviews and Information Gathering Process
        2. 2.2.4.2 Breakdown of Primary Respondents
      5. 2.2.5 Forecasting Model
      6. 2.2.6 Market Size Estimation
        1. 2.2.6.1 Bottom-Up Approach
        2. 2.2.6.2 Top-Down Approach
      7. 2.2.7 Data Triangulation
      8. 2.2.8 Validation
  3. 3 SECTION III: QUALITATIVE ANALYSIS
    1. 3.1 MARKET DYNAMICS
      1. 3.1.1 Overview
      2. 3.1.2 Drivers
      3. 3.1.3 Restraints
      4. 3.1.4 Opportunities
    2. 3.2 MARKET FACTOR ANALYSIS
      1. 3.2.1 Value chain Analysis
      2. 3.2.2 Porter's Five Forces Analysis
        1. 3.2.2.1 Bargaining Power of Suppliers
        2. 3.2.2.2 Bargaining Power of Buyers
        3. 3.2.2.3 Threat of New Entrants
        4. 3.2.2.4 Threat of Substitutes
        5. 3.2.2.5 Intensity of Rivalry
      3. 3.2.3 COVID-19 Impact Analysis
        1. 3.2.3.1 Market Impact Analysis
        2. 3.2.3.2 Regional Impact
        3. 3.2.3.3 Opportunity and Threat Analysis
  4. 4 SECTION IV: QUANTITATIVE ANALYSIS
    1. 4.1 Semiconductor & Electronics, BY Type (USD Million)
      1. 4.1.1 Display Driver IC
      2. 4.1.2 Touch Display Driver Integration
    2. 4.2 Semiconductor & Electronics, BY Device (USD Million)
      1. 4.2.1 Smartphone
      2. 4.2.2 Tablet
      3. 4.2.3 Wearable
      4. 4.2.4 TV
      5. 4.2.5 Automotive Display
    3. 4.3 Semiconductor & Electronics, BY Technology (USD Million)
      1. 4.3.1 LCD
      2. 4.3.2 OLED
      3. 4.3.3 Others
    4. 4.4 Semiconductor & Electronics, BY Package Type (USD Million)
      1. 4.4.1 Chip-On-Glass
      2. 4.4.2 Chip-On-Film
  5. 5 SECTION V: COMPETITIVE ANALYSIS
    1. 5.1 Competitive Landscape
      1. 5.1.1 Overview
      2. 5.1.2 Competitive Analysis
      3. 5.1.3 Market share Analysis
      4. 5.1.4 Major Growth Strategy in the Semiconductor & Electronics
      5. 5.1.5 Competitive Benchmarking
      6. 5.1.6 Leading Players in Terms of Number of Developments in the Semiconductor & Electronics
      7. 5.1.7 Key developments and growth strategies
        1. 5.1.7.1 New Product Launch/Service Deployment
        2. 5.1.7.2 Merger & Acquisitions
        3. 5.1.7.3 Joint Ventures
      8. 5.1.8 Major Players Financial Matrix
        1. 5.1.8.1 Sales and Operating Income
        2. 5.1.8.2 Major Players R&D Expenditure. 2023
    2. 5.2 Company Profiles
      1. 5.2.1 NVIDIA (US)
        1. 5.2.1.1 Financial Overview
        2. 5.2.1.2 Products Offered
        3. 5.2.1.3 Key Developments
        4. 5.2.1.4 SWOT Analysis
        5. 5.2.1.5 Key Strategies
      2. 5.2.2 Intel (US)
        1. 5.2.2.1 Financial Overview
        2. 5.2.2.2 Products Offered
        3. 5.2.2.3 Key Developments
        4. 5.2.2.4 SWOT Analysis
        5. 5.2.2.5 Key Strategies
      3. 5.2.3 Advanced Micro Devices (US)
        1. 5.2.3.1 Financial Overview
        2. 5.2.3.2 Products Offered
        3. 5.2.3.3 Key Developments
        4. 5.2.3.4 SWOT Analysis
        5. 5.2.3.5 Key Strategies
      4. 5.2.4 Texas Instruments (US)
        1. 5.2.4.1 Financial Overview
        2. 5.2.4.2 Products Offered
        3. 5.2.4.3 Key Developments
        4. 5.2.4.4 SWOT Analysis
        5. 5.2.4.5 Key Strategies
      5. 5.2.5 Qualcomm (US)
        1. 5.2.5.1 Financial Overview
        2. 5.2.5.2 Products Offered
        3. 5.2.5.3 Key Developments
        4. 5.2.5.4 SWOT Analysis
        5. 5.2.5.5 Key Strategies
      6. 5.2.6 Samsung Electronics (KR)
        1. 5.2.6.1 Financial Overview
        2. 5.2.6.2 Products Offered
        3. 5.2.6.3 Key Developments
        4. 5.2.6.4 SWOT Analysis
        5. 5.2.6.5 Key Strategies
      7. 5.2.7 LG Display (KR)
        1. 5.2.7.1 Financial Overview
        2. 5.2.7.2 Products Offered
        3. 5.2.7.3 Key Developments
        4. 5.2.7.4 SWOT Analysis
        5. 5.2.7.5 Key Strategies
      8. 5.2.8 STMicroelectronics (FR)
        1. 5.2.8.1 Financial Overview
        2. 5.2.8.2 Products Offered
        3. 5.2.8.3 Key Developments
        4. 5.2.8.4 SWOT Analysis
        5. 5.2.8.5 Key Strategies
      9. 5.2.9 MediaTek (TW)
        1. 5.2.9.1 Financial Overview
        2. 5.2.9.2 Products Offered
        3. 5.2.9.3 Key Developments
        4. 5.2.9.4 SWOT Analysis
        5. 5.2.9.5 Key Strategies
    3. 5.3 Appendix
      1. 5.3.1 References
      2. 5.3.2 Related Reports
  6. 6 LIST OF FIGURES
    1. 6.1 MARKET SYNOPSIS
    2. 6.2 US MARKET ANALYSIS BY TYPE
    3. 6.3 US MARKET ANALYSIS BY DEVICE
    4. 6.4 US MARKET ANALYSIS BY TECHNOLOGY
    5. 6.5 US MARKET ANALYSIS BY PACKAGE TYPE
    6. 6.6 KEY BUYING CRITERIA OF SEMICONDUCTOR & ELECTRONICS
    7. 6.7 RESEARCH PROCESS OF MRFR
    8. 6.8 DRO ANALYSIS OF SEMICONDUCTOR & ELECTRONICS
    9. 6.9 DRIVERS IMPACT ANALYSIS: SEMICONDUCTOR & ELECTRONICS
    10. 6.10 RESTRAINTS IMPACT ANALYSIS: SEMICONDUCTOR & ELECTRONICS
    11. 6.11 SUPPLY / VALUE CHAIN: SEMICONDUCTOR & ELECTRONICS
    12. 6.12 SEMICONDUCTOR & ELECTRONICS, BY TYPE, 2024 (% SHARE)
    13. 6.13 SEMICONDUCTOR & ELECTRONICS, BY TYPE, 2024 TO 2035 (USD Million)
    14. 6.14 SEMICONDUCTOR & ELECTRONICS, BY DEVICE, 2024 (% SHARE)
    15. 6.15 SEMICONDUCTOR & ELECTRONICS, BY DEVICE, 2024 TO 2035 (USD Million)
    16. 6.16 SEMICONDUCTOR & ELECTRONICS, BY TECHNOLOGY, 2024 (% SHARE)
    17. 6.17 SEMICONDUCTOR & ELECTRONICS, BY TECHNOLOGY, 2024 TO 2035 (USD Million)
    18. 6.18 SEMICONDUCTOR & ELECTRONICS, BY PACKAGE TYPE, 2024 (% SHARE)
    19. 6.19 SEMICONDUCTOR & ELECTRONICS, BY PACKAGE TYPE, 2024 TO 2035 (USD Million)
    20. 6.20 BENCHMARKING OF MAJOR COMPETITORS
  7. 7 LIST OF TABLES
    1. 7.1 LIST OF ASSUMPTIONS
  8. 7.1.1
    1. 7.2 US MARKET SIZE ESTIMATES; FORECAST
      1. 7.2.1 BY TYPE, 2025-2035 (USD Million)
      2. 7.2.2 BY DEVICE, 2025-2035 (USD Million)
      3. 7.2.3 BY TECHNOLOGY, 2025-2035 (USD Million)
      4. 7.2.4 BY PACKAGE TYPE, 2025-2035 (USD Million)
    2. 7.3 PRODUCT LAUNCH/PRODUCT DEVELOPMENT/APPROVAL
  9. 7.3.1
    1. 7.4 ACQUISITION/PARTNERSHIP
  10. 7.4.1

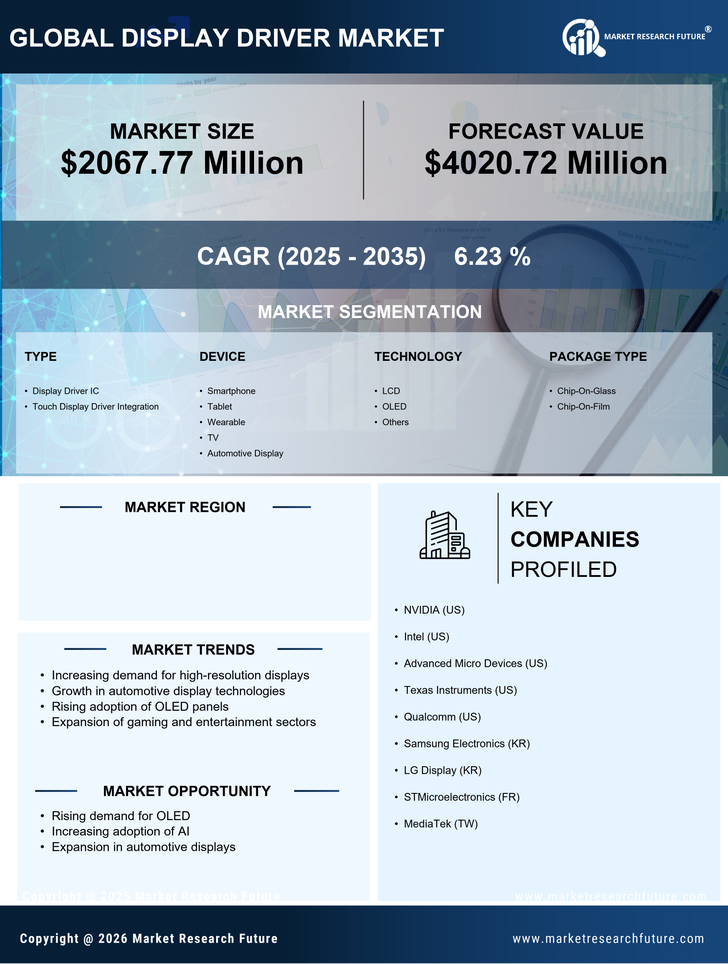
US Display Driver Market Segmentation

US Display Driver Market By Type (USD Million, 2025-2035)

  • Display Driver IC
  • Touch Display Driver Integration

US Display Driver Market By Device (USD Million, 2025-2035)

  • Smartphone
  • Tablet
  • Wearable
  • TV
  • Automotive Display

US Display Driver Market By Technology (USD Million, 2025-2035)

  • LCD
  • OLED
  • Others

US Display Driver Market By Package Type (USD Million, 2025-2035)

  • Chip-On-Glass
  • Chip-On-Film