US US Data Center Rack Market Segmentation
US Data Center Rack Market By Component (USD Million, 2025-2035)
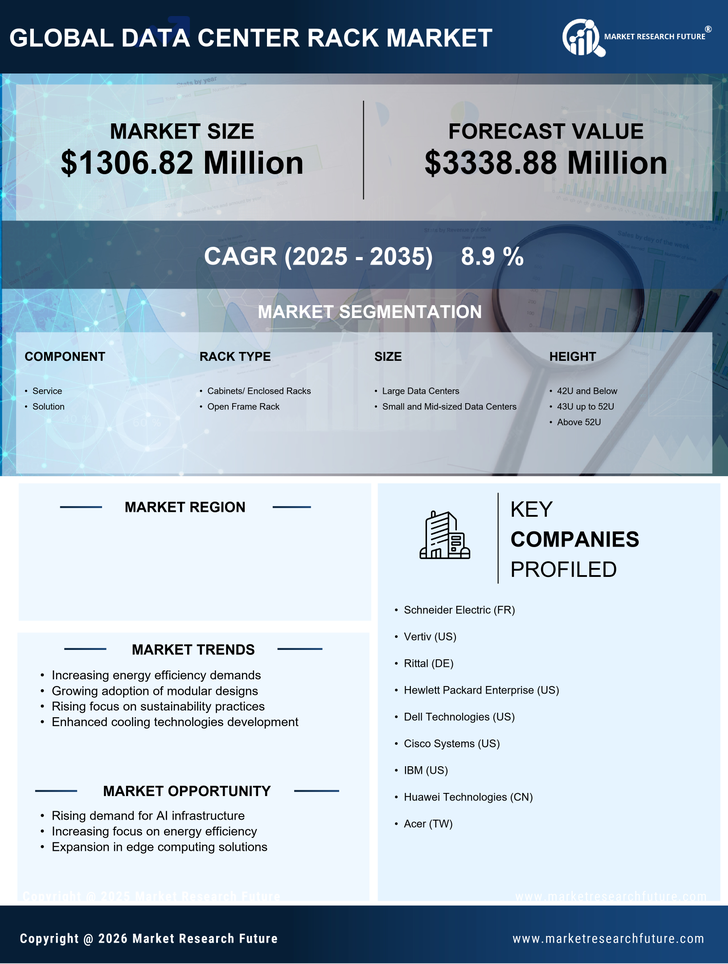
- Service
- Solution
US Data Center Rack Market By Rack Type (USD Million, 2025-2035)
- Cabinets/ Enclosed Racks
- Open Frame Rack
US Data Center Rack Market By Size (USD Million, 2025-2035)
- Large Data Centers
- Small and Mid-sized Data Centers
US Data Center Rack Market By Height (USD Million, 2025-2035)
- 42U and Below
- 43U up to 52U
- Above 52U
US Data Center Rack Market By Industry (USD Million, 2025-2035)
- BFSI
- Healthcare
- IT and Telecom
- Manufacturing
- Media and Entertainment
- Others
- Retail